Population density estimates and conservation concern for clouded leopards Neofelis nebulosa, marbled cats Pardofelis marmorata and tigers ...

Page created by Brian Powers
 
CONTINUE READING
Population density estimates and conservation concern for clouded leopards Neofelis nebulosa, marbled cats Pardofelis marmorata and tigers ...
Population density estimates and conservation
             concern for clouded leopards Neofelis nebulosa,
             marbled cats Pardofelis marmorata and tigers
             Panthera tigris in Htamanthi Wildlife Sanctuary,
             Sagaing, Myanmar
                                                                                           HLA NAING, JOANNA ROSS, DAWN BURNHAM
                                                                                                S A W H T U N and D A V I D W . M A C D O N A L D

             Abstract The clouded leopard Neofelis nebulosa is a potent                             Keywords Ambassador species, camera trapping, clouded
             ambassador species for conservation, occurring from the                                leopard Neofelis nebulosa, density estimate, marbled cat
             Himalayan foothills eastwards to Indochina, between                                    Pardofelis marmorata, spatial capture–recapture, tiger
             which Myanmar is a biogeographical land bridge. In                                     Panthera tigris
             Myanmar’s Northern Forest Complex, the species co-occurs
             with the tiger Panthera tigris, leopard Panthera pardus,
             marbled cat Pardofelis marmorata, golden cat Catopuma                                  Introduction
             temminckii and leopard cat Prionailurus bengalensis. We
             deployed cameras within the Htamanthi Wildlife
             Sanctuary over  consecutive years. In – we
             deployed  camera stations around the Nam Pa Gon stream
                                                                                                    A        guild of wild species of Felidae comprising various
                                                                                                           combinations of up to eight species (Macdonald
                                                                                                    et al., ) is distributed across South-east Asia, with
             (Catchment ) for , trap days. In – we deployed                            species ranging in size from the tiger Panthera tigris to the
              camera stations around the Nam E Zu stream (Catchment                               flat-headed cat Prionailurus planiceps. Little is known of the
             ) for , trap days. In Catchment  we identified five tigers                       ecology of most of these species, and less of their guilds.
             from  detections, five clouded leopards from  detections                           Amongst the least known is the clouded leopard Neofelis
             ( photographs) and  marbled cats from  detections.                               nebulosa, a potent ambassador species for conservation
             Using Bayesian-based spatial capture–recapture we esti-                                (Macdonald et al., unpubl. data) that occurs from the
             mated the densities of tigers and clouded leopards to be                               Himalayan foothills and eastwards to Indochina, between
             . ± SD . and . ± SD . individuals per  km,                             which Myanmar serves as a biogeographical land bridge.
             respectively. In Catchment  we identified two tigers from                             The species occupies areas undergoing some of the most
             three detections, nine clouded leopards from  detections                             rapid deforestation (Hansen et al., ), and is threatened
             and  marbled cats from  detections. Densities of clouded leo-                      by poaching and wildlife trafficking (D’Cruze &
             pards and marbled cats were . ± SD . and . ± SD .                          Macdonald, ; Nijman & Shepherd, ; Min et al., in
             individuals per  km, respectively. These differences sug-                          press). Clouded leopards are the apex predators in many
             gest that human activities, in particular gold mining, are af-                         South-east Asian rainforests, although where they co-occur
             fecting felid populations, and these are a paramount concern                           with larger predators such as tigers their density and habitat
             in Htamanthi. We demonstrate the importance of                                         use may vary (Sunquist & Sunquist, ; Sunarto et al.,
             Htamanthi within the Northern Forest Complex and high-                                 ). Although there have been discoveries regarding the
             light the Yawbawmee corridor as a candidate for protection.                            felid guilds and habitat use of the Sunda clouded leopard
                                                                                                    Neofelis diardi (Haidir et al., ; Sollmann et al., ;
                                                                                                    Hearn et al., ; Macdonald et al., unpubl. data), and the
                                                                                                    threat to the species from habitat loss (Cushman et al., ),
                                                                                                    little is known for the mainland clouded leopard and the fe-
             HLA NAING* and SAW HTUN Wildlife Conservation Society Myanmar, Yangon,
                                                                                                    lids with which it is sympatric.
             Myanmar                                                                                    In Myanmar the density of clouded leopards has not
             JOANNA ROSS, DAWN BURNHAM and DAVID W. MACDONALD (Corresponding                        been estimated; however, of the  areas of the country sur-
             author) Wildlife Conservation Research Unit, Department of Zoology,                    veyed (by camera trapping) for tigers during –,
             University of Oxford, The Recanati-Kaplan Centre, Tubney House, Tubney,
             OX13 5QL, UK. E-mail david.macdonald@zoo.ox.ac.uk
                                                                                                    clouded leopards were found in  areas and tigers in
                                                                                                    three (Myanmar Forest Department, ). In  clouded
             *Also at: Wildlife Conservation Research Unit, Department of Zoology,
             University of Oxford, The Recanati-Kaplan Centre, Tubney, UK                           leopards were recorded in three mountainous regions of
             Received  May . Revision requested  September .                            northern Myanmar where they had not been recorded pre-
             Accepted  August . First published online  November .                       viously (Zaw et al., ), and at a fourth site in the south

                                                                                        Oryx, 2019, 53(4), 654–662 © 2017 Fauna & Flora International doi:10.1017/S0030605317001260
Downloaded from https://www.cambridge.org/core. IP address: 46.4.80.155, on 21 Feb 2021 at 15:18:55, subject to the Cambridge Core terms of use, available at https://www.cambridge.org/core/terms.
https://doi.org/10.1017/S0030605317001260
Wild felids in Myanmar                655

                                                                                                  hills to the western and south-western part of the
                                                                                                  Sanctuary, and most from the eastern side can be navigated
                                                                                                  by boat throughout the year, except for their upper reaches
                                                                                                  in the driest parts of summer. There are three main footpaths
                                                                                                  connecting villages on the west and east sides of the
                                                                                                  Sanctuary. There are four management zones, Nam Phi
                                                                                                  Lin, Nam E Zu, Nam Pa Gon and Nam Yan Yin; this study
                                                                                                  was conducted in an area of  km in Nam Pa Gon and of
                                                                                                   km in Nam E Zu.

                                                                                                  Methods

                                                                                                  Camera trapping

                                                                                                  We used two models of passive infrared digital camera traps
                                                                                                  (Cuddeback, Non Typical Inc., De Pere, USA, and
                                                                                                  ScoutGuard, HCO Outdoor Products, Norcross, USA).
                                                                                                  During  December – March  we deployed  cam-
                                                                                                  era stations in Catchment , Nam Pa Gon, with .–. km
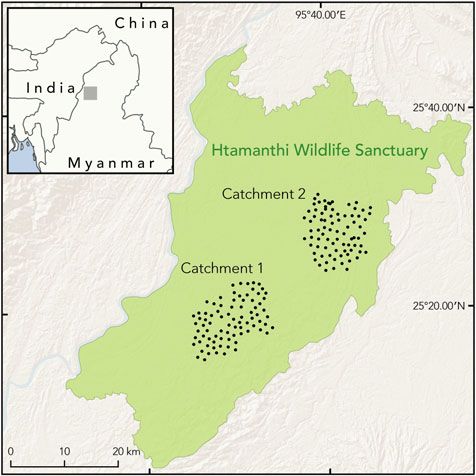
           FIG. 1 Locations of camera traps in Catchments  and  of                              between camera stations. During  December –
           Htamanthi Wildlife Sanctuary, in north-western Myanmar.                                March  we deployed  camera stations in Catchment
                                                                                                  , Nam E Zu, with similar spacing. At each station we used
                                                                                                  unbaited, paired camera traps, set at c.  cm height from
           (WCS, , unpubl. data). Clouded leopards have also been                             ground level and c. . m either side of the trail.
           confirmed in several locations in the east of the country
           (Moo et al., ). Among the northern sites, Htamanthi
                                                                                                  Analysis
           Wildlife Sanctuary is particularly important because of its
           proximity to the Northern Forest Complex. This vast con-                               We estimated population densities of tigers, clouded
           tiguous forest landscape (, km), probably the largest                            leopards and marbled cats, using a spatially explicit
           in Asia, lies in a transition zone of three biodiversity hot-                          capture–recapture model implemented within a Bayesian
           spots, all of which contain clouded leopards and tigers:                               framework using the package SPACECAP v. ..
           Himalaya, Indo-Burma and the Mountains of Southwest                                    (Gopalaswamy et al., ) in R v .. (R Development
           China (Myers et al., ; Conservation International, ).                          Core Team, ). Individual identification was carried
              As part of a range-wide camera-trapping study of the                                out by at least two people, and detection histories for each
           clouded leopard and members of its guild we deployed cam-                              individual were then constructed. We considered each
           era traps in two catchments within the Htamanthi Wildlife                              -hour period to be a sampling occasion, as short sampling
           Sanctuary over  consecutive years. Htamanthi Wildlife                                 intervals can improve the precision of estimates in spatially
           Sanctuary is the southernmost Key Biodiversity Area of                                 explicit capture–recapture analyses (Goldberg et al., ).
           the Northern Forest Complex (also Tiger Conservation                                   To assume we were surveying a demographically closed
           Landscape , GTRP, ).                                                             population we used a -day survey period for tigers and
                                                                                                  clouded leopards. Marbled cats are smaller and therefore
           Study area                                                                             may have a higher population turnover, so we subsampled
                                                                                                  a -day period that maximized detections for marbled cats.
           Htamanthi Wildlife Sanctuary (, km) is one of the                                 For clouded leopards we explored the consequences of
           largest protected areas in the region, located between the                             adopting a -day period, again subsampled to maximize
           Chindwin and Uru Rivers in north-western Myanmar                                       detections. These are similar or shorter durations compared
           (Fig. ). The area is characterized by tropical evergreen                              with other estimates of population density, justifying the as-
           forest, with some mixed deciduous forest in the western                                sumed sampling of a closed population (e.g. Brodie &
           portion and dry mixed deciduous forest types along the east-                           Giordano, ; Wilting et al., ; Mohamed et al., ;
           ern boundary (Arino et al., ). The area was gazetted for its                       Hearn et al., ). We constructed the state space by adding
           megafauna, including the Asian elephant Elephas maximus,                               a buffer to the coordinates of the outermost camera stations,
           tiger, gaur Bos gaurus, Asiatic black bear Ursus thibetanus,                           using ArcMap . (ESRI, Redlands, USA). We then added
           sun bear Helarctos malayanus and clouded leopard. Seven                                potential activity centres by generating regularly spaced
           streams flow in parallel from the eastern and north-eastern                            points with a resolution of . km (tigers and clouded

           Oryx, 2019, 53(4), 654–662 © 2017 Fauna & Flora International doi:10.1017/S0030605317001260
Downloaded from https://www.cambridge.org/core. IP address: 46.4.80.155, on 21 Feb 2021 at 15:18:55, subject to the Cambridge Core terms of use, available at https://www.cambridge.org/core/terms.
https://doi.org/10.1017/S0030605317001260
656         H. Naing et al.

             leopards) or . km (marbled cats) within this buffer. Each

                                                                                                          independent detections of clouded leopards Neofelis nebulosa, tigers Panthera tigris and marbled cats Pardofelis marmorata, numbers of individuals detected and number of detections per
                                                                                                          TABLE 1 Survey effort and number of sampling occasions at the two study sites (Catchments  and ) in Htamanthi Wildlife Sanctuary, in north-western Myanmar (Fig. ), with numbers of

                                                                                                                                                                                                                                                                                                                                                                                                                                  6(3), 5(2), 4(3), 1(2), 1(1), 1(1), 1(1), 1(1), 1(1), 1(1), 1(1), 1(1)
             activity centre was designated either habitat or non-habitat,
             based on local knowledge of the area. As land outside the
             boundaries of the park is largely agricultural and human

                                                                                                                                                                                                                                                                                                                                                                 2(2), 2(1), 2(1), 1(1), 1(1), 1(1), 1(1), 1(1), 1(1), 1(1)
             presence is high, we designated all activity centre points

                                                                                                                                                                                                                                                                                                                                                                                                                                 11(8), 10(9), 4(4), 4(2), 3(2), 3(2), 2(2), 2(1), 1(1)
                                                                                                                                                                                                                                                                                                                                                                                                                                 10(7), 5(5), 4(4), 3(2), 2(2), 2(2), 2(2), 2(1), 1(1)
                                                                                                                                                                                                                                                                                                           No. of detections per individual (no. of camera
             falling outside the park as non-habitat. We increased the

                                                                                                                                                                                                                                                                                                           stations at which each individual was detected)
             size of the state space during preliminary analyses until
             the probability of detection at the edge of the state space
             became negligible. We determined that a buffer of  km
             was sufficient for clouded leopards and tigers, and a buffer
             of  km was appropriate for marbled cats. For all analyses

                                                                                                                                                                                                                                                                                                                                                                19(13), 1(1), 13(15), 1(1), 1(1)
                                                                                                                                                                                                                                                                                                                                                                16(12), 2(2), 1(1), 1(1), 1(1)
                                                                                                                                                                                                                                                                                                                                                                 6(7), 6(6), 1(5), 1(4), 1(2)
             we ran SPACECAP with trap response absent, half normal
             detection function, , iterations and a thinning rate
             of . In SPACECAP parameter convergence is assessed
             using Geweke z scores; values between –. and . are
             considered to be acceptable. We increased the burn-in
             (the number of initial iterations discarded during the
             analysis) during preliminary runs until the Geweke z scores
             fell within this range. The upper limit to the population
             size within the state space is set by the data augmentation

                                                                                                                                                                                                                                                                                                     (sampling period)
             value. We increased this value until ψ (the ratio of the

                                                                                                                                                                                                                                                                                                     of individuals
             estimated abundance within the state space to the maximum
             defined by the data augmentation value) was # .. For

                                                                                                                                                                                                                                                                                                     Total no.

                                                                                                                                                                                                                                                                                                                                                                11 (10)

                                                                                                                                                                                                                                                                                                                                                                                                                                 12 (12)
             Catchment  we ran the clouded leopard data with a burn-in

                                                                                                                                                                                                                                                                                                                                                                 5 (5)
                                                                                                                                                                                                                                                                                                                                                                 5 (5)
                                                                                                                                                                                                                                                                                                                                                                 5 (5)

                                                                                                                                                                                                                                                                                                                                                                                                                                  9 (9)
                                                                                                                                                                                                                                                                                                                                                                                                                                  9 (9)
             of , for the -day peirod and , for the  day

                                                                                                                                                                                                                                                                                                                                                                                                                                  2
             period. The tiger data were run with a burn-in of ,.
                                                                                                                                                                                                                                                                                                           detections (sampling period)
             The data augmentation value was set to  for both
                                                                                                                                                                                                                                                                                                           Total no. of independent

             species. For Catchment  we ran the clouded leopard
             data with a burn-in of , and data augmentation of
              for both the - and -day periods. The marbled cat
             data were run with a burn-in of , and data augmenta-
             tion of . We compared clouded leopard densities
                                                                                                                                                                                                                                                                                                                                                                49 (41)
                                                                                                                                                                                                                                                                                                                                                                49 (24)
                                                                                                                                                                                                                                                                                                                                                                27 (26)
                                                                                                                                                                                                                                                                                                                                                                24 (13)

                                                                                                                                                                                                                                                                                                                                                                                                                                 54 (43)
                                                                                                                                                                                                                                                                                                                                                                                                                                 54 (32)
                                                                                                                                                                                                                                                                                                                                                                                                                                 37 (25)
             between catchments, and following Sollmann et al. ()
             we considered a difference to be significant if the % high-

                                                                                                                                                                                                                                                                                                                                                                                                                                  3
             est posterior density of one did not include the mean of the
                                                                                                                                                                                                                                                                                                           No. of sampling

             other.
                 As Asiatic golden cats do not have patterned coats they
                                                                                                                                                                                                                                                                                                           occasions

             are not reliably identifiable to individual, and therefore
             population densities cannot be estimated using these meth-
                                                                                                                                                                                                                                                                                                                                                                90
                                                                                                                                                                                                                                                                                                                                                                60

                                                                                                                                                                                                                                                                                                                                                                                                                                 90
                                                                                                                                                                                                                                                                                                                                                                                                                                 60
                                                                                                                                                                                                                                                                                                                                                                                                                                 60

             ods. For golden cats, leopard cats and potential felid prey
             detected by the cameras we calculated the number of inde-
                                                                                                                                                                                                                                                                                                           trap-days (closed period)

             pendent detections and naïve occupancy, which was calcu-
             lated as the proportion of camera stations at which the
                                                                                                                                                                                                                                                                                                           Total survey effort,

             species was detected.
                                                                                                                                                                                                                                                                                                                                                                7,354 (7,104)
                                                                                                                                                                                                                                                                                                                                                                7,354 (4,534)
                                                                                                                                                                                                                                                                                                                                                                7,354 (7,104)
                                                                                                                                                                                                                                                                                                                                                                7,354 (7,104)

                                                                                                                                                                                                                                                                                                                                                                                                                                 7,192 (6,861)
                                                                                                                                                                                                                                                                                                                                                                                                                                 7,192 (4,534)
                                                                                                                                                                                                                                                                                                                                                                                                                                 7,192 (4,727)
                                                                                                                                                                                                                                                                                                                                                                                                                                 7,192

             Results

             We detected all three focal species in both catchments, but
                                                                                                                                                                                                                                                                                                                                                             Clouded leopard
                                                                                                                                                                                                                                                                                                                                                             Clouded leopard

                                                                                                                                                                                                                                                                                                                                                                                                                              Clouded leopard
                                                                                                                                                                                                                                                                                                                                                                                                                              Clouded leopard

             detection frequencies and naïve occupancies varied greatly
                                                                                                                                                                                                                                                                                                                                                             Catchment 1

                                                                                                                                                                                                                                                                                                                                                                                                                              Catchment 2

             (Tables  & ). In Catchment  we were able to identify
                                                                                                                                                                                                                                                                                                                                                             Marbled cat

                                                                                                                                                                                                                                                                                                                                                                                                                              Marbled cat
                                                                                                          individual.

             % of the tiger photographs, .% of clouded leopard
                                                                                                                                                                                                                                                                                                                                     Species

             photographs and .% of marbled cat photographs to
                                                                                                                                                                                                                                                                                                                                                             Tiger

                                                                                                                                                                                                                                                                                                                                                                                                                              Tiger

             individual. Given the limited number of re-detections of

                                                                                        Oryx, 2019, 53(4), 654–662 © 2017 Fauna & Flora International doi:10.1017/S0030605317001260
Downloaded from https://www.cambridge.org/core. IP address: 46.4.80.155, on 21 Feb 2021 at 15:18:55, subject to the Cambridge Core terms of use, available at https://www.cambridge.org/core/terms.
https://doi.org/10.1017/S0030605317001260
Wild felids in Myanmar                657

           TABLE 2 The total number of independent detections, detection rate, and naïve occupancies for felid species and potential prey species of
           tigers and clouded leopards at the two study sites (Catchments  and ) in Htamanthi Wildlife Sanctuary, in north-western Myanmar
           (Fig. ).

                                                                             Total no. of independent detections
                                                                             (detection rate*)                                           Naïve occupancy
                                                                             Catchment 1                   Catchment 2
           Species                                                           (7,354 trap days)             (7,192 trap days)             Catchment 1               Catchment 2
           Tiger                                                              27 (0.37)                      3 (0.04)                    0.23                      0.04
           Clouded leopard                                                    49 (0.67)                     54 (0.75)                    0.44                      0.39
           Asiatic golden cat Catopuma temminckii                            104 (1.41)                     62 (0.86)                    0.41                      0.28
           Marbled cat                                                        24 (0.33)                     37 (0.51)                    0.16                      0.23
           Leopard cat Prionailurus bengalensis                               75 (1.02)                     84 (1.17)                    0.26                      0.3
           Leopard Panthera pardus                                             0 (0)                         1 (0.01)                    0                         0.01
           Gaur Bos gaurus                                                    67 (0.91)                     12 (0.17)                    0.34                      0.15
           Wild boar Sus scrofa                                              141 (1.92)                    122 (1.70)                    0.61                      0.56
           Northern red muntjac Muntiacus vaginalis                          563 (7.66)                    491 (6.83)                    0.94                      0.85
           Sambar deer Rusa unicolor                                           0 (0)                         1 (0.01)                    0                         0.01
           Chinese serow Capricornis milneedwardsii                            2 (0.03)                      0 (0)                       0.02                      0
           Malayan porcupine Hystrix brachyura                               121 (1.65)                    138 (1.92)                    0.30                      0.45
           Stump-tailed macaque Macaca arctoides                              35 (0.48)                     43 (0.60)                    0.34                      0.33
           Northern pig-tailed macaque Macaca leonina                         11 (0.15)                     12 (0.17)                    0.11                      0.14
           *The number of independent detections per  trap days

           marbled cats it was not possible to model these data, and the                          Numbers and population densities of tigers
           values are included for comparison only.
               The spatially explicit capture–recapture posterior sum-                            Given the substantial difference in tiger numbers detected
           maries of the model parameter values are in Table . The                               between the surveys of Catchments  and , although only
           Bayesian p-values indicated that the models were of ad-                                a year apart and separated by ,  km, it is not useful to cal-
           equate fit, and the Geweke z scores indicated that all                                 culate a mean from the aggregated data. However, had we
           model parameters converged. The estimated density for                                  extrapolated from the estimated population density in
           clouded leopards in Catchment  derived from the -day                                Catchment  this would have yielded an estimate of  tigers
           period is . ± SD . individuals per  km and from                              (range – tigers) in the Htamanthi Wildlife Sanctuary, simi-
           the -day period . ± SD . individuals per  km.                              lar to the estimate of  by Rabinowitz et al. () and within
           For tigers the density estimate is . ± SD . individuals                          the wide range of densities (.–. tigers per  km)
           per  km.                                                                           estimated in the Hukaung Valley (Lynam et al., ).
               In Catchment  we were able to identify % of the tiger                          Such an extrapolation might have seemed warranted in
           photographs, % of clouded leopard photographs and %                                the light of observations of field signs and prey, and the rela-
           of marbled cat photographs to individual. The clouded                                  tive abundance of the tiger’s preferred prey, the Eurasian
           leopard population density was significantly higher than in                            wild pig Sus scrofa, the gaur and the barking deer
           Catchment , with estimates of . ± SD . and . ± SD                            Muntiacus vaginalis (Hayward et al., ; Ngoprasert
           . individuals per  km from the - and -day peri-                             et al., ). During January –January  the
           ods, respectively. The population density of marbled cats                              Wildlife Conservation Society’s biological monitoring
           was . ± SD . individuals per  km. There were too                              team (monitoring the eastern hoolock gibbon Hoolock leu-
           few tiger detections to estimate population density (Table ).                         conedys), SMART (Spatial Monitoring and Reporting Tool)
                                                                                                  patrol teams and a community-based natural resource
                                                                                                  management team confirmed that tigers were present
           Discussion                                                                             from the southern buffer zone to the northern boundary
                                                                                                  of the Sanctuary (– km). However, the results from
           We present the first population density estimates for the                              Catchment  suggest that the tiger population density may
           clouded leopard and marbled cat in Myanmar. We found                                   be significantly lower than in Catchment , and we consider
           that - and -day periods for clouded leopards yielded                               possible explanations for this below. Our estimates of tiger
           almost identical results, and we are confident that surveying                          population densities are presented in the context of meth-
           for  days is appropriate to assume the population is                                 odologically comparable estimates elsewhere in South-east
           closed.                                                                                Asia in Table .

           Oryx, 2019, 53(4), 654–662 © 2017 Fauna & Flora International doi:10.1017/S0030605317001260
Downloaded from https://www.cambridge.org/core. IP address: 46.4.80.155, on 21 Feb 2021 at 15:18:55, subject to the Cambridge Core terms of use, available at https://www.cambridge.org/core/terms.
https://doi.org/10.1017/S0030605317001260
658                                                                             H. Naing et al.

                                                                                                                                                                                                                                                                                                                                                                                                                                     Abundance and population densities of clouded

                                                                                                                                                                                                                         *σ, movement parameter; λo, baseline trap encounter rate; Ψ, the ratio of the estimated abundance within the state space to the maximum allowable number set by the data augmentation value; N, number of
                                                                                                                                                     95% highest posterior
                                                                                                                                                                                                                                                                                                                                                                                                                                     leopards

                                                                                                                                                                              3,051.80–8,082.48

                                                                                                                                                                                                     706.41–1,377.14
                                                                                                                                                     density interval                                                                                                                                                                                                                                                                With no previous data on clouded leopard numbers in the

                                                                                                                                                                              0.001–0.02

                                                                                                                                                                                                     0.003–0.02
                                                                                                                                                                              0.04–0.41

                                                                                                                                                                              0.32–1.55

                                                                                                                                                                                                     0.20–0.70

                                                                                                                                                                                                     4.0–13.75
                                                                                                                                                                                                                                                                                                                                                                                                                                     Sanctuary we cannot assess whether their abundance has

                                                                                                                                                                                                     44–151
                                                                                                                                                                                                                                                                                                                                                                                                                                     changed, but we present our data for comparison with

                                                                                                                                                                              5–24
                                                                                                                                                                                                                                                                                                                                                                                                                                     methodologically comparable studies for other populations
                                                                                                                                                                                                                                                                                                                                                                                                                                     of N. nebulosa and N. diardi in Table .
                                                                                                                                                                              5,247.34 ± 1,438.47

                                                                                                                                                                                                     1,014.65 ± 185.28
                                                                                                                                                                                                        0.011 ± 0.005

                                                                                                                                                                                                        96.11 ± 28.47
                                                                                                                                                                                                                                                                                                                                                                                                                                     Population density of marbled cats, and naïve occupancy
                                                                                                                                                                                 0.009 ± 0.01
                                                                                                                                                                                  0.20 ± 0.10
                                                                                                                                                                                 12.58 ± 6.18
                                                                                                                                                                                  0.81 ± 0.40

                                                                                                                                                                                                         0.43 ± 0.13

                                                                                                                                                                                                         8.80 ± 2.60
                                                                                                                                                                                                                                                                                                                                                                                                                                     of other felids and potential prey
                                                                                                                                                              Mean ± SD

                                                                                                                                                                                  0.57

                                                                                                                                                                                                         0.74
                                                                                                                                                                                                                                                                                                                                                                                                                                     Marbled cats are little studied and there are only two other
                                                                                                                         Tigers

                                                                                                                                                                                                                                                                                                                                                                                                                                     estimates for comparison. Hearn et al. () found dens-
                                                                                                                                                                                                                                                                                                                                                                                                                                     ities of .–. individuals per  km, depending on
                                                                                                                                                                                                                                                                                                                                                                                                                                     study area, and Singh & Macdonald () report densities
                                                                                                                                                                                                                                                                                                                                                                                                                                     of . individuals per  km. Our results are in line with
                                                                                                                                                     95% highest posterior

                                                                                                                                                                                                                                                                                                                                                                                                                                     these estimates. Our naïve occupancy estimates for felids are
                                                                                                                                                                              3,823.74–7,676.21

                                                                                                                                                                                                     1,949.91–4,416.69

                                                                                                                                                                                                                                                                                                                                                                                                                                     comparable to those reported in previous studies; for ex-
                                                                                                                                                     density interval

                                                                                                                                                                                                     0.0017–0.006

                                                                                                                                                                                                                                                                                                                                                                                                                                     ample, Haidir et al. () found that the naïve occupancy
                                                                                                                                                                              0.005–0.042
                                                                                                                                                                              0.04–0.30

                                                                                                                                                                              0.32–1.09

                                                                                                                                                                                                     0.12–0.63

                                                                                                                                                                                                     1.04–5.34

                                                                                                                                                                                                                                                                                                                                                                                                                                     of golden cats in Sumatra was ., and for Sunda clouded
          TABLE 3 Posterior summaries of the model parameters from SPACECAP for each analysis from Catchments  and .

                                                                                                                                                                                                     19–97

                                                                                                                                                                                                                                                                                                                                                                                                                                     leopards was .. The occupancy of ungulates has been
                                                                                                                                                                              5–17

                                                                                                                                                                                                                                                                                                                                                                                                                                     little studied in South-east Asia, but Gray & Prum ()
                                                                                                                         Clouded leopards, 60 days

                                                                                                                                                                                                                                                                                                                                                                                                                                     reported a naïve occupancy of . for gaur in Cambodia.
                                                                                                                                                                                                                                                                                                                                                                                                                                     This is similar to our result of . in Catchment . Gray
                                                                                                                                                                              5,632.55 ± 1,020.07

                                                                                                                                                                                                                                                                                                                                                                                                                                     () also reported that tiger abundance was also very
                                                                                                                                                                                                     3,045.93 ± 737.76
                                                                                                                                                                                                       0.0037 ± 0.001

                                                                                                                                                                                                        57.30 ± 20.55

                                                                                                                                                                                                                                                                                                                                                                                                                                     low in the same area of Cambodia, which suggests that
                                                                                                                                                                                 0.020 ± 0.01
                                                                                                                                                                                  0.16 ± 0.07
                                                                                                                                                                                  9.67 ± 3.72
                                                                                                                                                                                  0.62 ± 0.24

                                                                                                                                                                                                          0.36 ± 0.13

                                                                                                                                                                                                           3.2 ± 1.13

                                                                                                                                                                                                                                                                                                                                                                                                                                     low numbers of gaur may be limiting tiger populations in
                                                                                                                                                              Mean ± SD

                                                                                                                                                                                  0.42

                                                                                                                                                                                                          0.69

                                                                                                                                                                                                                                                                                                                                                                                                                                     these areas.

                                                                                                                                                                                                                                                                                                                                                                                                                                     Guild compositions and explanations for differences
                                                                                                                                                                                                                                                                                                                                                                                                                                     between Catchments 1 and 2
                                                                                                                                                     95% highest posterior

                                                                                                                                                                                                                                                                                                                                                                                                                                     Felid species and other mammalian carnivores occur
                                                                                                                                                                              3,975.97–8,061.17

                                                                                                                                                                                                     1,848.01–3,645.31
                                                                                                                                                     density interval

                                                                                                                                                                                                                                                                                                                                                                                                                                     throughout South-east Asia in various combinations.
                                                                                                                                                                                                     0.002–0.006

                                                                                                                                                                                                                                                                                                                                                                                                                                     These guilds offer the opportunity to study the ecological
                                                                                                                                                                              0.004–0.02

                                                                                                                                                                                                                         individuals in the state space; D, density (individuals per  km)
                                                                                                                                                                              0.04–0.30

                                                                                                                                                                              0.32–1.09

                                                                                                                                                                                                     0.14–0.60

                                                                                                                                                                                                     1.27–5.06

                                                                                                                                                                                                                                                                                                                                                                                                                                     processes of guild dynamics and, specifically, potential com-
                                                                                                                                                                                                     23–92

                                                                                                                                                                                                                                                                                                                                                                                                                                     petition between the member species. A plausible hypothesis
                                                                                                                                                                              5–17

                                                                                                                                                                                                                                                                                                                                                                                                                                     for wild felids, and one for which there is strong evidence
                                                                                                                         Clouded leopards, 90 days

                                                                                                                                                                                                                                                                                                                                                                                                                                     amongst the Canidae (Macdonald & Sillero-Zubiri, ),
                                                                                                                                                                                                                                                                                                                                                                                                                                     is that competition from larger species of felids will be inimi-
                                                                                                                                                                              5,906.68 ± 1,087.64

                                                                                                                                                                                                                                                                                                                                                                                                                                     cal to somewhat smaller species within a guild, and that this
                                                                                                                                                                                                     2,689.11 ± 499.88
                                                                                                                                                                                  0.01 ± 0.005

                                                                                                                                                                                                        0.004 ± 0.001

                                                                                                                                                                                                        55.39 ± 18.71

                                                                                                                                                                                                                                                                                                                                                                                                                                     in turn could result in mesopredator release for yet smaller
                                                                                                                                                                                  0.15 ± 0.07
                                                                                                                                                                                  9.35 ± 3.70
                                                                                                                                                                                  0.60 ± 0.24

                                                                                                                                                                                                         0.35 ± 0.12

                                                                                                                                                                                                         3.05 ± 1.03

                                                                                                                                                                                                                                                                                                                                                                                                                                     species. This does not appear to be the case on Sumatra,
                                                                                                                                                              Mean ± SD

                                                                                                                                                                                  0.47

                                                                                                                                                                                                         0.86

                                                                                                                                                                                                                                                                                                                                                                                                                                     where the Sunda clouded leopard co-occurs with tigers.
                                                                                                                                                                                                                                                                                                                                                                                                                                     Density estimates from Sumatra (Sollmann et al., )
                                                                                                                                                                                                                                                                                                                                                                                                                                     and Borneo (Brodie & Giordano, ; Wilting et al., ;
                                                                                                                                                                                                                                                                                                                                                                                                                                     Hearn et al., ) are broadly similar, suggesting that
                                                                                                                                                                                                                                                                                                                                                                                                                                     tigers are not a limiting factor for clouded leopards on
                                                                                                                                                                             Catchment 1

                                                                                                                                                                                                    Catchment 2

                                                                                                                                                                                                                                                                                                                                                                                                                                     Sumatra.
                                                                                                                                                                Parameter*

                                                                                                                                                                             Bayesian p

                                                                                                                                                                                                    Bayesian p

                                                                                                                                                                                                                                                                                                                                                                                                                                         Our comparison of Catchments  and  provides the op-
                                                                                                                                                                                                                                                                                                                                                                                                                                     portunity to evaluate the number of clouded leopards
                                                                                                                                                                             λo

                                                                                                                                                                                                    λo

                                                                                                                                                                                                                                                                                                                                                                                                                                     where tigers were relatively abundant and where they
                                                                                                                                                                             Ψ

                                                                                                                                                                                                    Ψ
                                                                                                                                                                             N

                                                                                                                                                                                                    N
                                                                                                                                                                             D

                                                                                                                                                                                                    D
                                                                                                                                                                             σ

                                                                                                                                                                                                    σ

                                                                                                                                                                                                                                         Oryx, 2019, 53(4), 654–662 © 2017 Fauna & Flora International doi:10.1017/S0030605317001260
Downloaded from https://www.cambridge.org/core. IP address: 46.4.80.155, on 21 Feb 2021 at 15:18:55, subject to the Cambridge Core terms of use, available at https://www.cambridge.org/core/terms.
https://doi.org/10.1017/S0030605317001260
Wild felids in Myanmar                659

           TABLE 4 Published estimates of tiger population density based on the use of spatially explicit techniques.

                                                                       Density                95% CI/highest            Spatially explicit
                                                                       (individuals           posterior density         capture–recapture
           Site                                                        per 100 km2)           interval                  method                          Source
           Ussuriiskii Nature Reserve, Russia                          0.112–0.586            *                         Bayesian                        Hernandez-Blanco
                                                                                                                                                        et al. (2013)
           Rajaji National Park, India                                 3.31 ± SD 1.51         1.56–7.03                 Bayesian                        Harihar et al. (2011)
                                                                       2.67 ± SD 0.97         1.24–4.96                 Bayesian
                                                                       5.17 ± SD 1.94         2.07–9.50                 Bayesian
                                                                       5.81 ± SD 2.26         1.86–9.92                 Bayesian
           Mudumalai Tiger Reserve, India                              8.31 ± SE 2.56         *                         Bayesian                        Kalle et al. (2011)
           Ranthambhore Tiger Reserve, India                           6.1 ± SE 1.2           *                         Maximum likelihood              Singh et al. (2014b)
           Kalakad-Mundanthurai Tiger Reserve, India                   2.9 ± SE 1.40          *                         Bayesian                        Ramesh et al. (2012)
                                                                       2.2 ± SE 1.6           *                         Maximum likelihood
           Pakke Tiger Reserve, India                                  1.86 ± SE 0.7          *                         Maximum likelihood              Selvan et al. (2014)
           Hunchun National Nature Reserve                             0.33 ± SD 0.10         0.18–0.56                 Bayesian                        Xiao et al. (2016)
                                                                       0.40 ± SD 0.12         0.20–0.68                 Bayesian
                                                                       0.30 ± SE 0.10         0.16–0.55                 Maximum likelihood
                                                                       0.24 ± SE 0.09         0.12–0.48                 Maximum likelihood
           Sundarbans, India                                           4.08 ± SE 1.51         0.18–0.56                 Maximum likelihood              Roy et al. (2016)
                                                                       5.81 ± SE 1.24                                   Maximum likelihood
           Suklaphanta Wildlife Reserve, Nepal                         2.10 ± SE 0.8          *                         Maximum likelihood              Karki (2011)
           Chitwan National Park, Nepal                                2.21 ± SD 0.42         1.41–3.01                 Bayesian                        Thapa & Kelly (2017)
                                                                       2.08 ± SD 1.13         0.31–4.39                 Bayesian                        Thapa & Kelly (2017)
           Pakke Tiger Reserve, India                                  0.97 ± SE 0.23         *                         Maximum likelihood              Singh et al. (2014a)
           *Data are not available.

           TABLE 5 Published estimates of clouded leopard population density based on the use of spatially explicit techniques.

                                                                    Density                 95% CI/highest          Spatially explicit
                                                                    (individuals per        posterior density       capture–recapture
           Site                                                     100 km2)                interval                method                       Source
           Sunda clouded leopard Neofelis diardi
           Tangkulap-Pinangah Forest Reserve, Sabah,                0.84 ± SD 0.42          0.25–1.83               Bayesian                     Wilting et al. (2012)
              Malaysia
           Segaliud Lokan Forest Reserve, Sabah,                    1.04 ± SD 0.58          0.29–2.55               Bayesian                     Wilting et al. (2012)
              Malaysia
           Maliau Basin Conservation Area, Sabah,                   1.90 ± SE*              0.70–5.40               Maximum                      Brodie & Giordano (2012)
              Malaysia                                                                                              likelihood
           Renah Kayu Embun, Sumatra, Indonesia                     1.57 ± SD 0.69          0.58–3.27               Bayesian                     Sollmann et al. (2014)
           Sipurak, Sumatra, Indonesia                              0.77 ± SD 0.52          0.15–2.10               Bayesian                     Sollmann et al. (2014)
           Bungo, Sumatra, Indonesia                                1.62 ± SD 0.73          0.58–3.37               Bayesian                     Sollmann et al. (2014)
           Ipuh, Sumatra, Indonesia                                 1.11 ± SD 0.47          0.42–2.24               Bayesian                     Sollmann et al. (2014)
           Danum Valley Conservation Area, Sabah,                   1.73 ± SD 0.54          0.81–2.78               Bayesian                     Hearn et al. (2017)
              Malaysia
           Tawau Hills Park, Sabah, Malaysia                        2.23 ± SD 0.52          1.35–3.27               Bayesian                     Hearn et al. (2017)
           Crocker Range Park, Sabah, Malaysia                      1.39 ± SD 0.41          0.77–2.21               Bayesian                     Hearn et al. (2017)
           Ulu Segama Forest Reserve, Sabah, Malaysia               3.10 ± SD 1.11          1.26–5.32               Bayesian                     Hearn et al. (2017)
           Tabin Wildlife Sanctuary, Sabah, Malaysia                2.66 ± SD 1.11          0.79–4.74               Bayesian                     Hearn et al. (2017)
           Kinabatangan Wildlife Sanctuary, Sabah,                  1.54 ± SD 0.70          0.41–2.90               Bayesian                     Hearn et al. (2017)
              Malaysia
           Mainland clouded leopard Neofelis
              nebulosa
           Manas National Park, India                               4.73 ± SE 1.43          *                       Maximum likelihood           Borah et al. (2014)
           Temengor, Malaysia                                       3.46 ± SE 1.00          1.98–6.04               Maximum likelihood           Mohamad et al. (2015)
           Belum, Malaysia                                          1.83 ± SE 0.61          0.97–3.48               Maximum likelihood           Mohamad et al. (2015)
           Dampa Wildlife Reserve, India                            5.14 ± SD 1.80          2.05–8.72               Bayesian                     Singh & Macdonald (2017)
           *Data are not available.

           Oryx, 2019, 53(4), 654–662 © 2017 Fauna & Flora International doi:10.1017/S0030605317001260
Downloaded from https://www.cambridge.org/core. IP address: 46.4.80.155, on 21 Feb 2021 at 15:18:55, subject to the Cambridge Core terms of use, available at https://www.cambridge.org/core/terms.
https://doi.org/10.1017/S0030605317001260
660         H. Naing et al.

                                                                                                                                              FIG. 2 Location of Htamanthi
                                                                                                                                              Wildlife Sanctuary in relation
                                                                                                                                              to Hukaung Valley Wildlife
                                                                                                                                              Sanctuary and other protected
                                                                                                                                              areas in the north of
                                                                                                                                              Myanmar.

             were less so. The difference in estimated population density                              Human presence could influence the mammalian
             of clouded leopards (. individuals per  km in                                    community structure in several ways. People may engen-
             Catchment  compared to . individuals per km in                                     der fear amongst both felids and their prey (e.g.
             Catchment ) is in line with the prediction of the intra-guild                         Oriol-Cotterill et al., a,b), and may affect tigers dir-
             hostility hypothesis.                                                                  ectly by killing them, and indirectly by killing their prey
                These comparisons raise the question of why there were                              (the absence of gaur and serow may be a case in point
             markedly fewer tigers in Catchment  than in Catchment ,                              and, being big prey, may affect the biggest felids); another
             and what other factors might underlie the different guild dy-                          possibility is that the domestic stock trafficked through
             namics observed between these surveys. Three obvious, and                              the protected area could transmit disease to the wild
             not mutually exclusive, hypotheses are that () there was a                            ungulates.
             difference in habitat or prey availability, or some other en-                             The anthropogenic hypothesis is sufficiently compelling,
             vironmental variable, between the two sites, () conditions                            and has such serious implications for conservation, that it
             changed between the two survey periods, or () some other                              merits further investigation as a priority. Rabinowitz et al.
             factor, such as an anthropogenic impact, caused the differ-                            () cautioned that the populations of tigers and gaur
             ences in felid guild structure, either directly or indirectly.                         were at risk of elimination if threats prevailing at the time
             Given that the two catchments are separated by ,  km                                 were not controlled, and we suspect this warning is now
             and seem generally similar, the habitat hypothesis is un-                              even more pressing.
             promising. However, two large prey species, gaur and
             serow Capricornis milneedwardsii, were detected less fre-
             quently in Catchment  (Table ). The temporal change                                  The Yawbawmee Corridor
             hypothesis is also unpromising, given that the two surveys
             were separated by barely  months. However, the third                                 The National Tiger Survey (–) confirmed the pres-
             hypothesis, that Catchment  was subject to damaging                                   ence of tigers in Hukaung Valley, Upper Chindwin,
             human activity, is strongly supported. SMART patrols and                               Htamanthi in northern Myanmar, and Tenasserim Hills
             incidental observations in  indicated that although there                          in the south. Our findings emphasize the importance of
             were human incursions in both areas, incidents of gold                                 Htamanthi within the northern Myanmar landscape. To
             mining were  times higher in Catchment  than in                                     the immediate north of Htamanthi lies the Yawbawmee
             Catchment , and .  snares were removed from                                         Corridor, , km of currently unprotected forest, which
             Catchment  compared with  in Catchment  for a similar                               could link Htamanthi with Hukaung Valley Wildlife
             patrol effort.                                                                         Sanctuary (Fig. ). The gazettement of this corridor would

                                                                                        Oryx, 2019, 53(4), 654–662 © 2017 Fauna & Flora International doi:10.1017/S0030605317001260
Downloaded from https://www.cambridge.org/core. IP address: 46.4.80.155, on 21 Feb 2021 at 15:18:55, subject to the Cambridge Core terms of use, available at https://www.cambridge.org/core/terms.
https://doi.org/10.1017/S0030605317001260
Wild felids in Myanmar                  661

           substantially increase the connectivity of the protected areas                             C U S H M A N , S.A., M AC D O N A L D , E.A., L A N D G U T H , E.L., M A L H I , Y. &
           of the Northern Forest Complex and would deliver a sub-                                       M AC D O N A L D , D.W. () Multiple-scale prediction of forest loss
                                                                                                         risk across Borneo. Landscape Ecology, , –.
           stantial contribution to landscape-level conservation of fe-
                                                                                                      D’C R U Z E , N. & M A C D O N A L D , D.W. () Clouded in mystery: the
           lids and other threatened species in the region.                                              global trade in clouded leopards. Biodiversity and Conservation, ,
                                                                                                         –.
                                                                                                      G O L D B E R G , J.F., T E M P A , T., N O R B U , N., H E B B L E W H I T E , M., M I L L S , L.
           Acknowledgements                                                                              S., W A N G C H U K , T.R. & L U K AC S , P. () Examining temporal
                                                                                                         sample scale and model choice with spatial capture–recapture
           The survey was funded jointly by a grant to DWM from                                          models in the common leopard Panthera pardus. PLoS ONE, (),
           Partnership for Change and by Wildlife Conservation                                           e.
           Society (WCS) Myanmar, with support and coordination                                       G O P A L A S WA M Y , A.M., R OY L E , J.A., H I N E S , J.E., S I N G H , P., J AT H A N N A ,
           from Htamanthi Wildlife Sanctuary, Nature Wildlife                                            D., K U M A R , N.S. & K A R A N T H , K.U. () Program SPACECAP:
                                                                                                         software for estimating animal density using spatially explicit
           Conservation Division, Myanmar Forest Department. We                                          capture–recapture models. Methods in Ecology and Evolution, ,
           thank Dr Nyi Nyi Kyaw, Director General of Myanmar                                            –.
           Forest Department, and U Win Naing Thaw, Director of                                       G R A Y , T.N.E. & P R U M , S. () Leopard density in post-conflict
           the Nature Wildlife Conservation Division under the                                           landscape, Cambodia: evidence from spatially explicit capture–
           Ministry of Natural Resources and Environmental                                               recapture. The Journal of Wildlife Management, , –.
                                                                                                      GTRP (G LO B A L T I G E R R E C O V E R Y P R O G R A M ) () Global Tiger
           Conservation, for granting permission and supporting the
                                                                                                         Recovery Program –. Http://documents.worldbank.org/
           project; Htamanthi Park Warden U Khin Maung Hla and                                           curated/en//pdf/WPBox
           park rangers for logistical support to our field team; the sur-                               FinalVersionEng.pdf [accessed  September ].
           vey team members for their tireless effort and dedication;                                 H A I D I R , I.A., D I N ATA , Y., L I N K I E , M. & M AC D O N A L D , D.W. ()
           WCS Myanmar Country Director U Than Myint, Northern                                           Asiatic golden cat and Sunda clouded leopard occupancy in
                                                                                                         the Kerinci Seblat landscape, West-Central Sumatra. Cat News, ,
           Forest Complex Coordinator U Than Zaw and staff for
                                                                                                         –.
           support throughout the project; and Cedric Tan and two an-                                 H A N S E N , M.C., P O TA P O V , P.V., M O O R E , R., H A N C H E R , M.,
           onymous reviewers for their valuable inputs. DWM gratefully                                   T U R U B A N O VA , S.A., T Y U K AV I N A , A. et al. () High-resolution
           acknowledges grants from the DASSK Trust and the                                              global maps of st-century forest cover change. Science, ,
           Irrawaddy Policy Exchange for the training of Myanmar con-                                    –.
           servationists and support of our clouded leopard programme.                                H A R I H A R , A., P A N D AV , B. & G OY A L , S.P. () Responses of leopard
                                                                                                         Panthera pardus to the recovery of a tiger Panthera tigris population.
           We thank the Recanati-Kaplan Foundation, Panthera and                                         Journal of Applied Ecology, , –.
           Robertson Foundation for their wider support of WildCRU.                                   H A Y WA R D , M.W., J Ę D R Z E J E W S K I , W. & J Ê D R Z E J E W S K A , B. ()
                                                                                                         Prey preferences of the tiger Panthera tigris. Journal of Zoology, ,
           Author contributions                                                                          –.
                                                                                                      H E A R N , A.J., R O S S , J., B E R N A R D , H., B A K A R , S.A., G O O S S E N S , B.,
           DWM, DB and SH conceived the study. DWM, SH and HN                                            H U N T E R , L.T.B. & M AC D O N A L D , D.W. () Responses of Sunda
                                                                                                         clouded leopard density to anthropogenic disturbance and refining
           designed the study and HN collected the data. JR and HN
                                                                                                         estimates of their conservation status in Sabah. Oryx, https://doi.
           conducted data analysis. DWM, DB, JR, SH and HN wrote                                         org/./S.
           the article.                                                                               H E A R N , A.J., R O S S , J., B E R N A R D , H., B A K A R , S.A., H U N T E R , L.T.B. &
                                                                                                         M AC D O N A L D , D.W. () The first estimates of marbled cat
                                                                                                         Pardofelis marmorata population density from Bornean primary
           References                                                                                    and selectively logged forest. PLoS ONE, (), e.
                                                                                                      H E R N A N D E Z -B L A N C O , J.A., R O Z H N O V , V.V., L U K A R E V S K I Y , V.S.,
           A R I N O , O., R A M O S P E R E Z , J.J., K A LO G I R O U , V., B O N T E M P S , S.,      N A I D E N KO , S.V., C H I S T O P O LOVA , M.D., S O R O K I N , P.A. et al. ()
              D E FO U R N Y , P. & V A N B O G A E R T , E. () Global Land Cover Map                Spatially explicit capture–recapture method (SECR, SPACECAP): a
              for  (GlobCover ). European Space Agency & Université                              new approach to determination of the Amur tiger (Panthera tigris
              catholique de Louvain. Http://dx.doi.org/./PANGAEA.                                  altaica) population density by means of camera-traps. Doklady
               [accessed  September ].                                                        Biological Sciences, , –.
           B O R A H , J., S H A R M A , T., D A S , D., R A B H A , N., K A K AT I , N.,             K A L L E , R., R A M E S H , T., Q U R E S H I , Q. & S A N K A R , K. () Density of
              B A S U M AT A R Y , A. et al. () Abundance and density estimates                      tiger and leopard in a tropical deciduous forest of Mudumalai Tiger
              for common leopard Panthera pardus and clouded leopard                                     Reserve, southern India, as estimated using photographic capture–
              Neofelis nebulosa in Manas National Park, Assam, India. Oryx, ,                          recapture sampling. Acta Theriologica, , –.
              –.                                                                                K A R K I , J.B. () Occupancy and abundance of tigers and their prey in
           B R O D I E , J. & G I O R D A N O , A.J. () Density of the Vulnerable Sunda              the Terai Arc Landscape, Nepal. PhD thesis. Forest Research
              clouded leopard Neofelis diardi in a protected area in Sabah,                              Institute University, Dehradun, India.
              Malaysian Borneo. Oryx, , –.                                                    L Y N A M , A.J., R A B I N OW I T Z , A., M Y I N T , T., M A U N G , M., L A T T , K.T. &
           C O N S E R VAT I O N I N T E R N AT I O N A L () Biodiversity Hotspots                   P O , S.H.T. () Estimating abundance with sparse data: tigers in
              Revisited. Conservation International, Washington, DC, USA.                                northern Myanmar. Population Ecology, , –.
              Http://www.biodiversityhotspots.org/xp/Hotspots/resources/maps.                         M AC D O N A L D , D.W. & S I L L E R O -Z U B I R I , C. () Dramatis personae.
              xml [accessed  October ].                                                            In The Biology and Conservation of Wild Canids (eds

           Oryx, 2019, 53(4), 654–662 © 2017 Fauna & Flora International doi:10.1017/S0030605317001260
Downloaded from https://www.cambridge.org/core. IP address: 46.4.80.155, on 21 Feb 2021 at 15:18:55, subject to the Cambridge Core terms of use, available at https://www.cambridge.org/core/terms.
https://doi.org/10.1017/S0030605317001260
662         H. Naing et al.

                D.W. Macdonald & C. Sillero-Zubiri), pp. –. Oxford University                                       conventional population estimation methods in a unique ecosystem
                Press, Oxford, UK.                                                                                     Population Ecology, , −.
             M AC D O N A L D , D.W., L O V E R I D G E , A.J. & N OW E L L , K. () Dramatis                   S E LVA N , K.M., L Y N G D O H , S., H A B I B , B. & G O P I , G.V. ()
                personae: an introduction to the wild felids. In The Biology and                                       Population density and abundance of sympatric large carnivores
                Conservation of Wild Felids (eds D.W. Macdonald & A.J. Loveridge),                                     in the lowland tropical evergreen forest of Indian Eastern Himalayas.
                pp. –. Oxford University Press, Oxford, UK.                                                         Mammalian Biology – Zeitschrift für Säugetierkunde, , –.
             M I N , S., D’C R U Z E , N. & M AC D O N A L D , D.W. (in press) A note on felid                     S I N G H , P. & M AC D O N A L D , D.W.M. () Populations and activity
                trade at local markets in Myanmar. Cat News, .                                                       patterns of clouded leopards and marbled cats in Dampa Tiger
             M O H A M A D , S.W., R A Y A N , D.M., C H R I S T O P H E R , W.C.T., H A M I R U L ,                   Reserve, India. Journal of Mammalogy, https://doi.org/./
                M., M O H A M E D , A., L A U , C.F. & S I WA N , E.S. () The first                                jmammal/gyx.
                description of population density and habitat use of the mainland                                  S I N G H , R., C H A U H A N , D.S., M I S H R A , S., K R A U S M A N , P.R. & G O Y A L ,
                clouded leopard Neofelis nebulosa within a logged-primary forest in                                    S.P. (a) Tiger density in a tropical lowland forest in the Eastern
                South East Asia. Population Ecology, , –.                                                      Himalayan Mountains. SpringerPlus, , .
             M O H A M E D , A., S O L L M A N N , R., B E R N A R D , H., A M B U , L.N., L A G A N , P.,         S I N G H , R., Q U R E S H I , Q., S A N K A R , K., K R A U S M A N , P.R. & G O YA L , S.P.
                M A N N A N , S. et al. () Density and habitat use of the leopard cat                              (b) Evaluating heterogeneity of sex-specific capture probability
                (Prionailurus bengalensis) in three commercial forest reserves in                                      and precision in camera-trap population estimates of tigers. Wildlife
                Sabah, Malaysian Borneo. Journal of Mammalogy, , –.                                              Society Bulletin, , –.
             M O O , S.S.B., F R O E S E , G.Z.L. & G R AY , T.N.E. () First structured                        S O L L M A N N , R., L I N K I E , M., H A I D I R , I.A. & M AC D O N A L D , D.W. ()
                camera-trap surveys in Karen State, Myanmar, reveal high diversity                                     Bringing clarity to the clouded leopard Neofelis diardi: first density
                of globally threatened mammals. Oryx, https://doi.org/./                                         estimates from Sumatra. Oryx, , –.
                S.                                                                                 S U N A R T O , S., K E L LY , M.J., P A R A K K A S I , K. & H U TA J U L U , M.B. ()
             M Y A N M A R F O R E S T D E P A R T M E N T () A National Tiger Action                              Cat coexistence in central Sumatra: ecological characteristics, spatial
                Plan for the Union of Myanmar. Myanmar Forest Department,                                              and temporal overlap, and implications for management. Journal of
                Ministry of Forestry, Yangon, Myanmar.                                                                 Zoology, , –.
             M Y E R S , N., M I T T E R M E I E R , R.A., M I T T E R M E I E R , C.G., D A F O N S E C A ,       S U N Q U I S T , M. & S U N Q U I S T , F. () Wild Cats of the World.
                G.A.B. & K E N T , J. () Biodiversity hotspots for conservation                                    University of Chicago Press, Chicago, USA.
                priorities. Nature, , –.                                                                  T H A P A , K. & K E L LY , M.J. () Density and carrying capacity in the
             N G O P R A S E R T , D., L Y N A M , A.J., S U K M A S U A N G , R., T A N T I P I S A N U H , N.,       forgotten tigerland: tigers in the understudied Nepalese Churia.
                C H U T I P O N G , W., S T E I N M E T Z , R. et al. () Occurrence of three                       Integrative Zoology, , –.
                felids across a network of protected areas in Thailand: prey,                                      W I LT I N G , A., M O H A M E D , A., A M B U , L.N., L A G A N , P., M A N N A N , S.,
                intraguild, and habitat associations. Biotropica, , –.                                         H O F E R , H. & S O L L M A N N , R. () Density of the Vulnerable Sunda
             N I J M A N , V. & S H E P H E R D , C.R. () Trade in tigers and other wild                           clouded leopard Neofelis diardi in two commercial forest reserves in
                cats in Mong La and Tachilek, Myanmar—a tale of two border                                             Sabah, Malaysian Borneo. Oryx, , –.
                towns. Biological Conservation, , –.                                                          X I AO , W., F E N G , L., M O U , P., M I Q U E L L E , D.G., H E B B L E W H I T E , M.,
             O R I O L -C O T T E R I L L , A., M AC D O N A L D , D.W., V A L E I X , M., E K WA N G A ,              G O L D B E R G , J.F. et al. () Estimating abundance and density of
                S. & F R A N K , L.G. (a) Spatiotemporal patterns of lion space                                    Amur tigers along the Sino–Russian border. Integrative Zoology, ,
                use in a human-dominated landscape. Animal Behaviour, ,                                             –.
                –.                                                                                             Z AW , T., M Y I N T , T., H T U N , S., P O , S.H.T., L AT T , K.T., M A U N G , M. &
             O R I O L -C O T T E R I L L , A., V A L E I X , M., F R A N K , L.G., R I G I N O S , C. &               L Y N A M , A.J. () Status and distribution of smaller cats in
                M AC D O N A L D , D.W. (b) Landscapes of coexistence for                                          Myanmar. Cat News, , –.
                terrestrial carnivores: the ecological consequences of being
                downgraded from ultimate to penultimate predator by humans.
                Oikos, , –.
             R D E V E LO P M E N T C O R E T E A M () R: A Language and Environment                           Biographical sketches
                for Statistical Computing. R Foundation for Statistical Computing,
                Vienna, Austria.                                                                                   H L A N A I N G is field coordinator of WildCRU’s clouded leopard
             R A B I N O W I T Z , A., S C H A L L E R , G.B. & U G A , U. () A survey to assess               programme in Myanmar. J O A N N A R O S S ’s research focuses on the
                the status of Sumatran rhinoceros and other large mammal species                                   conservation of members of the Bornean felid guild, and their spatial
                in Tamanthi Wildlife Sanctuary, Myanmar. Oryx, , –.                                        ecology. D A W N B U R N H A M is a member of WildCRU’s conservation
             R A M E S H , T., S R I D H A R A N , N., S A N K A R , K., Q U R E S H I , Q., S E LVA N , K.        geopolitics research group, with a particular focus on conservation
                M., G O K U L A K K A N N A N , N. et al. () Status of large carnivores and                    ethics. S A W H T U N is WCS’s Deputy Country Director in Myanmar.
                their prey in tropical rainforests of South-western Ghats, India.                                  D A V I D W. M A C D O N A L D has a background in behavioural
                Tropical Ecology, , –.                                                                     ecology, and is running several long-term and wide-ranging con-
             R O Y , M., Q U R E S H I , Q., N A H A , D., S A N K A R , K., G O P A L , R. & J H A L A , Y.       servation programmes with an emphasis on carnivores and
                V. () Demystifying the Sundarban tiger: novel application of                                   interdisciplinarity.

                                                                                                        Oryx, 2019, 53(4), 654–662 © 2017 Fauna & Flora International doi:10.1017/S0030605317001260
Downloaded from https://www.cambridge.org/core. IP address: 46.4.80.155, on 21 Feb 2021 at 15:18:55, subject to the Cambridge Core terms of use, available at https://www.cambridge.org/core/terms.
https://doi.org/10.1017/S0030605317001260
You can also read