POSTERS THE 100m RACE OF COMMUNICATION - A MINI LECTURE - Chalmers

Page created by Loretta Larson
 
CONTINUE READING
POSTERS THE 100m RACE OF COMMUNICATION - A MINI LECTURE - Chalmers
POSTERS THE 100m RACE
OF COMMUNICATION
A MINI LECTURE
POSTERS THE 100m RACE OF COMMUNICATION - A MINI LECTURE - Chalmers
•         Examples of great posters
          – and perhaps not so great ones
•         How to be successful in your designs
•         The five minute rule
•         Chalmers guidelines
•         Research posters – hints and tips
•         Assessment of submitted posters

3/12/18                              Chalmers    2
POSTERS THE 100m RACE OF COMMUNICATION - A MINI LECTURE - Chalmers
So – Who am I then?

•         Mikael Terfors
•         Resident Art Director of Chalmers
•         Degree in Communication and
          Graphic Design from KIAD – England
•         Worked for almost 30 years in
          Advertising and Graphic design

3/12/18                             Chalmers   3
POSTERS THE 100m RACE OF COMMUNICATION - A MINI LECTURE - Chalmers
What makes a great
poster great?
•         It has a well defined purpose
•         It has a well defined target audience
•         It quickly communicates a message
•         It may break some design rules
•         It leaves a lasting impression and
          changes the attitude/makes the
          viewer take action

3/12/18                                Chalmers   4
POSTERS THE 100m RACE OF COMMUNICATION - A MINI LECTURE - Chalmers
A brief history of posters

3/12/18            Chalmers     5
POSTERS THE 100m RACE OF COMMUNICATION - A MINI LECTURE - Chalmers
Let’s start from the beginning
(kind of)
• Lithography (printing technique) was
  invented in 1798
• Start of mass-communication – 1880
• Toulouse-Lautrec (1864–1901) – La
  Belle Epoque

3/12/18                       Chalmers   6
POSTERS THE 100m RACE OF COMMUNICATION - A MINI LECTURE - Chalmers
Is this the most famous
poster of all times?
• Possibly
• Governments and political movements
  quickly saw the use of the poster
• Lord Kitchener WWI-recruitment poster
• 10.000 produced – only three survive
• An estimated 2,67 million volunteered

3/12/18                      Chalmers     7
POSTERS THE 100m RACE OF COMMUNICATION - A MINI LECTURE - Chalmers
The modernist movement
and posters
• Bauhaus
• Rule-breaking
• A desire to break with the past
• Very geometric

3/12/18                        Chalmers   8
POSTERS THE 100m RACE OF COMMUNICATION - A MINI LECTURE - Chalmers
1930s The golden age

•         By this time printing had become
          more efficient
•         The advent of travel(posters)
•         Adolphe Cassandre
•         ”Normandie” 1935

3/12/18                               Chalmers   9
POSTERS THE 100m RACE OF COMMUNICATION - A MINI LECTURE - Chalmers
3/12/18   Chalmers   10
Propaganda

•         1930s was also a golden age for
          political posters
•         Strong imagery
•         Strong and simple messages

3/12/18                               Chalmers   11
Films

•         Film posters has long been at the
          forefront of poster design
•         Creative and innovative

3/12/18                               Chalmers   12
3/12/18   Chalmers   13
Postmodernism

•         Often, all about breaking the rules
•         Deconstructing the message
•         Delivering it in a “jumbled” state
•         Is it effective?

3/12/18                                Chalmers   14
3/12/18   Chalmers   15
Further inspiration

•         Art posters
•         Travel
•         Propaganda
•         Films

3/12/18                 Chalmers   16
Designing for success

3/12/18          Chalmers   17
Message

•         The research poster is a hybrid
          between a written paper and an oral
          presentation
•         A great opportunity to interact
•         Adapt for a mixed audience, not all
          may be familiar with your field

3/12/18                               Chalmers   18
Message cont.

•         Decide what really needs to be on
          your poster
•         Select perhaps three main findings
•         Be tough on yourselves
•         Think about what you want the reader
          to take away from their read
•         Catch your audience with a heading
          or an image
3/12/18                              Chalmers    19
Flow

•         Decide on a layout
•         Don’t overcomplicate
•         Find a logical flow
•         Help your reader to gather
          the information
•         Make something stand out
          even from a distance

3/12/18                                Chalmers   20
3/12/18   Chalmers   21
Colour

• Choose a colour scheme
• Don’t overdo this – 3 colours is
  enough
          • One main (background)
          • One contrasting (signal)
          • One more for charts (information)
•         Certain colour combinations work
          better than others…

3/12/18                                 Chalmers   22
BLACK              YELLOW

3/12/18           Chalmers            23
3/12/18   Chalmers   24
Colour                                   Complementary

•         Three simple ways

                                         Monochromatic

                                         Analogous

3/12/18                       Chalmers                   25
Readability

• Don’t use too much text.
• Keep the font large
  – preferably over 24pt
• Use bullet-points and paragraphs to
  break the text up.

3/12/18                       Chalmers   26
Readability cont.

• Don’t use too wide lines.
  About 60 characters are optimal
• Use Arial or Akzidenz-Grotesk
  (They were made for
  posterworks – and they
  are Chalmers)
• Use Bold, Medium, CAPS, Italics
  to highligt different levels

3/12/18                       Chalmers   27
Readability cont.

•         Use different levels of reading
          • Most important first – create an
            interest (Headline)
          • Main points stand out (Subheads)
          • Give the body-text an introduction
            (Preamble)
          • Nitty-Gritty For the very interested
            (Captions and notes)

3/12/18                                   Chalmers   28
Images

• Use images!
• Good quality
• Preferably – produce your own
• Make sure you are allowed to
  use them!
• Beware of “Google”

3/12/18                      Chalmers   29
Images cont.

•         Save photos as jpg
•         Resolution between 150 and 300dpi
•         Web images are mostly too low and of poor quality

3/12/18                               Chalmers                30
Charts and figures

• Put in a bit of effort here
  – it will pay off!
• Preferably use EPS files (Vector)
• Failing this – use PNG at a high
  resolution
• Be creative!

3/12/18                        Chalmers   31
The poster is the beginning

•         The conclusion is important
•         You want your research to stand out
          and stick to the readers mind
•         You want your readers to take action

3/12/18                               Chalmers   32
Don’t

•         Use “bad” clipart

3/12/18                       Chalmers   33
Don’t

•         Put type over a complicated image
          or background

3/12/18                              Chalmers   34
Don’t

•         Be too “creative” in your choice
          of colours

3/12/18                                Chalmers   35
Don’t

•         Be too “creative” in your choice
          of fonts either (Remember – Arial and
          Akzidenz)

3/12/18                               Chalmers    36
Don’t

•         Forget to spell check!

3/12/18                            Chalmers   37
3/12/18   Chalmers   38
Actually, more like
three five minute rules…
• The viewer takes three seconds to
  decide if your poster is interesting
• Hold the interest for five minutes
• Take no more than five minutes
  to read (and understand)
• Take five minutes and assess
  yourself – or let a collegue do it

3/12/18                         Chalmers   39
3/12/18   Chalmers   40
Chalmers has a strong
brand and a great reputation
•         In Sweden, it’s one of the strongest
          and most trusted
•         Use this to your advantage
•         Together we are stronger

3/12/18                                Chalmers   41
3/12/18   Chalmers   42
3/12/18   Chalmers   43
No Shadows!   No Alterations!   No Distortions!

3/12/18                  Chalmers                       44
Communications and Marketing
            No Additions!                     No Re-colouring!

3/12/18                            Chalmers                      45
Give it space!

3/12/18   Chalmers                46
Hierarchy                                            Partner

• Chalmers always first!
• Partner logo can be on the same line,
  but firmly separated!
• Preferably – put the other
  logos/marks/names at the bottom
  of the poster
                                          Research   Centre
                          Sponsor          group

3/12/18                        Chalmers                       47
Chalmers Typefaces

• Akzidenz-Grotesk Family
• Times 10 Family
•         Arial

3/12/18                     Chalmers   48
Chalmers Guidelines
•         Current can be found and
          downloaded via “Insidan”
•         New guidelines will be
          released during april
          • New Colour palette
          • New Avancez-mark
          • New name-marks for:
            Departments
            Areas of advance
            Centres
3/12/18                              Chalmers   49
3/12/18   Chalmers   50
3/12/18
3/12/18   Chalmers   52
Chalmers Guidelines

•         There are poster-templates
          (for those who whish)
          • InDesign
          • PPT

3/12/18                                Chalmers   53
Interesting research
   poster examples

3/12/18           Chalmers   54
3/12/18   Chalmers   55
3/12/18   Chalmers   56
3/12/18   Chalmers   57
3/12/18   Chalmers   58
Assessment of
   poster submissions

3/12/18          Chalmers   59
Enzyme constraints in yeast and
          their use in metabolic engineering
          Benjamín J. Sáncheza, Cheng Zhangbc and Jens Nielsena
          a
              Department of Biology and Biological Engineering, Chalmers University of Technology
          b
              Science for Life Laboratory, KTH - Royal Institute of Technology
                                                                                                                                                                                                                                                                                                                                                                                                                                            Contact:
          c
              State Key Laboratory of Bioreactor Engineering, East China University of Science and Technology                                                                                                                                                                                                                                                                                                                               bensan@chalmers.se

          BACKGROUND                                                                                                                                                                                                                                          USING THE MODEL TO INTEGRATE PROTEOMIC DATA
          • Inside a biological microorganism, thousands of different reactions (a.k.a. cellular metabolism) are                                                                                                                                              Predictions of constraint-based simulations are typically quite variable, given
            occurring at the same time, catalyzed by hundreds of different enzymes. The main goal in metabolic                                                                                                                                                that the ratio of metabolites/reactions leads to multiple optima. By combining
            engineering is to modify this metabolism for improving production of a specific chemical of interest. A                                                                                                                                           proteomic data in a simulation of yeast growing aerobically on glucose at 0.1 1/h,
            proper mathematical model of metabolism could therefore aid in optimization and design of the system.                                                                                                                                             we reduce variability of flux predictions by ~54% on average.
          • Genome scale modelling (GEM)1 is a successful approach for modelling metabolism. However, it has a                                                                                                                                                                                                                                                                                                                                                  Glycerolipid metabolism                                                   92%

            major limitation: it assumes that the uptake rate of the substrate source (e.g. glucose) is what limits                                                                                                                                                                                                                                        ~10 fold reduction in                                                                                     Steroid biosynthesis
                                                                                                                                                                                                                                                                                                                                                                                                                                                           Pentose phosphate pathway
                                                                                                                                                                                                                                                                                                                                                                                                                                                                                                                                  75.1%
                                                                                                                                                                                                                                                                                                                                                                                                                                                                                                                                  74.9%
                                                                                                                                                                                                                                                                                                                                                       fluxes 100% unconstrained                                                                      Glycerophospholipid metabolism                                          66.6%
            production. This is rarely the case; experimental yields are usually much lower than maximum theoretical                                                                                                                                                                                                                                                                                                                                                 Tyrosine metabolism
                                                                                                                                                                                                                                                                                                                                                                                                                                                          Glycolysis / Gluconeogenesis
                                                                                                                                                                                                                                                                                                                                                                                                                                                                                                                              66.2%
                                                                                                                                                                                                                                                                                                                                                                                                                                                                                                                          55.9%
            yields2. Instead, what often happens is that there is a shortage in the amount of enzymes.                                                                                                                                                                                                                                                                                                                                                        Phenylalanine metabolism
                                                                                                                                                                                                                                                                                                                                                                                                                                                         Inositol phosphate metabolism
                                                                                                                                                                                                                                                                                                                                                                                                                                                                                                                         55%
                                                                                                                                                                                                                                                                                                                                                                                                                                                                                                                         54%
                                                                                                                                                                                                                                                                                                                                                                                                                                                                   Fatty acid degradation                               52.8%
                                                                                                                                                                                                                                                                                                             1                                                                                                                                   Cysteine and methionine metabolism                                    50.3%
          • Integration of enzyme constraints in a metabolic model would therefore give insight into cellular                                                                                                                                                                                                            Only−Metabolic Model                                                                                                                      Galactose metabolism                               48.3%
                                                                                                                                                                                                                                                                                                           0.9           Enzyme−Constrained Model                                                                                                               Sphingolipid metabolism                               48%
            capabilities at conditions of high enzymatic demand, such as yeast growing at a high growth rate,                                                                                                                                                                                                                                                                                                                                                         Lysine biosynthesis
                                                                                                                                                                                                                                                                                                                                                                                                                                Ubiquinone and other terpenoid−quinone biosynthesis
                                                                                                                                                                                                                                                                                                                                                                                                                                                                                                                     46.8%
                                                                                                                                                                                                                                                                                                                                                                                                                                                                                                                     45.9%
                                                                                                                                                                                                                                                                                                           0.8
            consuming non-typical carbon sources and/or overexpressing a specific pathway. However, GEMs so far                                                                                                                                                                                                                                                                                                                  Phenylalanine, tyrosine and tryptophan biosynthesis
                                                                                                                                                                                                                                                                                                                                                                                                                                                                 Glutathione metabolism
                                                                                                                                                                                                                                                                                                                                                                                                                                                                                                                    43.8%
                                                                                                                                                                                                                                                                                                                                                                                                                                                                                                                    43.6%
                                                                                                                                                                                                                                                                                                           0.7

                                                                                                                                                                                                                                                                                 Cumulative distribution
            do not include a direct way of connecting enzyme levels to metabolic fluxes.                                                                                                                                                                                                                                                                                                                                                                                Sulfur metabolism
                                                                                                                                                                                                                                                                                                                                                                                                                                                       Starch and sucrose metabolism
                                                                                                                                                                                                                                                                                                                                                                                                                                                                                                                   43%
                                                                                                                                                                                                                                                                                                                                                                                                                                                                                                                  39.8%
                                                                                                                                                                                                                                                                                                           0.6                                                                                                                                                       Fatty acid elongation                        39.4%
                                                                                                                                                                                                                                                                                                                                                                                                                                            Glyoxylate and dicarboxylate metabolism                              38.8%
                                                                                                                                                                                                                                                                                                           0.5                                                                                                                                            Selenocompound metabolism                             36.7%
                                                                                                                                                                                                                                                                                                                                                                                                                                                   Fructose and mannose metabolism                              36.5%
                                                                                                                                                                                                                                                                                                                                                                                                                                                      Arginine and proline metabolism                          34.9%
                                                                                                                                                                                                                                                                                                           0.4
          DEVELOPED METHOD
                                                                                                                                                                                                                                                                                                                                                                                                                                                                    Thiamine metabolism                        33.9%
                                                                                                                                                                                                                                                                                                                                                                                                                                                                    Pyruvate metabolism                        33.7%
                                                                                                                                                                                                                                                                                                           0.3                                                                                                                                                   Tryptophan metabolism                        32.3%

          Here we expand a Saccharomyces cerevisiae’s (budding yeast) GEM3 to account for enzymatic constraints.                                                                                                                                                                                           0.2
                                                                                                                                                                                                                                                                                                                                                                                                                                                                     Nitrogen metabolism
                                                                                                                                                                                                                                                                                                                                                                                                                                                              Oxidative phosphorylation
                                                                                                                                                                                                                                                                                                                                                                                                                                                                                                              32.3%
                                                                                                                                                                                                                                                                                                                                                                                                                                                                                                              31.7%

          This is done with the constraint-based approach extended to include enzymes as part of reactions, using
                                                                                                                                                                                                                                                                                                                                                                                                                                                              One carbon pool by folate                      31.1%
                                                                                                                                                                                                                                                                                                                                                                                                                                        Alanine, aspartate and glutamate metabolism                          29.9%
                                                                                                                                                                                                                                                                                                           0.1
                                                                                                                                                                                                                                                                                                                                                                                                                                                                   Butanoate metabolism                     27.9%
          mass balances for both metabolites and enzymes4. By using this formalism, reaction fluxes v are limited                                                                                                                                                                                            0           −4        −3      −2     −1       0          1          2                             3
                                                                                                                                                                                                                                                                                                                                                                                                                                       Amino sugar and nucleotide sugar metabolism
                                                                                                                                                                                                                                                                                                                                                                                                                                                  Pantothenate and CoA biosynthesis
                                                                                                                                                                                                                                                                                                                                                                                                                                                                                                           26.4%
                                                                                                                                                                                                                                                                                                                                                                                                                                                                                                           25.5%
          by the maximum flux each enzyme is able to catalyze vmax, which can be estimated from the enzyme’s                                                                                                                                                                                                       10           10     10     10    10   10
                                                                                                                                                                                                                                                                                                                                Flux variability [mmol/gDWh]
                                                                                                                                                                                                                                                                                                                                                                            10                      10                                                         beta−Alanine metabolism
                                                                                                                                                                                                                                                                                                                                                                                                                                                                       Purine metabolism
                                                                                                                                                                                                                                                                                                                                                                                                                                                                                                          24.6%
                                                                                                                                                                                                                                                                                                                                                                                                                                                                                                         21.6%

          abundance inside the cell [E] together with the enzyme’s turnover number kcat5.                                                                                                                                                                                                                                                                                                                                                  Valine, leucine and isoleucine degradation
                                                                                                                                                                                                                                                                                                                                                                                                                                           Pentose and glucuronate interconversions
                                                                                                                                                                                                                                                                                                                                                                                                                                                                                                        21.5%
                                                                                                                                                                                                                                                                                                                                                                                                                                                                                                       17.6%
                                                                                                                                                                                                                                                                                                                                                                                                                                            Glycine, serine and threonine metabolism                  16.8%
                                                                                                                                                                                                                                                                                                                                                                                                                                                                  Pyrimidine metabolism               16.5%

                                                                                                                                                             Enzyme-constrained model:                                                                                                                                    Pathways across most parts of                                                                                                                Lysine degradation
                                                                                                                                                                                                                                                                                                                                                                                                                                                                 Propanoate metabolism
                                                                                                                                                                                                                                                                                                                                                                                                                                                                                                    12.3%
                                                                                                                                                                                                                                                                                                                                                                                                                                                                                                    11.6%

                                              Only-metabolic model:                                                                                      Enzymes act as substrates in reactions                                                                                                                              metabolism are reduced,                                                                                                                 Histidine metabolism
                                                                                                                                                                                                                                                                                                                                                                                                                                                                      Folate biosynthesis
                                                                                                                                                                                                                                                                                                                                                                                                                                                                                                   9.9%
                                                                                                                                                                                                                                                                                                                                                                                                                                                                                                 7.1%
                                        Enzymes do not take part of reactions                                                                                                                                                                                                                                                specially in phospholipid                                                                                                         Citrate cycle (TCA cycle)         6.5%
                                                                                                                                                                                                       A mass balance for E yields...                                                                                                                                                                                                                             Vitamin B6 metabolism         5.3%
                                                                                                                                                                                                                                                                                                                                   metabolism                                                                                                        Terpenoid backbone biosynthesis            5.3%

                                                                                                                                                                                                      v = kcat· e ≤ kcat· [E] = vmax
                                                                                                                                                                                                                                                                                                                                                                                                                                         Synthesis and degradation of ketone bodies            3%
                                                                                                                                        e [mmol/gDW]                                                                                                                                                                                                                                                                                          Nicotinate and nicotinamide metabolism           3%
                                                                                                                                        (constrained by                                 E                                                                                                                                                                                                                                                                         Fatty acid biosynthesis     2.3%
                                                                   E                                                                    proteomic data)                                                                                                                                                                                                                                                                                                                 Biotin metabolism     1.1%

                                              A                                        B                                                                                                                             Databases used for enzyme data:
                                                       v [mmol/gDWh]
                                                                                                                                                                   A                                   B                                                     PREDICTING GROWTH UNDER DIFFERENT MEDIA CONDITIONS
                                                                                                                                                                                     v [mmol/gDWh]
                                                                                                                                                                                                                                                             The expanded model predicts the growth rate at which the available protein runs
                                                                                                                                                                  Stoichiometry: A + 1/kcat E � B                                                            out, which is for several media conditions6,7 the maximum growth rate.
                                                                                                                                                                                                                                                                                                                  Only-Metabolic Model                                                                                       Enzyme-Constrained Model
                                                                                                                                                                                                                                                                                                  6                                                                                                                0.6
                                                                                                                                                                                                                                                                                                                                                                                                                                                                                                               Minimal Media
                                                                                                                                                                                                                                                                                                                                                                                                                                                                                                               Minimal Media + aas
          ENZYME-CONSTRAINED MODEL OF S. CEREVISIAE                                                                                                                                                                                                                                               5                                                                                                                0.5                                                                                         Complex Media (YEP)
                                                                                                                                                                                                                                                                                                                                                                                                                                                                                                               Glucose
          • The expanded model has 6768 reactions, 3406 metabolites (out of which 777 are enzymes) and 14

                                                                                                                                                                                                                                                              [1/h]

                                                                                                                                                                                                                                                                                                                                                                                                  [1/h]
                                                                                                                                                                                                                                                                                                  4                                                                                                                0.4                                                                                         Fructose
                                                                                                                                                                                                                                                                                                                                                                                                                                                                                                               Raffinose
            compartments representing the most common cell organelles.

                                                                                                                                                                                                                                                                          max

                                                                                                                                                                                                                                                                                                                                                                                                             max
                                                                                                                                                                                                                                                                                                                                                                                                                                                                                                               Sucrose
                                                                                                                                                                                                                                                                                                                                                                                                                                                                                                               Maltose

                                                                                                                                                                                                                                                              Predicted µ

                                                                                                                                                                                                                                                                                                                                                                                                 Predicted µ
                                                                                                                                                                                                                                                                                                  3                                                                                                                0.3
          • As seen below, enzymes are present in all existing compartments of the model, with the highest presence                                                                                                                                                                                                                                                                                                                                                                                            Mannose
                                                                                                                                                                                                                                                                                                                                                                                                                                                                                                               Galactose
            in cytoplasm, mitochondrion and endoplasmic reticulum.                                                                                                                                                                                                                                2                                                                                                                0.2                                                                                         Sorbitol
                                                                                                                                                                                                                                                                                                                                                                                                                                                                                                               Trehalose
                                                                                                                                                                                                                                                                                                                                                                                                                                                                                                               Ethanol
                                                                                                                                                                                                                                                                                                  1                                                                                                                0.1
                                                                                                                                                                                                                                                                                                                                                                                                                                                                                                               Acetate
                                                                                                                                                                                                                                                                                                                                                                                                                                                                                                               Glycerol
                                                                                                                                                                                                                                                                                                  0                                                                                                                     0
                                                                                                                                                                                                                                                                                                   0              0.1       0.2    0.3    0.4     0.5                       0.6                                          0          0.1      0.2    0.3    0.4     0.5                          0.6
                                                                                                                                                                                                                                                                                                                          Experimental µmax [1/h]                                                                                          Experimental µmax [1/h]

                                                                                                                                                                                                                                                             PREDICTING PRODUCT YIELD
                                                                                                                                                                                                                                                                                                                 Succinate production in                                                                                 Farnesene production in
                                                                                                                                                                                                                                                                                                                  batch fermentations                                                                                    fedbatch fermentations
                                                                                                                                                                                                                                                                                        1.4
                                                                                                                                                                                                                                                                                                                                        Only−Metabolic Model
                                                                                                                                                                                                                                                                                                                                                                                                              0.3
                                                                                                                                                                                                                                                                                                                                                                                                                                                 Only−Metabolic Model                            The expanded
                                                                                                                                                                                                                                                                                                                                        Enzyme−Constrained Model                                                                                 Enzyme−Constrained Model
                                                                                                                                                                                                                                                                                        1.2                                             Experimental Data
                                                                                                                                                                                                                                                                                                                                                                                                             0.25                                Experimental Data                               model constraints
                                                                                                                                                                                                                                                                                                                                        Glucose Phase
                                                                                                                                                                                                                                                                                                                                        Ethanol Phase                                                                                                                                            yield predictions
                                                                                                                                                                                                                                                                                                     1
                                                                                                                                                                                                                                                                                                                                                                                                              0.2                                                                                without losing

                                                                                                                                                                                                                                                                                                                                                                                     Farnesene Yield [g/g]
                                                                                                                                                                                                                                                               Succinate Yield [g/g]
                                              Enzymes                                                                                                                                                                                                                                   0.8                                                                                                                                                                                                      biological
                                              Cell envelope                                                                                                                                                                                                                                                                                                                                                  0.15
                                              Cytoplasm                                                                                                                                                                                                                                 0.6                                                                                                                                                                                                      meaningful
                                              Extracellular media                                                                                                                                                                                                                                                                                                                                             0.1                                                                                solutions when
                                                                                                                                                                                                                                                                                        0.4
                                              Mitochondrion                                                                                                                                                                                                                                                                                                                                                                                                                                      compared to
                                              Nucleus
                                              Peroxisome
                                                                                                                                                                                                                                                                                        0.2                                                                                                                  0.05
                                                                                                                                                                                                                                                                                                                                                                                                                                                                                                 experimental
                                              Endoplasmic reticulum                                                                                                                                                                                                                                  0                                                                                                             0
                                                                                                                                                                                                                                                                                                                                                                                                                                                                                                 data8,9.
                                                                                                                                                                                                                                                                                                      0                  0.2             0.4         0.6                  0.8                                       0         0.1          0.2      0.3     0.4             0.5         0.6
                                              Golgi                                                                                                                                                                                                                                                                            Biomass Yield [gDW/g]                                                                                      Biomass Yield [gDW/g]
                                              Lipid particle
                                              Vacuole
                                              Endoplasmic reticulum membrane
                                              Vacuolar membrane                                                                                                                                                                                              PREDICTING KNOCKOUT PHYSIOLOGY                                                                                                                                                                      OUTLOOK
                                              Golgi membrane                                                                                                                                                                                                 The expanded model correctly predicts the                                                                                                                                                              • By using enzyme
                                              Mitochondrial membrane                                                                                                                                                                                         shift in the critical growth rate when NDI1 is                                                                                                                                                           constraints in a GEM of
                                                                                                                                                                                                                                                             knocked-out10.                                                                                                                                                                                           S. cerevisiae we gain
                                                                                                                                                                                                                                                                                       25
                                                                                                                                                                                                                                                                                                                               O 2 Consumption (WT strain)                                                                                                            insight into the enzyme
              Physico-chemical properties of enzymes in model:                                                                                                                                                                                                                                                                 CO 2 Production (WT strain)                                                                                                            cost of metabolic
                                          1                                                                             1
                                                                                                                                                                                                                                                                                       20                                      O 2 Consumption (ndi1∆)                                              The model is                                                      pathways under different
                                                                                                                                                                                                                                                                                                                               CO 2 Production (ndi1∆)
                                                                                                                                                                                                                                                                                                                                                                                                    reliable for
                                        0.8                                                                           0.8                                                                                                                                                                                                                                                                                                                                             conditions.

                                                                                                                                                                                                                                                              Flux [mmol/gDWh]
                                                                                                                                                                                        Classification of enzymes:                                                                     15                                                                                                           predicting the
                                                                                            Cumulative distribution
              Cumulative distribution

                                                                                                                                                                                                                                                                                                                                                                                                    effect of
                                        0.6                                                                           0.6                                                               • 183 enzymes from carbohydrate and energy                                                                                                                                                                                                                                  • This way we can unveil
                                                                                                                                                                                                                                                                                                                                                                                                    genetic
                                                                                                                                                                                          primary metabolism (lightest and fastest group)                                              10                                                                                                                                                                             the most likely key steps
                                                                                                                                                                                                                                                                                                                                                                                                    modifications
                                        0.4                                                                           0.4
                                                                                                                                                                                        • 222 enzymes from aminoacid, fatty acid and                                                                                                                                                                in the system                                                     that limit yeast growth
                                                                                                                                                                                          nucleotide primary metabolism (intermidiate group)                                                     5
                                                                                                                                                                                                                                                                                                                                                                                                                                                                      and/or metabolite
                                        0.2                                                                           0.2
                                                                                                                                                                                        • 329 enzymes from intermediate and secondary                                                                                                                                                                                                                                 production, for improving
                                                                                                                                                                                          metabolism (heaviest and slowest group)
                                          0
                                              0   20   40    60     80    100   120   140
                                                                                                                       0
                                                                                                                       10
                                                                                                                          −1
                                                                                                                               10
                                                                                                                                    0
                                                                                                                                          10
                                                                                                                                             1
                                                                                                                                                         10
                                                                                                                                                              2
                                                                                                                                                                   10
                                                                                                                                                                        3
                                                                                                                                                                            10
                                                                                                                                                                                 4
                                                                                                                                                                                                                                                                                                 0
                                                                                                                                                                                                                                                                                                 0.1              0.15          0.2     0.25      0.3          0.35         0.4                                                                                       strain design.
                                                       Molecular weight [kDa]                                                               k         [1/s]                                                                                                                                                                      Dilution Rate [1/h]
                                                                                                                                                cat

                                                                                                                                                                                                                      References
                                                                                                                                                                                                                      1. B.J. Sánchez & J. Nielsen, Integr. Biol. 2015, 7:846-858                                                                6. J.P. van Dijken et al., Enz. Microbiol. 2000, 26:706-14
                                                                                                                                                                                                                      2. D.K. Ro et al., Nature 2006, 440:940-943                                                                                7. C.B. Tyson et al., Journal of Bacteriol. 1979, 138:92-98
                                                                                                                                                                                                                      3. H.W. Aung et al., Ind. Biotechnol. 2013, 9:215-228                                                                      8. A.M. Raab et al., Metabolic Eng. 2010, 12:518-525
                                                                                                                                                                                                                      4. E. O’Brien et al., Mol. Syst. Bio. 2013, 9:693                                                                          9. S. Tippmann et al., Biotech. & Bioeng. 2016, 113:72-81
                                                                                                                                                                                                                      5. A. Nilsson & J. Nielsen, Sci. Rep. 2016, 6:22264                                                                       10. B.M. Bakker et al., Journal of Bacteriol. 2000, 182:4730-4737
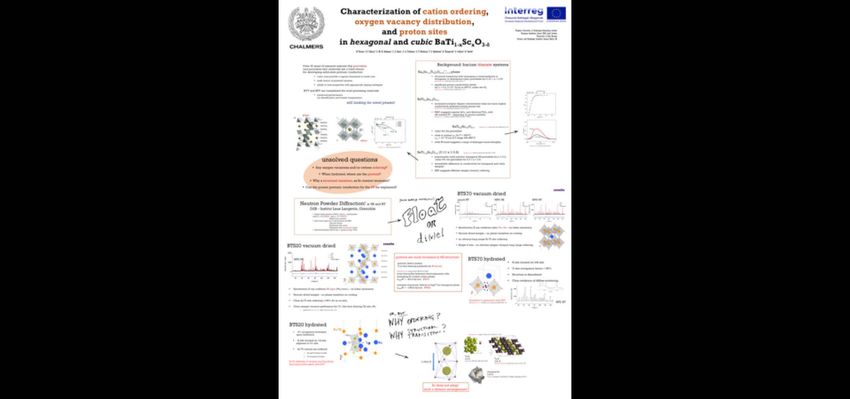
3/12/18                                                                                                                                                                                                                   Chalmers                                                                                                                                                                                                                                                                                                              60
Protein containing lipid bilayers intercalated
                             with size-matched mesoporous silica thin films
                           Simon Isaksson*, Erik B. Watkins, Kathryn L. Browning, Tania Kjellerup Lind,
                              Marité Cárdenas, Kristina Hedfalk, Fredrik Höök, Martin Andersson*
                                              *Division of Applied Chemistry, Chalmers University of Technology

                                                                                                                     We tailored the pore size and pore
                                                                                                                     ordering of a mesoporous silica thin
                                                                                                                     film to match the native cell-membrane
                                                                                                                     arrangement of the transmembrane
                                                                                                                     protein human aquaporin 4. Using
                                                                                                                     neutron reflectivity, we provide
                                                                                                                     evidence of how substrate pores host
                                                                                                                     the bulky water-soluble domain of the
                                                                                                                     protein, which is shown to extend
                                                                                                                     7.2 nm into the pores of the silica
                                                                                                                     substrate (Figures 1 & 2). Figures 3
                                                                                                                     and 4 present interesting properties
                                                                                                                     of the two intercalated components.

                                                                                                                           Protein-silica intercalation

                                          Figure 1: Illustration showing the achievement of
                                          this work: Straightforward protein-silica intercalation.

                   Proteoliposomes                                         Mesoporous silica

                                                                                                                           Figure 2: (A) Component volume fractions for
                                                                                                                           the SLB on a nonporous Si substrate as
                                                                                                                           determined by neutron reflectivity. The illustration
                                                                                                                           visualizes the data for the POPC (brown) bilayer
                                                                   Figure 4: (A) TEM micrograph showing                    on nonporous silica (grey) with a protein (blue)
          Figure 3: (A) Cryo-TEM micrograph of                     hexagonal ordering of the porous network in             containing proteoliposome co-adsorbed on top of
          a    liposome sample. (B)                   Cryo-TEM     the mesoporous silica substrate. The pores are          the bilayer. (B) Volume fractions for the protein
          micrograph of a proteoliposome sample.                   uniform with a diameter of 6 nm. (B)                    containing supported lipid bilayer on a
          (C) Bilayer thickness distribution of 30 liposomes as    SAXS data providing evidence of long range
          determined       from       liposome          samples,
                                                                                                                           mesoporous substrate. The protein
                                                                   hexagonal pore ordering in the                          protruded 7.2 ± 1.0 nm into the porous
          showing one population centered at                       mesoporous silica substrate. (C) Top view               substrate and 10.0 ± 1.0 nm into the bulk when
          5nm. (D) Bilayer thickness distribution of 30            of the mesoporous silica surface captured               facing the substrate and away from the substrate,
          proteoliposomes        as       determined       from    by SEM. Pores with pore diameters of about              respectively. The illustration visualizes the NR data
          proteoliposome samples, showing two                      6 nm are accessible from the surface.                   for the POPC (brown) bilayer containing protein
          populations centered at 5 and 7nm, respectively.         (D) SEM cross section of mesoporous silica thin film    (blue) intercalated with mesoporous silica (grey).
                                                                   (highlighted in blue) deposited on a glass slide. The
                                                                   mesoporous thin film is about 300 nm thick.
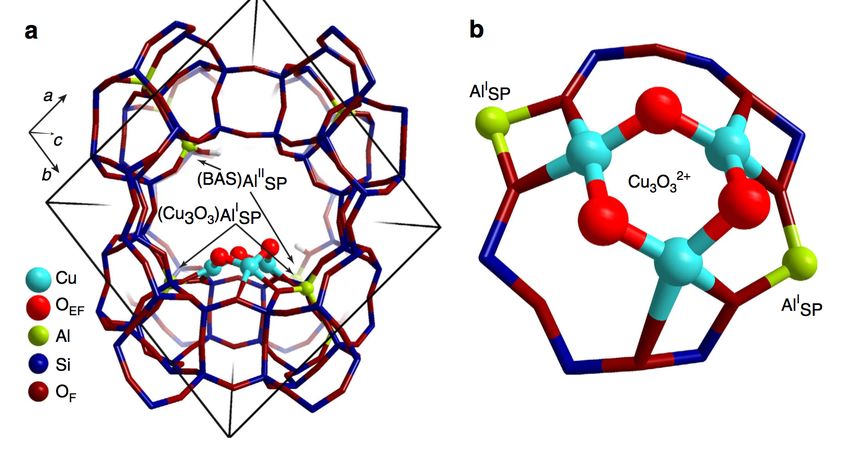
3/12/18                                                                           Chalmers                                                                                         61
Characterization of Cu-Exchanged Zeolites for Direct
                                            Conversion of Methane to Methanol (DCMM)
                                                    Xueting Wang, Magnus Skoglundh, Anders Hellman and Per-Anders Carlsson,
                                                Competence Centre for Catalysis, Chalmers University of Technology, Göteborg, Sweden

          ADVANTAGES                                                                                                                                                                                         CHALLENGES
                                              RESEMBLANCE TO MMO*                                                                                          ACTIVATION
                                              Porous structure of ZSM-5                                                            Copper                  Catalyst needs to be activated under higher
                                              Various Cu species                                                                     29                    temperature with oxidants before catalytic reaction.

                                                                                                                                   Cu
                                              *MMO (methane monooxgenase), an enzyme
                                              that is capable of oxidizing methane to
          Sirajuddin S. et al., J. Bio.
          Chem. (2014)
                                              methanol at ambient temperature and pressure.                                                                                      ACTIVE SITES
                                                                                                                                                                                 Under discussion.
                                                                                                                                                                                 Minority Cu species are
                INORGANIC STRUCTRUE                                                                                                                                              responsible for DCMM.                  S. Grundner et al., Nature
                Advantage in manufacture, design, reaction                                                                                               J.S. Woertink et al.,                                          Commun., (2015)
                                                                                                                                                         PNAS, 106 (2009)
                condition and modelling.

                                              DCMM
                                                                                          Cu-exchanged zeolites                                            EXTRACTION
                                                                                                                                                           Methanol needs to be extracted by water/ethanol.
                                              CO + H2

          CHARACTERIZATION FOR COPPER SPECIES
                UV-vis spectroscopy                                                           Methanol-TPD (temperature programmed desorption)
                 Adsorption band at 22700 cm-1 relating to                                    Cu species is related to:                                       Methanol-TPD contains info about Cu species:
                 proposed active sites.*                                                        • Ion-exchange level                                           • Number of sites
                 Missing band in the Cu-ZSM-5 samples.                                          • Pre-treatment condition                                      • Type of sites
                                     10                                                                            Pre-oxidized Methanol-TPD                                        Pre-reduced Methanol-TPD
                                                       SAR 27
                                     8                                                                   Pre-treatment Adsorption Desorption                               Pre-treatment      Adsorption Desorption

                     Kubelka Munk
                                     6                  SAR 55                                                     O2 10%           MeOH 0.08%                           O2 10% H2 1.5%                    MeOH 0.08%
                                                                     22700 cm-1
                                     4
                                     2                     SAR 330
                                     0
                                      5000   10000 15000 20000 25000              30000
                                                                                                                                                                                                                        Temperature
                                                  Wavenumber (cm-1)
                                                                                                                                                                         Time
                Sample: Cu-ZSM-5 with various SAR (silica alumina ratio)
                Ion-exchange time: 24 h
                                                                                                                     Methanol-TPD for Cu-ZSM-5                                   Methanol-TPD for Cu-ZSM-5 (24h)
                *Bezins et al., Catalysis Letters, 138 (2010), 14-22                                                        different ion-exchange time                                             different pre-treatment
                                                                                                                   500                    1.5h                                                400

                                                                                                                   400                        6h                                                                    1. Pre-oxidized
                Infrared spectroscopy

                                                                                                  Methanol (ppm)
                                                                                                                                                                                              300

                                                                                                                                                                                 MeOH (ppm)
                                                                                                                                                                                                                     2. Pre-reduced
                                                                                                                   300                             12h
                Accessible Cu+ and Cu2+ species.                                                                                                                                              200                    3. Pre-oxidized
                                                                                                                   200
                                                                                                                                         0h                                                                                   Number indicates
                                                                                                                                                     24h                                      100                             the experiment
               Intensity (arb. u.)

                                                                                                                   100                                                                                                        order
                                                  NO+ on Cu2+
                                                                                                                     0                                                                          0
                                                          NO- on Cu+                                                     75           175         275                                               75        175         275
                                                                                                                                    Temperature (°C)                                                        Temperature (°C)

                        2000      1900           1800                          1700
                                   Wavenumber (cm-1)                                                                                                                                    ACKNOWLEDGEMENT
                  Sample: Cu-ZSM-5 SAR 27                                                     This work has been carried out within the project “Time-resolved in situ methods for design of catalytic sites within
                  Ion-exchange time: 24 h                                                     sustainable chemistry ”, Swedish Research Council (349-2013-567) and partly within Competence Centre for
                  Pretreatment: with O2 @ 550 °C for 1 h                                      Catalysis, which is hosted by Chalmers University of Technology and financially supported by the Swedish Energy
                  Measurement: during NO exposure                                             Agency and the member companies AB Volvo, ECAPS AB, Haldor Topsøe A/S, Scania CV AB, Volvo Car Corporation
                                                                                              AB, and Wärtsilä Finland Oy.

                                                                         Competence Centre for Catalysis

3/12/18                                                                                                            Chalmers                                                                                                                          62
3/12/18   Chalmers   63
Towards recycling of textile fibers
                                                                              -solid state analysis of textile fibers and blends
                                                                                          Anna Petersonab, Hanna de la Mottea, Alexander Idströmc, Anna Palmed
                                                                                                            Harald Brelide, Lars Nordstiernab
                                                                                                                             a
                                                                                                                              SP Technical Research Institute of Sweden
                                                                                                                b
                                                                                                                 Division of Applied Chemistry, Chalmers University of Technology
                                                                                                                                            c
                                                                                                                                              Swerea IVF
                                                                                                            d
                                                                                                                Division of Chemical Engineering, Chalmers University of Technology
                                                                                                                                         e
                                                                                                                                          Södra Innovation

          The global demand for textile materials is steadily increasing due to world population growth and the overall improvement of living standards. At the same time the
          life cycle of textiles is shortened, generating more textile waste1. Recycling of textile fibers is a challenging subject but the environmental benefits from a working re-
          cycling chain are substantial since textiles is one of the types of wastes associated with the
          heaviest climate effects since it demands large amounts of water, pesticides and energy in the production2. An efficient recycling chain needs to meet the needs of
          collecting, sorting and regenerating new fibers of high quality. In order to introduce an efficient recycling of fibers, characterization of the fiber content as well as
          separation of fibers from material blends are crucial. It is thus of high interest to find ways to analyze the content of material blends as well as methods to physically
          separate the fibers.

                              PATHWAYS FOR TEXTILE WASTE                                                                                                                   AUTOMATIC SORTING OF TEXTILES
                                                                                                                                                      An analytic method for the sorting of textile materials has to meet certain
                                                                                                                                                      characteristics:
                                                                                                                                                      • Ability to qualitatively distinguish between the fibers
                     Post-consumer                                                              Post-industrial
                                                                                                                                                      • Ability to quantify fiber content in fiber blends
                                                                Fibrous                                                                               • High throughput
                                                                 waste
                                                                                                                                                       Vibrational spectroscopy methods: Infrared and Raman

                                                             Collection                                                                                 Band frequency (cm-1)                        Type of vibration             Fiber type
                                                                and                                                                                     3 7 0 0 -3 2 0 0                             O-H stretch (free and bonded) Cellulosics
                                                              sorting                                                                                   2 9 3 0 -2 8 4 0                             C-H stretch                                          Most fibrous polymers
                                                                                                                                                        2 2 6 0 -2 2 4 0                             C N stretch (saturated nitrile)                      Acrylics
                                                                                                                                                        1 7 4 0 -1 7 1 5                             C=O stretch (esters)                                 Polyesters, acrylics
                                                                                                                                                        1 6 7 0 -1 6 3 0                             C=O stretch (amide)                                  Polyamide, wool
                             Reuse                              Recycle                               Dispose                                           1 6 5 0 -1 5 1 5                             N-H deform (amines, primary                          Wool, polyamide
                                                                                                                                                                                                     and secondary)
                                                                                                                                                       Table 1. IR band frequencies for vibrations typical for textile fibers

                                                                                                                                                      Only one of the common textile fibers analyzed in the trial showed infrared
                        Mechanical                            Chemical                                   Energy                                       absorbance at a distinct wavelength. Hence detection cannot be limited to
                         recycling                            recycling                                 recovery                                      specific peaks for specific samples but has to be done by matching the full
                                                                                                                                                      spectrum of the textile samples against a spectral library.

                                                                                                                                                      Raman spectroscopy was performed with incident light of 732 and 532 nm.
                                                                                                                                                      Both wavelengths produced significant flourescence which interferes severly
                                                                                                                                                      with the spectra generated by Raman scattering. At the chosen wavelengths
                               SEPARATION OF FIBER BLENDS                                                                                             Raman is insufficient as an automatic sorting method.

           Alkaline hydrolysis of polyester from a cotton/polyester blended fabric. The                                                                Solid state nuclear magnetic resonance
           reaction is aided by a phase transfer catalyst to obtain mild reaction condi-
           tions.

           Reaction products are pure terephtalic acid, ethylene glycol and a cotton
           residue whose physical properties such as crystalline structure and degree                                                                                                                                                                    • Not suitable as an
           of polymerization are dependant on reaction conditions. The parameters of                                                                                                                                                                     on-line technique
           highest influence were found to be alkali concentration and temperature.
                                                                                                                                                                                                                                                         • Can provide
                                                                                                                                                                                                                                                         detailed structural in-
                                                                                                                                                                                                                                                         formation on
                                                                                                                                                                                                                                                         fibrous samples.

                                                                                                                                                      Figure 2. Solid-state NMR spectrum of blended textile shreds from SOEX, with assignments.

                                                                                                                                                       Future work
                                                                                                                                                      Further analyses on the cotton residue, such as SEM and molecular weight
                                                                                                                                                      distribution. Trials with upscaling of the separation of the cotton/polyester
                                                                                                                                                      blend. Investigate Near-infrared spectroscopy as a possible automatic sorting
                                                                                                                                                      method.

                    Figure 1. ATR-IR spectra of cotton residue accentuating the transformation between cellulose I and cellulose II. Purple
                                                                                                                                                       References
                                                                                                                                                     1. Lu, J. J. & Hamouda, H. Current Status of Fiber Waste Recycling and its Future. Adv. Mater. Res. 878, 122–131 (2014).
                    traces, cotton residue showing absorbance at frequencies charceristic for cellulose II. Blue trace, cotton residue lack-         2. Naturvårdsverket. Avfallsstatistik för bättre miljöarbete (2012).
                    ing absorbance at frequencies characterstic for cellulose II.

3/12/18                                                                                                                                  Chalmers                                                                                                                                  64
Useful links and software
•         Adobe CC suite
          • InDesign
          • Photoshop
          • Illustrator
•         Corel Draw
•         Microsoft Powerpoint
•         Microsoft Paint (freeware)
•         “Free” and Royaltyfree images and graphics
          www.pixelbay.org www.shutterstock.com
          www.123rf.com www.wikipedia.com
3/12/18                              Chalmers          65
You can also read