POWERING PROGRESS: STATES RENEWABLE ENERGY RACE - CLIMATECOUNCIL.ORG.AU
←
→
Page content transcription
If your browser does not render page correctly, please read the page content below

POWERING PROGRESS:
STATES RENEWABLE
ENERGY RACE

CLIMATECOUNCIL.ORG.AU
Thank you for
supporting the
Climate Council.
The Climate Council is an independent, crowd-funded organisation
providing quality information on climate change to the Australian public.

    Published by the Climate Council of Australia Limited
    ISBN:    978-1-925573-79-4 (print)
             978-1-925573-78-7 (digital)
    © Climate Council of Australia Ltd 2018
    This work is copyright the Climate Council of Australia Ltd. All material
    contained in this work is copyright the Climate Council of Australia Ltd
    except where a third party source is indicated.
    Climate Council of Australia Ltd copyright material is licensed under the
    Creative Commons Attribution 3.0 Australia License. To view a copy of this
    license visit http://creativecommons.org.au.
    You are free to copy, communicate and adapt the Climate Council of
    Australia Ltd copyright material so long as you attribute the Climate Council
    of Australia Ltd and the authors in the following manner:
    Powering Progress: States Renewable Energy Race.
    Authors: Louis Brailsford, Andrew Stock, Greg Bourne and Petra Stock.

    —
    Cover image: 'Mt Gellibrand wind farm', Climate Council.
    This report is printed on 100% recycled paper.

         facebook.com/climatecouncil                 info@climatecouncil.org.au

         twitter.com/climatecouncil                  climatecouncil.org.au
CLIMATE COUNCIL         i

Preface
The renewable energy boom is accelerating in Australia, and
across the world. State and territory governments are leading
Australia’s electricity transition from fossil fuels to renewable
energy and storage.

Every year the Climate Council tracks the relative progress of
Australian states and territories based on their performance across
a range of renewable energy metrics: percentage of renewable
electricity; proportion of households with solar; large-scale wind
and solar capacity per capita; and targets or policies in place for
renewable energy. We also outline progress for each state and territory
government over the last twelve months in terms of renewable energy
growth and policy, as well as their position on fossil fuels. This report
is the Climate Council’s fourth scorecard evaluating state and territory
progress on renewable energy. This report follows on from previous
state and territory renewable energy updates in 2014, 2016 and 2017.

We would like to thank Tim Buckley and Renate Egan for kindly
reviewing the report. We also appreciate the assistance of Huw Jones
in its preparation. We would also like to thank the relevant state and
territory departments for reviewing and providing feedback on each
state or territory profile.

Authors

Louis Brailsford           Professor Andrew Stock          Greg Bourne          Petra Stock
Researcher                 Climate Councillor              Climate Councillor   Senior Energy and
                                                                                Climate Solutions Analyst
ii    POWERING PROGRESS:
      STATES RENEWABLE ENERGY RACE

     Key Findings
     1            2
     Tasmania, ACT and SA are equal winners of               States and territories continue to lead the way
     this year’s renewables race. WA and the NT              on renewable energy in the ongoing absence
     are lagging at the back of the pack.                    of credible national climate policy.

     ›› The Climate Council’s 2018 renewable energy          ›› Australia is already experiencing the devastating
        scorecard finds Tasmania, the Australian Capital        impacts of climate change, such as worsening
        Territory (ACT) and South Australia are leading         extreme weather events. To effectively tackle
        the other states and territories across a range of      climate change we must accelerate the transition
        renewable energy measures – based on each               to renewables and storage technologies.
        state’s proportion of renewable energy, wind
        and solar capacity per capita, proportion of         ›› With the exception of Western Australia, all states
        households with solar, and renewable energy             and territories have committed to renewable
        targets and policies.                                   energy targets and/or net zero emissions targets.

     ›› Western Australia, the Northern Territory and        ›› Tasmania, the ACT and South Australia have the
        New South Wales are lagging behind the other            highest proportion of renewable electricity.
        states and territories. Western Australia’s share
        of renewable energy is low, however the state        ›› South Australia continues to have the largest
        has the third highest proportion of households          amount of installed wind and solar capacity
        with rooftop solar. The Northern Territory has          (1,831MW), closely followed by New South Wales
        a low share of renewable electricity and solar          (1,759MW) and Victoria (1,634MW). On a per capita
        households, but is set to implement its plan            basis, South Australia, the ACT and Tasmania are
        to reach 50% renewable energy by 2030. New              the leaders.
        South Wales does not have a renewable energy
        target and has no plan to replace its ageing and     ›› Queensland and South Australia have the highest
        unreliable coal power stations.                         proportion of households with rooftop solar, at
                                                                32.9% and 32.3% respectively. Western Australia
                                                                is in third place with 26.7% of households with
                                                                rooftop solar.
KEY FINDINGS   iii

3
Queensland has more renewable energy
                                                     4
                                                     More solar PV capacity was added around
projects under construction than any                 the world than coal, natural gas and nuclear
other state.                                         combined.

›› Almost 10,000 jobs are being created in the       ›› Almost three-quarters of new energy generation
   renewable energy industry across Australia with      capacity added globally was renewable in 2017.
   69 wind and solar plants under construction.
                                                     ›› Electricity generation from coal and gas fell for
›› Queensland, Victoria and New South Wales are         the fifth consecutive year.
   home to the vast majority of these projects.
                                                     ›› Approximately 17 countries generated more than
›› Queensland and Victoria have ambitious               90% of their electricity with renewable energy in
   renewable energy targets and policies to             2017. Australia was not one of them.
   increase the amount of renewable energy.

›› South Australia has at least eight new projects
   under construction and is on track for 73%
   renewable electricity in just two years.

                                                                                  climatecouncil.org.au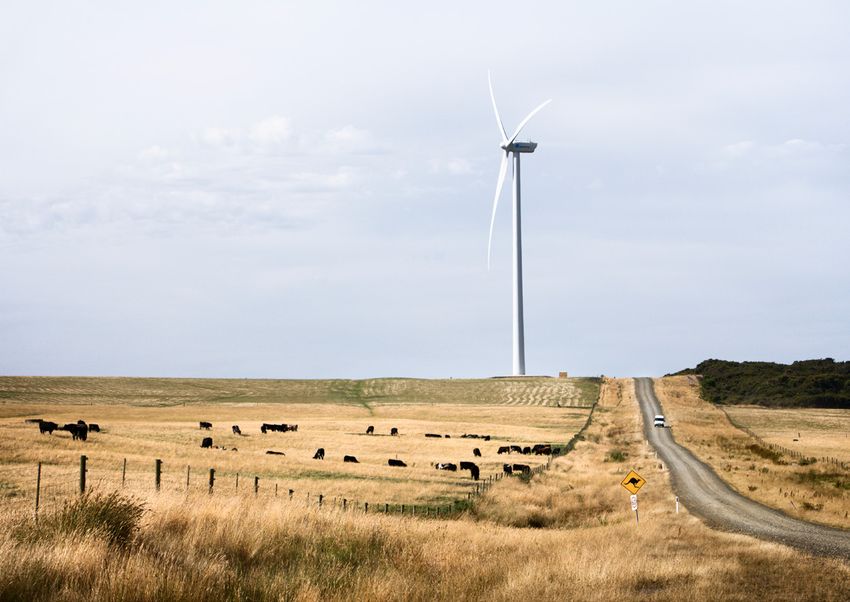
THE AUSTRALIAN
      RENEWABLE ENERGY RACE:
        2018 SCORE CARD
                                                                             TAS
                                                                                                           FRONT
                                                                             ACT                          RUNNERS

                                                                              SA
                                            VIC                      CATCHING
                                                                        UP
                                            Q LD
                  NSW
                            AT THE
      NT                STARTING BLOCKS

      WA
                                                                        Net zero
        % Renewable     Capacity per   % solar      Renewable           emissions
        energy (2017)   cap (kw/cap)   households   energy targets      targets     Highlights

        87.4            0.7            14           100% by 2022        Net zero    Highest proportion of renewable
TAS                                                                     by 2050     electricity. Achieved net zero
                                                                                    emissions.

        46.2            1.1            14           100% by 2020        Net zero    On track to meet renewable energy
ACT                                                                     by 2050     target.

        43.4            1.1            32           -                   Net zero    On track for 73% renewables by 2020.
SA                                                                      by 2050

        13.6            0.3            16           25% by 2020         Net zero    Completed Australia’s largest
VIC                                                 40% by 2025         by 2050     renewable energy reverse auction.

        7.1             0.1            33           50% by 2030         Net zero    Highest proportion of solar
                                                                        by 2050     households.
QLD                                                                                 Largest number of projects under
                                                                                    construction.

        12.6            0.2            18           -                   Net zero    Strong pipeline of renewable energy
NSW                                                                     by 2050     projects with planning approval.

        3.0             0.1            14           50% by 2030         -           50% renewable energy target by
NT                                                                                  2030.

        7.5             0.2            27           -                   -           Only state with no renewable
WA                                                                                  energy target or net zero
                                                                                    emissions target.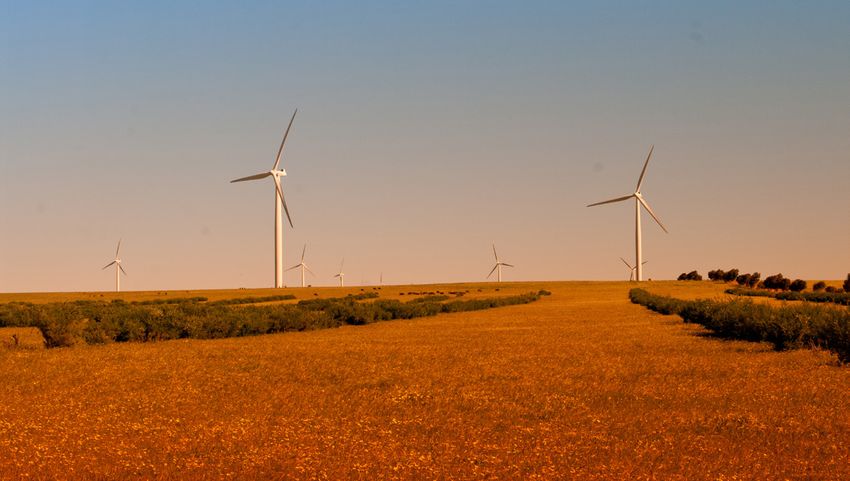
CLIMATE COUNCIL                       v

Contents
Preface................................................................................................................................................................................................. i

Key Findings..................................................................................................................................................................................... ii

1.     Introduction...............................................................................................................................................................................1

2.     States and Territories stepping in to tackle climate change....................................................................................... 5

3.     State and Territory Renewable Energy Scorecard 2018................................................................................................7
       3.1         Percentage renewable electricity                                                                                                                                                    8
       3.2         Wind and solar capacity per person                                                                                                                                                10
       3.3         Proportion of households with solar                                                                                                                                                12
       3.4         Renewable energy targets and policies                                                                                                                                              16
       3.5         Powering forward: the renewable energy construction boom                                                                                                                           17

4.     State and Territory by Renewable Energy Progress.................................................................................................... 19
       4.1         Front Runners                                                                                                                                                                     20
                   Australian Capital Territory                                                                                                                                                      20
                   Tasmania                                                                                                                                                                          22
                   South Australia                                                                                                                                                                   24
       4.2         Catching up                                                                                                                                                                       28
                   Victoria                                                                                                                                                                          28
                   Queensland                                                                                                                                                                         31
       4.3         At the starting blocks                                                                                                                                                            33
                   New South Wales                                                                                                                                                                   33
                   Northern Territory                                                                                                                                                                35
                   Western Australia                                                                                                                                                                 37

5.     Vacating the Field: The NEG and Federal Government inaction............................................................................ 39

References........................................................................................................................................................................................41

Image Credits.................................................................................................................................................................................44
1   POWERING PROGRESS:
    STATES RENEWABLE ENERGY RACE

    1.          Introduction
                Every year the Climate Council tracks     Over the past year, with the ongoing
                the relative progress of Australian       absence of credible climate and energy
                states and territories based on their     policy at the federal level, states and
                performance across a range of             territories have continued leading the
                renewable energy metrics: percentage      charge on renewable energy. Along with
                of renewable electricity; proportion      the national Renewable Energy Target,
                of households with solar; large-scale     state and territory policy support is driving
                wind and solar capacity per capita;       the continued uptake of renewable energy
                and targets or policies in place for      across the country.
                renewable energy. This report is the
                Climate Council’s fourth scorecard        Discussion surrounding the Federal
                evaluating state and territory progress   Government’s now abandoned National
                on renewable energy.                      Energy Guarantee (NEG) appeared to slow
                                                          the pace of proactive state and territory
                                                          policy announcements and implementation
                                                          throughout 2018. Shortly after the Federal
                                                          Government abandoned its proposed NEG
                                                          (The Guardian 2018), states and territories
                                                          again stepped in to partly fill the policy
                                                          vacuum with the Victorian Government
                                                          announcing the outcome of its renewable
                                                          energy auction and new support for
                                                          household solar and storage (Victorian
                                                          Government 2018b) and the South

    Strong state and                                      Australian Government outlining the details
                                                          of its home battery scheme (Government of

    territory government
                                                          South Australia 2018a).

                                                          Looking ahead, state and territory
    policies are vital                                    leadership will continue to be critical for
                                                          investment in new large-scale wind, solar
    if Australia is to                                    and storage projects in Australia in the
                                                          absence of any credible national climate
    increase the uptake of                                and energy policy to succeed the Renewable
                                                          Energy Target from 2020.

    renewable energy and
    reduce greenhouse
    gas pollution.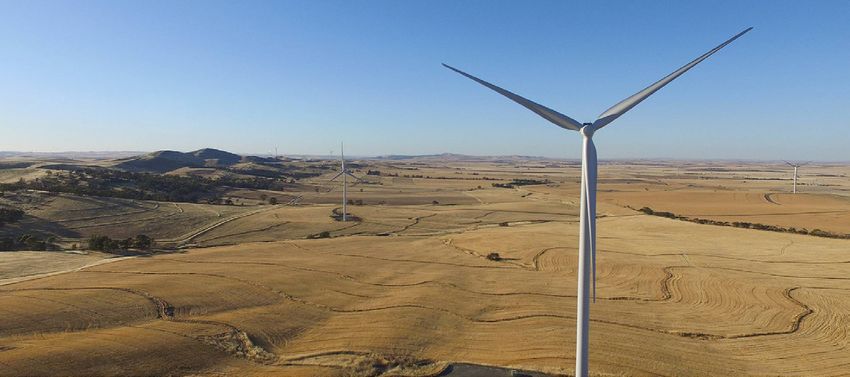
CHAPTER 01   2
                                                                                                      INTRODUCTION

If other countries adopted similar climate
policies to Australia, then global average
temperature rise could reach over 3°C.

Reflecting the ongoing absence of any            by 2030, the electricity sector should reduce
credible national climate policy, Australia’s    its greenhouse gas pollution levels by 60% by
greenhouse gas pollution increased for           2030 (ClimateWorks 2017).
the third consecutive year in 2017, despite
a fall in emissions in the electricity sector    If all other countries were to have similar
(Australian Government 2018). Greenhouse         climate policies to Australia, then global
gas pollution from the electricity sector fell   average temperature could reach over 3°C
largely due to reduced electricity demand        and up to 4°C above pre-industrial levels
and reduced generation from brown coal           (Climate Action Tracker 2018). A four-degree
following the closure of the polluting,          world would make it very difficult for human
end-of-life Hazelwood Power Station in           civilisation to cope, putting billions of lives in
March 2017. Nationally, the proportion of        danger (New et al. 2011).
renewable electricity generation declined by
a percentage point (from 16% in 2016 to 15%      Increasing global temperatures - driven
in 2017) (Department of the Environment          primarily by higher carbon dioxide levels
and Energy 2018a). This was in large part        from the burning of fossil fuels like coal
due to a 23% drop in hydro generation due to     and gas - are exacerbating extreme weather
reduced rainfall (Clean Energy Council 2018;     events around the globe and in Australia. The
Department of the Environment and Energy         world has just experienced the hottest five-
2018a). In contrast, combined solar and wind     year period (2013-2017) ever recorded. This
generation increased by 5% (Department of        record is part of a sharp, long-term upswing
the Environment and Energy 2018a).               in global temperatures, with 17 of the 18
                                                 hottest years on record all occurring in this
Australia is not on track to achieve even        century (NOAA 2018).
its weak 2030 emissions reduction target
of 26-28% by 2030 below 2005 levels, as          In Australia, climate change is influencing
greenhouse gas pollution is going up. Even       many extreme weather events: hotter, longer
this target falls significantly short of what    and more frequent heat waves; more intense
is required for Australia to do its fair share   and damaging storms; increased bushfire
to tackle climate change. The Climate            risk; and rising ocean temperatures which
Change Authority recommended a 45-65%            are triggering coral bleaching events on the
emissions reduction target for 2030 below        Great Barrier Reef (Climate Council 2017).
2005 levels, based on scientific evidence,
what comparable countries are doing and          Australia’s electricity sector is the nation’s
what is in the best interests of Australia       largest polluter accounting for a third of
(Climate Change Authority 2015). In order        our emissions, but is also the sector with
to achieve the Climate Change Authority’s        the lowest cost and technically feasible
recommended economy-wide emissions               opportunities to reduce emissions while
reduction target of 45-65% below 2005 levels     maintaining reliability.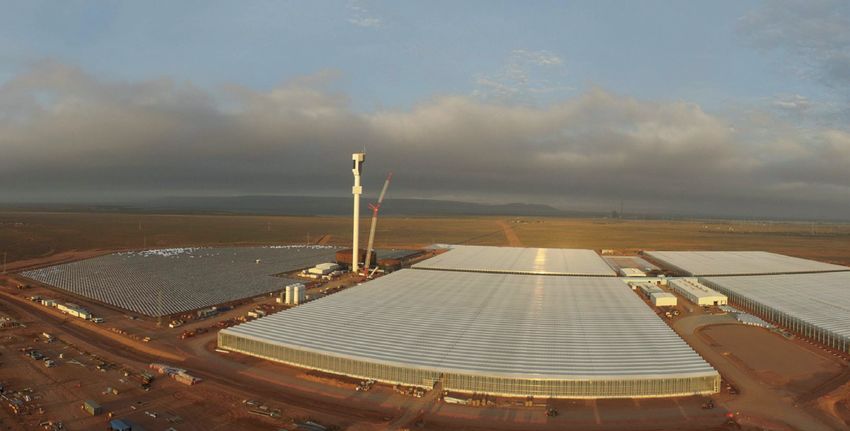
3    POWERING PROGRESS:
     STATES RENEWABLE ENERGY RACE

    More solar PV capacity was added
    globally in 2017 than coal, natural
    gas and nuclear combined.

    Table 1: The top 10 countries with the most wind and solar   Globally, 2017 was a record year for renewable
    electricity generation.                                      energy, with more renewable energy capacity
                                                                 added than any other year, up 9% from
                                    % wind and solar             2016 (REN21 2018). Over half (55%) of this
     Country                        electricity generation
                                                                 new renewable energy capacity was solar
     Denmark                        Over 50%                     photovoltaic (PV) power, 29% was wind power
                                                                 and 11% was hydro (REN21 2018).
     Uruguay                        Over 30%

     Germany                        Over 20%                     More solar PV capacity was added around
                                                                 the world than coal, natural gas and nuclear
     Ireland                        Over 20%                     combined, with global solar capacity
     Portugal                       Over 20%
                                                                 increasing by one third to 402GW (REN21
                                                                 2018). Wind energy capacity increased by
     Spain                          Over 20%                     52GW to 539GW – the third strongest year
                                                                 ever for wind energy. This was driven by
     United Kingdom                 Over 15%
                                                                 record years for wind in Europe and India
     Greece                         Over 15%                     (REN21 2018).

     Honduras                       Over 15%
                                                                 Countries around the world are integrating
     Nicaragua                      Over 15%                     an increasingly large amount of renewable
                                                                 energy into their electricity grids.
    Source: REN21 (2018).                                        Approximately 17 countries generated more
                                                                 than 90% of their electricity with renewable
                                                                 energy in 2017 (REN21 2018). Meanwhile,
                                                                 thirteen countries generated 10% or more of
                                                                 their power from wind energy in 2017, while
                                                                 at least ten countries including the United
                                                                 Kingdom generated 15% or more of their
                                                                 electricity from solar PV and wind power in
                                                                 2017. Ireland generated more than 20% of
                                                                 their electricity from solar and wind (Table 1;
                                                                 REN21 2018).
CHAPTER 01 4
INTRODUCTION
Following this introduction, section two of
this report profiles renewable energy and
storage progress, developments and policies
across states and territories over the past
twelve months. Section three tracks state
and territory performance across a range
of renewable energy metrics: percentage
of renewable electricity; proportion of
households with solar; large-scale wind
and solar capacity per capita; and targets
or policies in place for renewable energy.
Section four then profiles each of the eight
states and territories, from leaders like the
ACT to those states still stuck at the starting
blocks like New South Wales and Western
Australia. The report concludes with Section
five highlighting the ongoing importance
of state and territory government policies,
particularly in light of the continuing
absence of a credible long-term policy to
tackle climate change from the Federal
Government.
More than ten countries
already generate 15% of
their electricity from
wind and solar.5 POWERING PROGRESS:
STATES RENEWABLE ENERGY RACE
2. States and Territories
stepping in to tackle
climate change
In the continuing absence of credible In the past year, states and territories have
national climate and energy policy, continued to push ahead with the transition
state and territory government from fossil fuels to a renewable powered
renewable energy targets and policies future:
are crucial to reducing Australia’s
greenhouse gas pollution levels. ›› Having contracted enough wind and
solar projects to reach its 100% renewable
energy target by 2020, the Australian
Capital Territory (ACT) has almost half
of its electricity coming from renewable
energy, a proportion that will continue
to grow as more of the ACT’s contracted
projects come online. The ACT is supporting
the rollout of 5,000 household batteries.
›› There was a change of government in
South Australia following the state election
in March 2018. While the incoming
Liberal government pledged to drop the
state’s renewable energy target, the new
government’s first budget maintained
support for pre-existing renewable
energy and storage policies as well as
announcing new funding for grid scale
and household battery storage and
demand response (Solar Quotes 2018a).
The most powerful battery in the world (to-
date) began operating in South Australia,
saving consumers millions of dollars.
Several more grid-scale batteries are now
being installed in the state, and the state
government is implementing policies to
support thousands of households to install
their own battery.CHAPTER 02 6
STATES AND TERRITORIES STEPPING IN TO TACKLE CLIMATE CHANGE
›› Victoria legislated its renewable energy ›› Queensland has created a state owned
target of 25% by 2020 and 40% by 2025. renewable energy company, CleanCo,
In September the state also announced which includes hydro and pumped hydro
the results of Australia’s largest reverse generators. It will eventually grow to
auction (to date) for 650MW of renewable include wind and solar projects.
energy. A reverse auction is a process to
contract power from the lowest priced ›› Western Australia remains the only state
renewable energy projects, locking in low without a renewable energy or net zero
prices for consumers and a fixed long- emissions target. The state closed its
term price for new renewable energy oldest coal power station (albeit after an
projects. The Victorian Government’s expensive, failed retrofit) and has begun
announcement ensures three new wind modest investments in renewable energy.
farms and three new solar farms, totalling
928MW, will proceed to construction ›› In New South Wales, AGL Energy has
(Victorian Government 2018b). Victoria taken the lead in progressing a detailed
supported the construction of three multi-billion dollar lower emissions
large-scale batteries and announced new investment program to replace the end-of-
programs to support household solar, life Liddell Power coal power plant in the
battery storage and solar hot water. Hunter Valley, despite Federal Government
resistance to this transformative proposal.
›› The Northern Territory has given in-
principle support to all recommendations ›› Five states and territories have strong
made by an expert panel into how the renewable energy targets in place. Apart
territory can meet its commitment to from Western Australia and the Northern
source 50% of the territory’s power from Territory, all states and territories in
renewable energy by 2030. The Northern Australia now have economy wide net zero
Territory has announced a tender for emissions targets in place.
battery storage and is building a large-
scale battery in Alice Springs.
›› Tasmania has become the first state
to achieve net zero emissions in
2015-16 as a result of the protection of
Tasmania’s extensive native forests that
act as a carbon sink – cancelling out
the state’s emissions from energy and
transport. Originally, Tasmania had a
policy to achieve net zero emissions by
2050. Tasmania has also commenced
construction of two new wind farms
to help the state reach its target of 100%
renewable energy by 2022.7 POWERING PROGRESS:
STATES RENEWABLE ENERGY RACE
3. State and Territory
Renewable Energy
Scorecard 2018
The Climate Council tracks the relative ACT, Tasmania and South Australia continue
progress of Australian states and to lead the charge on renewable energy,
territories based on their performance with Victoria and Queensland catching
across a range of renewable energy up. Despite some positive steps, Western
metrics: percentage of renewable Australia, New South Wales and the Northern
electricity, proportion of households Territory lag behind the other states and
with solar, large-scale wind and solar territories when measured against the
capacity per capita and targets or renewable energy scorecard criteria.
policies in place for renewable energy.CHAPTER 03 8
STATE AND TERRITORY RENEWABLE ENERGY SCORECARD 2018
3.1 Percentage renewable
electricity
Tasmania, the ACT and South Australia Tasmania, South Australia and New South
continued to lead with the largest shares of Wales. In Tasmania and New South Wales
renewable energy out of all the states and this was due to a substantial drop in hydro
territories (Table 2). generation, while in South Australia this was
due to substantially higher gas generation
In 2017, the proportion of renewable energy as a result of the closure of the Northern
increased in five states and territories - the coal power station in May 2016 and higher
ACT, Victoria, Queensland, the Northern electricity demand (Department of the
Territory and Western Australia. Meanwhile Environment and Energy 2018a).
the share of renewable energy decreased in
Table 2: State and territory percentage of renewable energy. Tasmania is leading with 87.4%, while the Northern Territory is in
last place with just 3%.
% of renewable energy in 2017 % wind and solar electricity
State/Territory (including hydro) generation in 2017
TAS 87.4 11.2
ACT 46.21 43.1
SA 43.4 42.7
VIC 13.6 10.4
NSW 12.6 6
WA 7.5 6.5
QLD 7.1 3.7
NT 3 3
Source: Department of the Environment and Energy (2018a).
1
% of renewable energy consumed over 2017 (ACT Government 2018)
Note: Federal Government energy statistics are used here to provide a consistent means of comparing the states and
territories. Individual states and territories may publish different renewable percentage figures based on different
assumptions and data sources. The ACT is an exception, as the Federal Government does not report separately on the ACT
and it sources renewable energy from outside the ACT to meet its target.
South Australia (48.9%), NSW (14.6%), Queensland (8.4%) and Victoria (18.8%) all report higher percentage figures for their
individual state than Federal Government figures. For example, Victorian Government figures for the proportion of renewable
energy are significantly higher as these include the Murray hydroelectric station (located in NSW, but in Victoria’s National
Electricity Market region) in Victoria’s total.9 POWERING PROGRESS:
STATES RENEWABLE ENERGY RACE
Figure 1: Some states and territories, like Tasmania and the ACT, are continuing to lead the charge by investing in wind and solar.
Other states, like Western Australia and the Northern Territory, are at the back of the pack.
STATES & TERRITORIES
LEADING THE CHARGE
ON RENEWABLE ENERGY
AUSTRALIA NT QLD
23.5% renewable energy by 2020 50% renewable energy by 2030 50% renewable energy by 2030
(33,000GWh of large-scale
renewable energy) No net zero emissions target Net zero emissions by 2050
WA NSW
No renewable energy target No renewable energy target
No net zero emissions target Net zero emissions by 2050
NT
3%
QLD
7.1%
WA
7.5%
SA
43.4%
NSW
12.6%
VIC ACT
13.6% 46.2%
SA
ACT
No renewable energy target TAS 100% renewable energy by 2020
Net zero emissions by 2050
87.4%
Net zero emissions by 2045
VIC
LEGEND 25% renewable energy by 2020 TAS
40% renewable energy by 2025
Shaded regions show the
100% renewable energy by 2022
percentage of renewable Net zero emissions by 2050
energy in 2017 Achieved net zero emissionsCHAPTER 03 10
STATE AND TERRITORY RENEWABLE ENERGY SCORECARD 2018
3.2 Wind and solar
capacity per person
South Australia, the ACT (see Figure 2) While Queensland has just 377MW of wind
and Tasmania have more wind and solar and solar capacity (and lags behind the other
capacity per person than the other states states in terms of capacity per capita), this
and territories (Table 3). number is expected to increase significantly
over the next few years as the state has over
In terms of total large-scale wind and solar, 3,000MW of wind and solar projects under
South Australia continues to have the construction (Clean Energy Council 2018a).
largest amount of installed wind and solar
capacity (1,831MW), closely followed by
New South Wales (1,759MW) and Victoria
(1,634MW) (AEMO 2018c; Table 3).
Figure 2: The Mount Majura solar farm, which opened in 2016, was supported by the ACT Government with a power
purchase agreement.11 POWERING PROGRESS:
STATES RENEWABLE ENERGY RACE
South Australia and the
ACT have the highest
amount of wind and solar
capacity per person.
Table 3: State and territory large scale solar and wind capacity per person in 2018 (small scale solar excluded).
Wind and solar installed Wind and solar capacity per
State/Territory Population (in millions)1 capacity (MW)2 capita (kW/pop)
SA 1.728 1,831 1.1
ACT 0.416 4493 1.1
TAS 0.525 373 0.7
VIC 6.386 1,634 0.3
NSW 7.915 1,759 0.2
WA 2.585 4884 0.2
QLD 4.965 377 0.1
NT 0.247 135 0.1
Sources: 1 ABS (2018). 2 AEMO (2018c). 3 ACT Government (2018). 4 AEMO (2018b). 5 APVI (2018).CHAPTER 03 12
STATE AND TERRITORY RENEWABLE ENERGY SCORECARD 2018
3.3 Proportion of households
with solar
Australian households and businesses have Queensland (32.9%), South Australia (32.3%)
continued to install rooftop solar in record and Western Australia (26.7%) continued to
numbers. In 2017, Australians installed have the highest proportion of households
1.25GW of solar PV and 2018 is on track with rooftop solar (APVI 2018; Figure 3).
to be a new record year, with over 1GW of
rooftop solar already installed by the end There are now 26 Australian suburbs where
of September (SunWiz 2018a; 2018b). This over 50% of dwellings have installed rooftop
rapid increase has been partly driven by a solar, up from 22 in last year’s report (APVI
large increase in commercial and industrial 2018). 19 of these suburbs are in Queensland
businesses installing large rooftop solar (Table 4) with four in South Australia. The
systems to reduce their energy bills best performing postcodes in each state are
(Climate Council 2018; SunWiz 2018b). listed in Table 5.
There are now 26 Australian suburbs
and towns where over half of all
households have rooftop solar.
Figure 3: Queensland leads the nation in the proportion of households with rooftop solar.13 POWERING PROGRESS:
STATES RENEWABLE ENERGY RACE
There is a range of programs being pursued effectively operate as one power station –
by state and territory governments to hence the name, virtual power plant.
encourage the uptake of rooftop solar and
battery storage to reduce energy bills: ›› Victoria have announced a new program
to reduce the upfront cost of rooftop solar
›› Northern Territory is providing grants for households by paying for half the
of up to $1,000 for households to install cost of the solar panels and providing an
rooftop solar on their homes. interest-free loan to cover the other half of
the cost to be paid back over four years.
›› South Australia has two programs to roll
out battery storage. The first includes grants ›› The ACT is rolling out 5,000 batteries to
of up to $6,000 for 40,000 households households and businesses with rooftop
to install batteries. The second program solar.
involves the construction of a virtual power
plant, with 100 batteries already rolled All homes that are part of the residential
out to low income households with the development of Alkimos Beach in Western
potential to upscale this program to 50,000 Australia (Figure 4) have solar panels on
households. The virtual power plant’s solar their rooftops. The development is also
and battery storage systems will be owned the first to trial community-scale battery
by an electricity retailer and controlled storage (1.1MWh) to store solar power from
by the same software. This enables the the residents at Alkimos Beach, reducing the
generation, charge and discharge of energy community’s dependence on electricity
to be coordinated, so that all the systems from the grid (Lend Lease 2018).
Table 4: Percentage of rooftop solar penetration by state and territory. Queensland and South Australia continue to lead the
nation.
Number of postcodes where over
50% of dwellings have rooftop solar
% of rooftop solar penetration by (excluding postcodes with under
State/Territory state and territory 1,000 dwellings)
QLD 32.9 19
SA 32.3 4
WA 26.7 1
NSW 17.6 2
VIC 15.9 -
ACT 14.2 -
TAS 14.2 -
NT 13.8 -
Source: APVI (2018).Figure 4: Homes in the Alkimos Beach residential development in Western Australia have rooftop solar.
Table 5: The top postcode in each state or territory for residential uptake of rooftop solar. Only suburbs with more than
1,000 dwellings are included.
Rooftop solar % of households
State Postcode Suburbs installations with rooftop solar
QLD 4516 Elimbah 868 68.5
SA 5172 Wilunga, Hope Forest, Dingabledinga, 872 54.1
Pages Flat, Yundi
NSW 2390 Baan Baa, Bohena Creek, Bullawa 1865 52.4
Creek, Couradda, Edgeroi, Eulah Creek,
Harparary, Jacks Creek, Kaputar,
Narrabi, Narrabi West, Tarriaro,
Turrawan
WA 6038 Alkimos 1298 50.2
VIC 3678 Towns around Wangaratta, including 981 36.3
Peechelba, Milawa and Everton
TAS 7017 Grasstree Hill, Honeywood, Old Beach, 519 24.8
Otago, Risdon, Tea Tree
NT 870 Alice Springs 1882 23.4
ACT 2611 Brindabella, Bimberi, Coombs 1912 20.7
Source: APVI (2018).15 POWERING PROGRESS:
STATES RENEWABLE ENERGY RACE
Figure 5: Queensland is leading Australia with over 50% of households in 19 postcodes having installed rooftop solar. South
Australia has the second most with four.
POSTCODES WITH
50% OR HIGHER
ROOFTOP SOLAR
4518
4563
4561
4555
4516
4553
4511
4514
4505
4306
4504
4512
6038 4156
4520
4228
4124
5254
4125
2390
5171 2899
4270
4280
5172
5157CHAPTER 03 16
STATE AND TERRITORY RENEWABLE ENERGY SCORECARD 2018
3.4 Renewable energy
targets and policies
With the exception of Western Australia, In the past year, the ACT brought forward
all states and territories have committed to its net zero emissions target from 2050 to
renewable energy targets and/or net zero 2045 (ACT Government 2018). The incoming
emissions targets (Table 6). South Australian government have dropped
the state’s renewable energy target (which
was not legislated).
Table 6: State and territory renewable energy targets and net zero emissions targets.
ACT VIC QLD TAS NT SA NSW WA
Renewable 100% by 25% by 50% by 100% by 50% by - - -
electricity 2020 2020 2030 2022 2030
targets
40% by
2025
Net zero By 2045 By 2050 By 2050 By 2050 - By 2050 By 2050 -
emissions
target
Source: ACT Government 2018; New South Wales Government 2016; Northern Territory Government 2018; Queensland
Government 2017; Tasmanian Government 2017a; Tasmanian Government 2017b; Victoria State Government 2017.
All states and territories have renewable
energy targets or net zero emissions
targets, except Western Australia.17 POWERING PROGRESS:
STATES RENEWABLE ENERGY RACE
3.5 Powering forward:
the renewable energy
construction boom
Australia’s renewable energy boom that electricity grid (Clean Energy Council 2018a).
re-started in 2017 has continued, with 30 This is similar to the capacity of New South
projects finished in 2018 so far and another Wales’ entire coal power station fleet. These
69 projects under construction or about to projects are also creating over $15.6 billion of
start construction (as of 21 September) (Clean investment throughout the country (Clean
Energy Council 2018a). Investment in large- Energy Council 2018a).
scale renewable energy in Australia fell to the
lowest levels in ten years in 2014 and 2015. These projects are not spread evenly across
This was due to uncertainty caused by the all states and territories. Queensland is
abolition of the Carbon Pricing Mechanism, attracting the largest amount of new
multiple Federal Government reviews of, and capacity and investment, while Victoria and
the eventual cut to the Renewable Energy New South Wales are also attracting large
Target (SMH 2016). amounts of new capacity and investment
(Clean Energy Council 2018a). In the case of
The renewables construction boom is Western Australia, just 70MW of new capacity
creating 9,269 jobs and adding 10,979MW is under construction, the lowest of any state
of renewable energy capacity to Australia’s (Clean Energy Council 2018a) (Table 7).
Australia’s current renewable energy
construction boom is creating almost
10,000 jobs and adding over 10,000MW
in new wind and solar capacity.CHAPTER 03 18
STATE AND TERRITORY RENEWABLE ENERGY SCORECARD 2018
Table 7: The number of wind and solar projects under construction or about to start construction by state or territory, along
with the investment and jobs numbers that these projects are driving. Queensland is attracting the bulk of these projects.
Number of
renewable % of new
energy national % of national
projects under Capacity of renewable renewable
construction or these projects energy capacity Investment energy jobs
State about to start (MW) by state (AU$M) Jobs by state
Total 69 10,979 100% 15,600 9,269 100%
QLD 20 3,287 30 4,344 3,006 32
VIC 19 3,181 29 4,479 3,040 33
NSW 18 2,648 24 3,709 1,505 16
SA 8 1,681 15 2,638 1,280 14
TAS 1 112 1 280 208 2
WA 3 70 1 150 230 3
Source: Clean Energy Council (2018a).
Almost three times as many renewable
energy projects have been completed so far Queensland and
Victoria are home to
in 2018 compared to the entire total for 2017,
when just twelve projects reached completion
(Clean Energy Council 2018a).
65% of all renewable
There are still 69 renewable energy projects
under construction or about to start in
Australia, even though there is an absence
energy jobs being
of Federal Government climate and energy
policy to drive investment in new energy
created in Australia.
generation after 2020 when the Federal
Renewable Energy target ends. So far in 2018,
a further 29 renewable energy projects have
reached financial close, compared to 42 in
2017 (Clean Energy Council 2018a). State and
territory policies will continue to be critical
to supporting new investment in renewable
energy after 2020.19 POWERING PROGRESS:
STATES RENEWABLE ENERGY RACE
4. State and Territory
by Renewable
Energy ProgressCHAPTER 04 20
STATE AND TERRITORY BY RENEWABLE ENERGY PROGRESS
4.1 Front Runners
AUSTRALIAN CAPITAL TERRITORY
The ACT has a renewable electricity target BOX 1: FAST FACTS
for 100% renewable energy by 2020 (to
meet the ACT’s electricity needs). The
territory will reach this goal as it has Percentage renewable power:
contracted wind and solar farms under its The ACT consumed 46.2% renewable
nation-leading reverse auction process electricity in 2017, the second highest
driving investment in 600MW of wind amount of any state or territory. The
power and 40MW of large-scale solar (ACT territory is on track to achieve 100%
Government 2018). These projects are all renewable electricity by 2020.
expected to be operational by 2020.
Households:
The ACT's 100% renewable energy 14.2% of ACT households have rooftop
target and reverse auction process has solar.
contributed a significant proportion of
new renewable electricity capacity added Policy
across Australia over the past two years ›› On track to hit 100% renewable
(Clean Energy Council 2018a). Nationally, energy in 2020, after completion of
the ACT’s reverse auction program made the ACT’s reverse auction program,
up: 54% of all new renewable energy supporting over 600MW of wind
capacity added across Australia in 2016 and solar projects.
and 40% in 2017. A further 14% of projects
under construction in December 2017 ›› Household battery grants, aiming to
were supported under the ACT reverse support the rollout of 5,000 batteries
auction scheme - the 270MW Sapphire by 2020.
Wind Farm and 91MW Crookwell 2 Wind
Farm. Projects completed in 2017 under ›› Brought forward net zero emissions
the ACT target included the Ararat Wind target for 2045.
Farm (80.5MW) and stages 2 and 3 of the
Hornsdale wind farm (209MW) (Clean
Energy Council 2018a).
Source: ACT Government 2018; ActSmart 2018;
APVI 2018; Department of the Environment and
Energy 2018a.
The ACT is on track for 100%
renewable electricity by 2020.21 POWERING PROGRESS:
STATES RENEWABLE ENERGY RACE
The ACT now gets 46.2% of its electricity grants program, a typical household with
from renewable energy, the second 5kW of rooftop solar is eligible for around
highest amount of any state or territory in $4,000 to help install a battery (ActSmart
Australia after Tasmania (Department of 2018). The combined capacity of the batteries
the Environment and Energy 2018a). 14.2% is expected to be around 36MW (ActSmart
of ACT households now have rooftop solar 2018).
(APVI 2018).
The ACT has brought forward its net zero
The ACT is embracing energy storage with emissions target from 2050 to 2045 (ACT
an ambitious plan to roll out 5,000 battery Government 2018). The ACT government
storage systems across ACT households are currently developing a new strategy to
and businesses by 2020 (ActSmart 2018). achieve this goal.
Under the Next Generation Energy Storage
The ACT now For more information on the ACT’s
renewable energy leadership, read the
generates almost half Climate Council’s report:
of its electricity from ‘Territory Trailblazer:
How the ACT became
renewable energy. the renewable capital
of Australia’.
Figure 6: The three stages of the Hornsdale Wind Farm in South Australia (below) put forward winning bids under the ACT’s
reverse auction process. Stages 2 and 3 of the project set record low prices for wind energy in Australia at the time.CHAPTER 04 22
STATE AND TERRITORY BY RENEWABLE ENERGY PROGRESS
TASMANIA
Tasmania’s renewable energy generation BOX 2: FAST FACTS
fell in 2017 to 87.4% due to lower hydro
generation and higher gas generation
(Department of the Environment and Percentage renewable power:
Energy 2018a). In 2017, the state set a 100% Tasmania had 87.4% renewable energy
renewable energy target for 2022 and to in 2017 (down from 92% in 2016).
achieve this goal, the state government
are supporting the construction of two Households:
new wind farms (ABC News 2017b). The 14.2% of households have rooftop solar
144MW Cattle Hill wind farm and the
112MW Granville Harbour wind farm are Policy
both under construction or about to begin ›› 100% renewable energy by 2022.
construction (RenewEconomy 2018c;
2018d). ›› Net zero emissions target by 2050
(already achieved).
The Tasmanian Government is funding
a feasibility study into the expansion of ›› Funding for feasibility study of
Tasmania’s hydro scheme to provide the ‘Battery of the Nation’ pumped
National Electricity Market with pumped hydro project.
hydro energy storage. Pumped hydro
is not renewable energy but it can help
store renewable energy which can then Source: APVI 2018; Clean Energy Council 2018a;
be used when needed. There are 14 sites Department of the Environment and Energy 2018a;
Premier of Tasmania 2018; RenewEconomy 2018e.
in Tasmania with high pumped hydro
potential, which have a combined capacity
of 4,800MW (RenewEconomy 2018e).
For the project to come to fruition, a new
interconnector between Tasmania and
Victoria will be required (RenewEconomy
2018e). The feasibility study is being
funded by the Tasmanian Government and
the Australian Renewable Energy Agency.
Tasmania has a 100% renewable
energy target by 2022.23 POWERING PROGRESS:
STATES RENEWABLE ENERGY RACE
Tasmania became the first state to achieve
net zero emissions in 2015-16. The state’s
emissions in 2015-16 had declined 100%
from 1989-90, largely due to the state’s
extensive forests that act as a carbon sink
for emissions in other sectors (Premier
of Tasmania 2018). However, achieving
net zero emissions through land-based
measures can be risky and potentially
short-lived, because carbon stored on
land is vulnerable to being returned to
the atmosphere, for example, through
bushfires, insect plagues and changes in
land clearing policies. Tasmania has a net
zero emissions target for 2050.
Figure 7: Tasmania’s Woolnorth Wind Farm.CHAPTER 04 24
STATE AND TERRITORY BY RENEWABLE ENERGY PROGRESS
SOUTH AUSTRALIA
South Australia has been leading Australia BOX 3: FAST FACTS
in the uptake of renewable energy and
storage over the past decade. The Climate
Council’s renewable energy scorecards Percentage renewable power:
have consistently placed South Australia Renewable energy generation fell
as a front-runner in renewable energy, slightly in South Australia in 2017 to
with supportive policies and targets, high 43.4% (from 46.6% in 2016). The state
household uptake of solar and high quality is on track for 73% renewable energy
wind and solar resources. The incoming generation by 2020-21.
state government, elected in March 2018,
has since dropped South Australia’s Households:
renewable energy target. This has led to a South Australia has the second highest
fall in South Australia’s ranking. proportion of solar PV households (32.3%).
South Australia is aiming towards net Policy
zero emissions by 2050. The state has ›› South Australia now has no target to
an emissions reduction target set in increase renewable energy.
legislation to reduce greenhouse gas
emissions by at least 60% below 1990 ›› South Australia is aiming towards
levels. A Climate Change Strategy is also net zero emissions by 2050. The
being developed by the Premier’s Climate state is also developing a Climate
Change Council at the request of the Change Strategy.
state government (Government of South
Australia 2018c). ›› The world’s most powerful battery
began operating at the Hornsdale
Wind Farm in December, with more
grid-scale batteries to open soon.
›› Two programs to roll out battery
storage: grants of up to $6,000
for 40,000 households to install
batteries; and 100 household
batteries already rolled out to low
income households as part of a
virtual power plant, with potential
to upscale this program to 50,000
households.
Source: AEMO 2017; 2018a; APVI 2018; Clean
Energy Council 2018a; Department of the
Environment and Energy 2018a; Government
of South Australia 2018a; 2018b; 2018c.25 POWERING PROGRESS:
STATES RENEWABLE ENERGY RACE
South Australia has abolished
its renewable energy target.
South Australia’s proportion of renewable South Australia has a number of wind and
electricity generation fell in 2017 from solar projects under construction which
47% to 43.4%. This was mainly due to are expected to increase renewable energy
substantially higher gas generation in the generation further in coming years, projected
aftermath of the closure of the Northern to reach 73% renewable electricity as soon
coal power station in May 2016, as well as as 2020-21 (AEMO 2017). These include the
higher electricity demand (Department Lincoln Gap wind farm and battery, the
of the Environment and Energy 2018a). Willogoleche wind farm, and the Bungala and
This occurred despite absolute wind Tailem Bend solar farms (Engie 2017; Lincoln
and solar generation increasing by 7% in Gap Wind Farm 2018; RenewEconomy 2018a;
2017. In fact, South Australia experienced Power Technology 2018).
the second highest percentage increase
in renewable energy generation of any A solar thermal plant is also planned in Port
state in the National Electricity Market Augusta. If it is built it will be Australia’s
(behind Queensland) (Department of the largest solar thermal plant and will provide
Environment and Energy 2018a). 100% of the South Australian government’s
electricity needs (Government of South
The increase in wind generation could have Australia 2017). The 150MW plant will be
been higher but the region experienced able to generate a clean and reliable supply
unusually low levels of wind in 2017, of electricity 24/7 (Government of South
resulting in lower capacity factors at Australia 2017).
many wind farms (Department of the
Environment and Energy 2018a; ABC In December 2017, the world’s most powerful
News 2017a). This was particularly an issue lithium ion battery began discharging into the
in winter 2017, with some wind farms grid, improving the security of the electricity
reporting wind generation at 30% below the grid and significantly reducing costs for
historical average during that time (ABC consumers. It is estimated that during one
News 2017a). instance on the 14th of January, the battery
reduced costs to consumers by $3.5 million
over a five-hour period (AEMO 2018a).CHAPTER 04 26
STATE AND TERRITORY BY RENEWABLE ENERGY PROGRESS
South Australia is expected to have 73%
renewable electricity in just two years.
Other grid-scale batteries are also being South Australia is investing heavily in
built in South Australia. South Australia’s household batteries. The newly elected
second ‘big battery’, the Dalrymple South Australian government announced
North battery on the Yorke Peninsula is in September that they would provide
currently undergoing commissioning. $100 million in grants and $100 million
The 30MW/8MWh battery has already in loans to enable 40,000 households to
demonstrated that it can support the local install their own batteries. These batteries
grid when it is disconnected from the can store solar energy and will help to
rest of the distribution and transmission reduce consumers power bills. The grants
network (RenewEconomy 2018l). The are available to all households at $500 per
state will soon be home to two more kWh with lower income households who
batteries, with a 10MW/10MWh battery at are Energy Concession Holders able to
the Lincoln Gap wind farm about to begin access a higher subsidy of $600 per kWh
construction and a 21MW/26MWh battery (Government of South Australia 2018a).
planned near the Snowtown wind farm Grants are capped at $6,000 per battery.
(RenewEconomy 2017m). All batteries under this program will be
capable of being part of a virtual power plant,
although individual households will be able
to decide whether they join one. As part of
this program, households will also be able
to apply for finance from the Clean Energy
Finance Corporation to install rooftop solar
(Government of South Australia 2018a).27 POWERING PROGRESS:
STATES RENEWABLE ENERGY RACE
The state government is continuing with
the previous government’s program to
create a virtual power plant, with one
hundred 13.5kWh batteries rolled out at low
income Housing SA homes (Government
of South Australia 2018b). Another 1,000
homes will soon follow, with the potential
to scale up the program to 50,000 Housing
SA and low income homes (Government of
South Australia 2018b). The virtual power
plant’s solar and battery storage systems
will be owned by an electricity retailer
and controlled by the same software.
This enables the generation, charge and
discharge of energy to be coordinated,
so that all the systems effectively operate
as one power station – hence the name,
“virtual power plant”.
Figure 8: This solar thermal plant provides around 90% of the electricity needs of tomato growers Sundrop Farms in Port
Augusta, South Australia.CHAPTER 04 28
STATE AND TERRITORY BY RENEWABLE ENERGY PROGRESS
4.2 Catching up
VICTORIA
Victoria is rapidly transforming its BOX 4: FAST FACTS
electricity grid with the state home to
ambitious renewable energy policies and a
large number of renewable energy projects. Percentage renewable power:
Victoria had 13.6% renewable electricity
Victoria currently generates 13.6% of its in 2017, up from 12.1% in 2016.
electricity from renewable energy but
this is likely to rise rapidly in the next few Households:
years. Renewable energy generation may 15.9% of households have solar PV.
provide as much as 39.4% of the state’s
consumption by 2020 (Green Energy Policy
Markets 2018). ›› Renewable energy target of 25% by
2020 and 40% by 2025.
Victoria succeeded in legislating its two-
stage renewable energy target in 2017 and ›› Australia’s single largest reverse
shortly thereafter launched its first reverse auction for 928MW of wind and
auction for 650MW of wind and solar solar capacity.
capacity (Victorian Government 2018b). In
September 2018, the Victorian Government ›› Support for the construction
announced that six renewable energy of three large-scale batteries in
projects with a combined capacity of 928 Ballarat, at the Gannawarra solar
MW had been successful in the auction. farm and at the Bulgana wind farm.
This has been the largest reverse auction
for renewable energy in Australia and ›› New policies to encourage the
will help the state meet targets of 25% uptake of rooftop solar and battery
renewable energy by 2020 and 40% storage.
renewable energy by 2025 (Victorian
Government 2018a). ›› A commitment to reduce Victoria’s
greenhouse gas emissions by 15-20
per cent below 2005 levels by 2020.
›› A net zero emissions target by 2050.
Victoria has held Source: ACT Government 2018; ActSmart 2018;
APVI 2018; Department of the Environment and
Australia’s largest Energy 2018a.
ever auction for
renewable energy.29 POWERING PROGRESS:
STATES RENEWABLE ENERGY RACE
Victoria’s tram network will soon be
powered by 100% renewable energy.
Victoria has been very supportive of Victoria 2018a). The project will be complete
energy storage. In early 2018, the Victorian in 2019 and provide clean, affordable and
Government announced two winners reliable power 24/7.
of a tender for 55MW/80MWh of battery
storage. A 30MW/30MWh battery will be The Victorian Government is also building
built at a terminal station in Ballarat and a wind and solar plants to power the state’s
25MW/50MWh battery will be co-located iconic tram network with 100% renewable
with the 60MW Gannawarra solar farm, energy. This includes 34MW of the
which is also under construction (ARENA Numurkah solar farm (the solar farm will be
2018a). These large-scale batteries are 100MW in total) and the 88MW Bannerton
expected to be operational by summer solar park (Victorian Government 2018c).
2018-19.
The state government has announced a
The Victorian Government has also new program to reduce the upfront cost
supported an integrated wind farm and of rooftop solar for households by paying
battery storage project. The 194MW up to half the cost of the solar panels. This
Bulgana wind farm will be backed up by $1.24 billion program will see solar panels
a 20MW/34MWh battery to power Nectar installed on 650,000 more homes over ten
Farms’ greenhouses in Stawell (Premier of years (Premier of Victoria 2018b). Currently,
15.9% of Victorian households have rooftop
solar (APVI 2018). As part of this program,
the government will also provide half
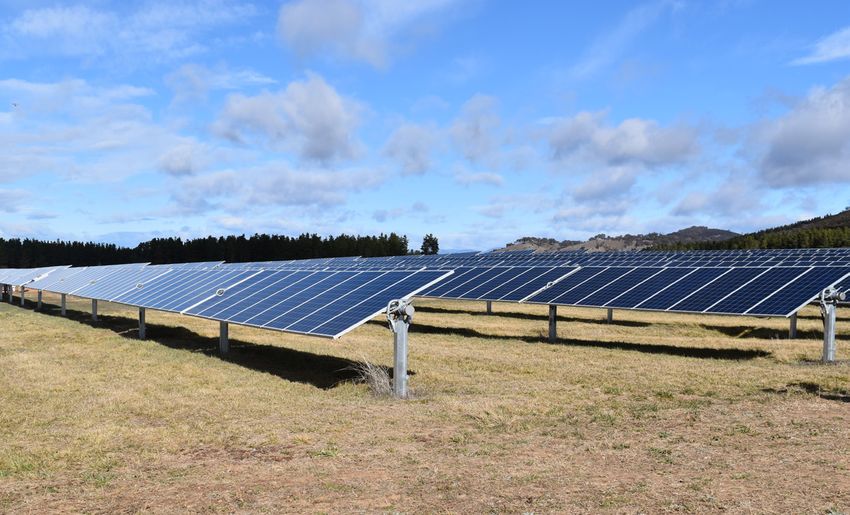
Figure 9: The Mount Gellibrand wind farm in Victoria,
completed in 2018. The wind farm was supported by a 2015 price solar batteries for 10,000 Victorian
Victorian Government tender for 100MW of renewable energy. households that already have solar panels.
The government will also provide $40 million
to households to install batteries in their
homes. 10,000 households will be provided
with up to $4,838 depending on battery
size, to cover part of the cost of the battery
(RenewEconomy 2018k).
There is a proposal to build Australia’s first
offshore wind farm off the coast of South
Gippsland in Victoria (a 2,000MW project)
(RenewEconomy 2017a). The eight billion
dollar ‘Star of the South’ proposal would
include 250 turbines and be located 10-25km
off the Gippsland coast in the Bass Strait
(RenewEconomy 2017a). The project could
produce enough electricity to power 1.2
million homes (RenewEconomy 2017a).CHAPTER 04 30
STATE AND TERRITORY BY RENEWABLE ENERGY PROGRESS
BOX 5: COAL CLOSURES IN 2017
In March 2017, Victoria’s Hazelwood coal
power station was officially retired. The
1,600MW power station was 53 years old For more information on coal-fired
and becoming an increasingly unsafe power stations in Australia, read the
workplace. Since the closure of the Climate Council’s report:
power station, much of its capacity has
been replaced by wind and solar (ABC
News 2016). ‘End of the Line:
Coal in Australia’.
In September 2017, Western Australia’s
Muja AB coal power station located in
Collie south of Perth also closed (The
West Australian 2017). The 220MW
power station was 53 years old and
had been initially closed in 2007, but
the state government undertook an
expensive and controversial $300
million dollar refurbishment in 2008.
After returning to service, the power
station struggled to generate electricity
and became increasingly unreliable.
In 2016, the Western Australian
Government announced they would be
shutting it down, just eight years after
the redevelopment began (The West
Australian 2017).31 POWERING PROGRESS:
STATES RENEWABLE ENERGY RACE
QUEENSLAND
In 2017 and 2018, Queensland has BOX 6: FAST FACTS
continued to lead Australia in the
construction of new renewable energy
projects, with 20 renewable energy projects Percentage renewable power:
totaling 3,287MW under construction. Queensland had a 7.1% share of
While the national Renewable Energy renewable energy in 2017 up from
Target is a key driver of many of these 6.5% in 2016.
projects, Queensland’s excellent
renewable energy resources and strong Households:
state government support have also been Queensland has the highest proportion
important in making Queensland home of households with solar PV (32.9%).
to the largest amount of renewable energy
construction of any state or territory in Policy
Australia (Clean Energy Council 2018a). ›› 50% renewable energy target by 2030.
Although Queensland only generated ›› Reverse auction announced for
7.1% of its electricity from renewable 400MW of renewable energy and
energy in 2017, twelve wind and solar storage.
farms have already opened in 2018 with
another 20 under construction or about ›› A net zero emissions target by 2050.
to start (Department of the Environment
and Energy 2018a; Clean Energy Council
2018a). These projects should propel Source: APVI 2018; Clean Energy Council 2018a;
Queensland forward to a much higher Department of the Environment and Energy 2018a;
Premier of Tasmania 2018; RenewEconomy 2018e.
level of renewable energy generation in
the next few years.
Along with their net zero emissions target,
Queensland has committed to a 50%
renewable energy target by 2030, and to
help achieve this the state government
has announced a tender for 400MW of
renewable energy capacity, including
100MW of energy storage. Although
the tender closed in September 2017,
the winners are yet to be announced
(Queensland Government 2018a). The
100MW energy storage reverse auction
is one of the largest auctions for energy
storage in Australia.You can also read