Precision Instrument Targeting via Image Registration for the Mars 2020 Rover - IJCAI
←
→
Page content transcription
If your browser does not render page correctly, please read the page content below
Proceedings of the Twenty-Fifth International Joint Conference on Artificial Intelligence (IJCAI-16)
Precision Instrument Targeting via
Image Registration for the Mars 2020 Rover
Gary Doran, David R. Thompson, Tara Estlin
Jet Propulsion Laboratory, California Institute of Technology
{Gary.B.Doran.Jr,David.R.Thompson,Tara.A.Estlin}@jpl.nasa.gov
Abstract A straightforward part of making spacecraft more capa-
ble is ensuring that they take measurements of the intended
A key component of Mars exploration is the oper- targets selected by humans. For example, scientists on the
ation of robotic instruments on the surface, such as ground might identify an interesting rock in a rover’s navi-
those on board the Mars Exploration Rovers, the gation camera image and command a follow-up observation
Mars Science Laboratory (MSL), and the planned with another instrument on board. The command might spec-
Mars 2020 Rover. As the instruments carried by ify the intended target as a position in the local coordinate
these rovers have become more advanced, the area system. However, an accumulation of small errors in the esti-
targeted by some instruments becomes smaller, re- mated target position from stereo vision, the rover’s position
vealing more fine-grained details about the geol- due to slipping or thermal variations, and the instrument’s
ogy and chemistry of rocks on the surface. How- pointing due to imperfect mechanisms might lead a narrow-
ever, thermal fluctuations, rover settling or slipping, field-of-view instrument to miss the intended target. Clearly,
and inherent inaccuracies in pointing mechanisms a human on the surface of Mars would not make such a mis-
all lead to pointing error that is on the order of take; they would ensure that the target of interest from the
the target size (several millimeters) or larger. We navigation camera image was visible in the field-of-view of
show that given a target located on a previously ac- the instrument before taking a measurement.
quired image, the rover can align this with a new
image to visually locate the target and refine the The purpose of this paper is to describe a system for preci-
current pointing. Due to round-trip communication sion instrument targeting through “pointing refinement” that
constraints, this visual targeting must be done effi- is aimed at mimicking the process of a human pointing an
ciently on board the rover using relatively limited instrument at a target of interest. Instead of specifying a tar-
computing hardware. We employ existing ORB get as just a point in space, the target is also specified as a
features for landmark-based image registration, de- point within a context image. Then, a visual alignment of the
scribe and theoretically justify a novel approach to context image and the instrument’s field-of-view is used to
filtering false landmark matches, and employ a ran- verify that the instrument is pointed sufficiently close to the
dom forest classifier to automatically reject failed intended target. If not, the pointing is adjusted to bring the
alignments. We demonstrate the efficacy of our ap- instrument into alignment with the intended target. The capa-
proach using over 3,800 images acquired by Re- bility to refine pointing visually enables measurements for a
mote Micro-Imager on board the “Curiosity” rover. whole new class of small-scale features that could not be tar-
geted otherwise and are important for investigating biological
signatures or assessing a target for sample return selection.
1 Introduction Below, we describe a landmark-based image registra-
A key challenge in the operation of spacecraft on the sur- tion approach to perform precision targeting. Although our
face of other bodies in the solar system is the low-bandwidth, method can be extended to other spacecraft, we specifically
high-latency communications imposed by the extreme dis- focus on pointing refinement for the future Mars 2020 rover
tances between the spacecraft and Earth. Even at Mars, for mission, using data from the Mars Science Laboratory (MSL)
which satellites are used as relays to increase the communi- “Curiosity” rover as an analog. In particular, we focus on
cation bandwidth between rovers and Earth, there is rarely pointing refinement for the “SuperCam” instrument selected
the opportunity for more than one command uplink cycle per for inclusion on Mars 2020 [Maurice et al., 2015]. SuperCam
sol (Mars day). For future proposed missions to bodies in is an upgraded version of the ChemCam instrument on board
the outer solar system, such as the moons of Jupiter and Sat- MSL [Maurice et al., 2012; Wiens et al., 2012]. First, we
urn, communications will be even more limited. Hence, to describe a novel strategy for operating instruments with pre-
maximize the useful scientific data that is collected by these cision targeting and compare this to current operations and
missions, there is need to develop spacecraft that are more prior work. Then, we describe innovations in density-based
capable of precise measurements without direct supervision. outlier removal and classification-based post-processing that
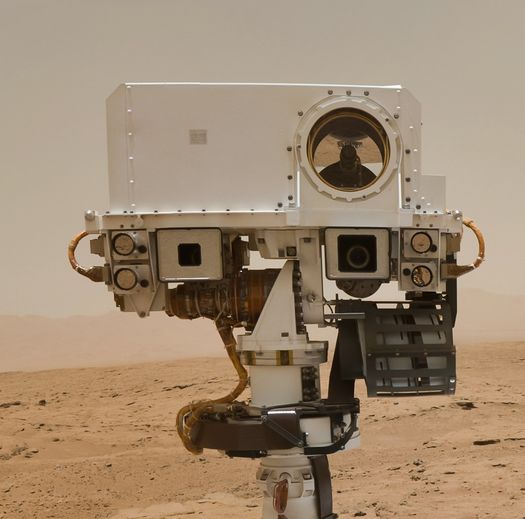
3352Figure 1: The ChemCam instru- On Sol N +1, the rover points the RMI at the best-guess lo-
ment is located on the mast of the cation of the target and acquires an image. As above, this ini-
Mars Science Laboratory “Curios- tial pointing would not hit the intended target. The rover then
ity” rover, where its large circular extracts visual landmarks from this new image and matches
aperture is visible. them with the landmarks from the Sol N image. This al-
lows the rover to map the target defined in the Sol N image
into the Sol N + 1 image, and infer that the current pointing
will not hit the intended target. Hence, the rover adjusts the
pointing accordingly to take a measurement of the intended
target, returning the data on Sol N + 1, rather than after sev-
enable fast, robust matching of challenging natural rock sur-
eral ground-in-the-loop attempts to adjust the pointing. This
faces using landmark-based image registration. Finally, we
saves at least one sol, or up to 4 attempts over 40 sols as for
demonstrate the efficacy and feasibility of the pointing refine-
McGrath, and enables other measurements that might be oth-
ment using images from MSL’s ChemCam instrument.
erwise unachievable due to time constraints or ongoing ther-
mal shifting between each command cycle.
2 Overview
The ChemCam (short for “Chemistry and Camera”) instru- 3 Related Work
ment on board the MSL rover (see Figure 1) uses a laser-
induced breakdown spectrometer (LIBS) to remotely measure There are several constraints on precision instrument target-
the composition of a rock target by firing a powerful laser at ing to make it practical for rover operations. First, because
the rock [Maurice et al., 2012; Wiens et al., 2012]. The Re- there is limited storage on board the rover, the Sol N RMI
mote Micro-Imager (RMI) within ChemCam is a telescopic image might be deleted after it is sent to Earth, and not avail-
camera with a narrow 19 mrad field-of-view, used to deter- able during subsequent sols. Thus, the visual description of
mine the context and position of the LIBS laser shot, which the intended target must be compact so that it can be uplinked
occurs near the center of the field-of-view. Figure 2 shows to the rover using limited bandwidth. Secondly, because vi-
example RMI images, with red crosshairs indicating the po- sual targeting must be performed using the relatively limited
sition of the LIBS shot. on-board rover processor (a 133 MHz RAD750), the visual
feature extraction and matching algorithms must be efficient.
A simplified example of how ChemCam is operated on
To avoid adverse impacts on the rover schedule, it is desirable
Mars is shown in the upper half of Figure 2 for a rock tar-
that the entire landmark matching process complete as fast as
get called “McGrath.” On Sol N , an RMI-only image of
possible, and run no longer than 10 minutes in the worst case.
McGrath was acquired for the purposes of carefully point-
Finally, because the RMI has such a narrow field-of-view, the
ing the LIBS laser at a vein in the image, indicated by the
algorithm must be able to handle cases when the desired tar-
blue circle. With this target identified on the ground on Sol
get is not present in the Sol N + 1 field-of-view (although
N , its position was uplinked on Sol N + 1 and a LIBS
there must be some overlap between the images).
measurement was taken. Unfortunately, the laser missed
the target, so a correction in pointing was made on Earth Considering these requirements, we can describe the ap-
on Sol N + 1 and uplinked on the next opportunity. The plicability of prior related work. A similar capability already
ground-in-the-loop pointing refinement was repeated four employed on Mars exploration rovers is visual target track-
times over a 40-sol period from Sols 185–226 (an anomaly on ing (VTT). When navigating to a target of interest, rovers use
Sol 200 limited rover operations for for a few weeks there- VTT to ensure that they are approaching the correct position
after).1 On the fourth try, a measurement of McGrath was over long autonomous drives [Kim et al., 2008]. VTT uses
successfully made and was important for understanding the normalized cross-correlation (NCC) to find the most likely
geochemistry of the region. McGrath’s analysis was fea- location of a 21-by-21 pixel template sub-image containing
tured in several scientific publications [Léveillé et al., 2014; the target in a wide field-of-view navigation camera image.
McLennan et al., 2014]. Commanding VTT requires a small uplink bandwidth and can
be efficiently performed using rover hardware. However, the
The lower half of Figure 2 shows an overview of the pro-
use of NCC with a template image requires that the target of
posed precision targeting strategy. The process begins in the
interest actually be in the field-of-view of the follow-up (Sol
same way, with an RMI image acquired on Sol N and a tar-
N + 1) image. While this is reasonable for the wide field-
get identified within that image (indicated by the blue circle).
of-view navigation cameras, this might not be the case for
However, in addition to the estimated target position in the
RMI images. Hence, this approach (or any other NCC-based
rover coordinate frame, a set of “visual landmarks” are also
approach) does not fulfill all of the requirements.
uplinked to the rover. The visual landmarks are defined by
pixel coordinates (in the Sol N image) and visual features An alternative strategy is to register the Sol N and Sol
that describe properties of the image at those locations. We N + 1 images. Given the alignment of two images, the posi-
discuss the choice of features in more detail below. tion of the target with respect to the Sol N + 1 pointing can
be inferred, even if it is not present in the field-of-view. State-
1
Some details of planning for each sol can be found under the of-the-art image registration approaches use visual landmarks
Science Operations Working Group (SOWG) documentarian notes detected and matched across a pair of images. Landmarks are
in the MSL Analyst’s Notebook [Stein, 2014]. locations in an image with associated visual features used to
3353Current Strategy Sol N Sol N + 1 ··· Sol N + k?
Mars
Earth
Visual Targeting
Mars
Earth
Figure 2: A comparison of precision targeting versus the current strategy. In both cases, an image is acquired on Mars on Sol
N and downlinked to Earth, where a target (blue circle) is identified. Currently, the best estimate of the rover-relative target
location is used to acquire a measurement on Sol N + 1. If the target is missed, a correction to pointing is made and uplinked on
the next opportunity. This process continues for k sols until the target is measured, or until the rover drives to another location
to accomplish other science objectives. In contrast, visual targeting extracts and uploads visual features along with the target
location, which are matched with visual features extracted from the Sol N + 1 image to correct pointing on board. The rover
acquires the correct measurement on Sol N + 1, saving at least one sol or enabling otherwise unachievable measurements.
uniquely describe image the at that location [Moravec, 1981]. 4 Algorithm
Landmarks are matched across two images by finding the
In this section, we describe some details of the pointing re-
nearest-neighbors of these descriptors in the feature space.
finement implementation (a schematic overview is given in
Figure 3). As its name indicates, the implementation of ORB
A successful and widely used landmark description is descriptors involves two key components: (1) the detection of
scale-invariant feature transform (SIFT), which uses a his- landmarks using the features from accelerated segment test
togram of image gradient orientations in a region surround- (FAST) detector, and (2) the computation of descriptors us-
ing the landmark [Lowe, 2004]. SIFT has been used for ing binary robust independent elementary features (BRIEF).
visual targeting with terrestrial robots [Thompson et al., The FAST detector uses a pre-trained decision tree to detect
2011]. Unfortunately, SIFT feature descriptors are large corners in an image, then uses these corners to orient the land-
(128-dimensional) and expensive to uplink, and not efficient mark (making them invariant to rotation between the two im-
to compute on board. Even subsequently developed land- ages) [Rosten et al., 2010]. The BRIEF descriptor is a binary
mark features like speeded up robust features (SURF) [Bay string, with each bit representing a comparison of pixel inten-
et al., 2006], aimed to reduce the computational complexity sities for 256 randomly selected pairs of points within a win-
of SIFT, are too expensive to compute with rover hardware. dow surrounding the landmark [Calonder et al., 2010]. Each
of these operations involves only simple numerical compar-
More recently, with an increasing interest in performing isons that can be implemented efficiently with most proces-
image registration for real-time applications using embedded sor architectures. Accordingly, ORB is at least 1–2 orders
hardware and mobile devices, even more efficient image de- of magnitude faster than SIFT or SURF, with similar perfor-
scriptors such as oriented FAST and rotated BRIEF (ORB) mance on the registration task [Rublee et al., 2011]. The 256
and binary robust invariant scalable keypoints (BRISK) were binary features can be represented as a 32-byte bit string.
developed [Rublee et al., 2011; Leutenegger et al., 2011]. In Landmarks are extracted from the Sol N image on Earth
addition to being efficient to compute, these descriptors use and uplinked to Mars. After the Sol N + 1 image is acquired
binary features, which are more compact to represent than and landmarks are extracted, the landmarks are matched
those of SIFT or SURF. A comparison of these binary feature across the two images. This step involves computing the
descriptors found that ORB was more efficient than BRISK in Hamming distance between all 32-byte feature descriptors
terms of memory usage and computational cost, with similar and finding nearest neighbors. “Cross-checking” is used so
performance [Heinly et al., 2012]. Hence, ORB best satisfies that landmark matches are only accepted if the landmarks in
the requirements and was selected for our application. the pair are mutual nearest neighbors to each other.
3354Earth Sol N Detect Landmarks and
Image Compute Features
Sol N + 1 Detect Landmarks and Match Filter Register Mapping from Sol N
Mars
Image Compute Features Landmarks Matches Images to Sol N + 1 Image
Figure 3: An overview of the pointing refinement algorithm. The steps in the top half of the figure are performed on Earth,
while those in the lower half are processed on board the Mars rover.
Although BRIEF features are designed to uniquely de- We develop a novel strategy for inlier detection using the
scribe the region of the image surrounding a landmark, there fact that because the RMI field-of-view is small in compar-
are often false positive matches between landmarks across the ison to the target distance, the relationship between two im-
two images. In fact, we observe that for images in our do- ages is roughly a translation. That is, in the decomposition of
main, often fewer than 25% of the landmark matches found H, A ⇡ I (the identity matrix), and h ⇡ 0. Our approach
between images are valid. Hence, the matches must be fil- is based on the intuition that if we take matching landmark
tered to remove these false positives. This presents a signifi- location pairs (la , lb ) and compute the difference lb la , then
cant challenge for which we propose a novel solution below. differences for inliers will all occupy a small region in the
Assuming that we have filtered out false positive landmark two-dimensional pixel space, since the translation between
matches, we can register the two images using a homogra- the two landmarks should be roughly the same for all true
phy transformation, which is a sufficient approximation since matches. On the other hand, these differences for false posi-
the rover will not have driven between the Sol N and Sol tive matches will be spread out more uniformly. Thus, all we
N + 1 images and the camera motion is a rotation (though must do is find a region with a high density of points lb la ,
the camera is slightly offset from the axis of rotation). A ho- and this region will contain the inliers (the valid landmark
mography is defined by a 3-by-3 matrix H, where for any matches). This can be accomplished using the density-based
x = (x, y) in the Sol N image pixel space, the corresponding spatial clustering of applications with noise (DBSCAN) algo-
point u = (u, v) in the Sol N + 1 image pixel space is given rithm [Ester et al., 1996]. Now, we formalize this intuition:
" # " #
u x Proposition 1. Given an image pair related by homography
by: v = ↵H y , for some scale factor ↵. Decom- H with inlier landmark density ⇢ (landmarks per pixel), there
1 1 exists a region where density of landmark difference points
A t lb la is at least:
posing H as , we can represent this relationship ⇣ ⌘2 ⇣ ⌘2
h> 1 p p
⇢ 1 2s khk kA Ik2 + 2 2s khk ,
in closed form: u = h(x) = (Ax + t) h> x + 1 . We can
solve for this 8-degrees-of-freedom homography matrix by
where s = max(width, height) of the image (in pixels).
using least-squares regression and the known matching land-
marks. The solution produces a mapping from the Sol N im- Proof. For any landmark x, consider all other landmarks in
age to the Sol N +1 image, allows the position of the target to a sphere of radius ✏ centered around x. Then each of these
be identified with respect to the current pointing, and reveals landmarks can be written as x + for with k k ✏.
if it is necessary to adjust the instrument pointing. We will show that the landmark differences [h(x) x] and
To return to addressing the problem of false matches, [h(x + ) (x + )] are all in a sphere of ✏0 , so the density
random sample consensus (RANSAC) is traditionally used ⇡✏2
of these difference points is ⇢0 = ⇢ ⇡✏ ✏2
0 2 = ⇢ ✏0 2 . Now, we will
for this purpose while simultaneously finding the homogra- bound ✏0 by bounding:
phy transformation (hence the dashed feedback loop between
these two steps illustrated in Figure 3) [Fischler and Bolles, k k = k(h(x + ) (x + )) (h(x) x)k
1981]. RANSAC works by selecting from the matches a A (x + ) + t Ax + t
random subset of the minimum size required to fit a model =
h> (x + ) + 1 h> x + 1
(four for a homography). Then, the remaining landmarks are
Ax+t
mapped into the new image using this homography transfor- (A I) h> (x + ) h> h> x+1
mation, and those that end up close to their corresponding =
h> (x + ) + 1
matching landmarks are considered inliers. This process is re-
peated until a solution with a large fraction of inliers is found. k(A I) k + h> (x + ) k k + h> kh(x)k
Unfortunately, as described above, fewer than 25% of land- h> (x + ) + 1
mark matches are inliers in many cases. Thus, the probability k(A I) k + khk kx + k k k + khk k k kh(x)k
that all four samples selected by RANSAC are inliers in a
given iteration is less than 0.254 0.4%. To be 99% sure h> (x + ) + 1
that the correct solution is found, over 1, 000 RANSAC itera- k(A I) k + khk k k (kx + k + kh(x)k)
= ,
tions would be required, which is computationally infeasible. h> (x + ) + 1
3355where the first inequality follows from the triangle inequality, Figure 4: An example
and the second follows from the Cauchy–Schwartz inequality. of successful registra-
Then, by the definition of the spectral norm k(A I) k tion under significant
kA Ik2 k k. Using this along with Cauchy–Schwartz in illumination changes.
the denominator and that h> (x + ) h> (x + ): A merged image is at
the bottom. The ap-
kA Ik2 k k + khk k k (kx + k + kh(x)k) pearance of the tex-
k k
1 khk kx + k tured surface varies
kA Ik2 + khk (kx + k + kh(x)k) with illumination an-
✏ . gle. There are three
1 khk kx + k Mars hours of dif-
Now, observe that x, x + , and h(x) are all landmarks in ference between the
one of the two images, and therefore must be contained
p in the images.
bounds of the images. So their norms are at most 2s:
⇣ p ⌘.⇣ p ⌘
k k ✏ kA Ik2 + 2 2s khk 1 2s khk . range of the images sizes. Finally, we use ✏ and m parameters
selected for DBSCAN and the number of landmark pairs ul-
Finally, ✏0 is bounded by k k, so substituting this inequal- timately used to produce the homography matrix as features.
ity into the expression for the density of landmark difference Given these seven features, we train a random forest classi-
2
points, ⇢ ✏✏0 2 , gives the inequality in the proposition. fier [Breiman, 2001] to evaluate whether the registration was
successful. We describe the training and evaluation of this
Intuitively, Proposition 1 tells us that as A ! I and h ! 0,
classifier in the following section.
the density of landmark difference points becomes increas-
ingly large. In fact, in the limiting case when the images are
related only by a translation, the landmark difference points 5 Evaluation
are all co-located and thus occupy a region of infinite density. To evaluate the ability of our proposed precision targeting ap-
For comparison, differences of randomly matched landmark proach to identify targets in an RMI image and to characterize
points (false positives) will have a density of at most ⇢, so the the factors that affect its performance, we used over 3,800
region of true matches will have a much higher density than images acquired by the MSL rover during the first 1,200
this when kA Ik2 and khk are small. Proposition 1 also sols of operation.2 Using metadata that includes the instru-
shows that while the assumption of a near-translation might ment pointing, we identified over 16,500 pairs of images that
be insufficient for precise image registration, it can be suffi- should overlap by less than the 19 mrad field-of-view. We are
cient for the purposes of filtering outliers. interested in evaluating how two factors affect performance:
To find the high-density region of landmark match differ- (1) initial pointing accuracy and (2) changes in illumination
ences, DBSCAN uses two parameters: a neighborhood size ✏ conditions between the Sol N and Sol N + 1 images (as in
and minimum number of neighbors m for a point to be an in- Figure 4). First, we describe several implementation details.
lier [Ester et al., 1996]. Rather than pick fixed parameters, To implement the precision targeting algorithm described
we use a schedule of increasingly permissible parameters: above, we used the OpenCV implementation of ORB feature
(✏, m) = {(6, 8), (7, 7), (8, 6), (9, 5), (10, 5), (11, 5)}. We extraction and RANSAC-based homography finding [Brad-
iteratively run DBSCAN with the parameters until a high- ski, 2000; Rublee et al., 2011]. A random forest with 100
density region is found and then stop. We terminate unsuc- trees was used to classify the homographies produced by the
cessfully if no high-density region is found after all param- process in Figure 3. To train the random forest classifier, we
eter sets are explored. Upon successful termination, we ex- analyzed the roughly 16,500 alignments produced by our al-
clude all outlier matches as determined by DBSCAN and use gorithm using 2,500 landmarks. We used the noisy “ground
RANSAC to find the final homography between images. truth” RMI metadata to identify obviously successful cases
Finally, because spacecraft operations are extremely risk when more than 150 landmark pairs made it past the filters
averse, we must build in safeguards to mitigate any errors and the offset was within 2 mrad of the reported pointing
made during image registration. Even if the registration is discrepancy between the two images. Similarly, we selected
successful 99% of the time, we must ensure that the 1% fail- cases for which less than 10 landmark pairs were found and
ure cases will not lead to a re-pointing that will cause harm the estimated discrepancy was more than 20 mrad off from
to the spacecraft. A failure can occur for several reasons; for what was reported. Other cases were ambiguous due to small
example, there might not be any overlap between the Sol N errors in reported pointing, so these were labeled manually.
and N + 1 images, or there might be too few matching land- The resulting classifier has a 97% true-positive rate at a
marks between the images if the region of overlap is small. 0.5% false-positive rate (using the properly-selected thresh-
Thus, we employ a classifier to automatically detect when a old) as estimated using the labels on the training examples
registration failure has occurred. when they are left out of bootstrap samples. The kA Ik2 ,
To evaluate the homography H produced by our algorithm, khk, and number of landmark matches after filtering turn out
we use several features. First, guided by Proposition 1, we
use kA Ik2 and khk as features. We also use the transla- 2
Images are made publicly accessible online via the Planetary
tions tx and ty as features, since these should be within the Data System [Wiens, 2013].
3356Uplink Requirement (kbits)
0 200 400 600 800 1000
100 100 100
Successful Alignments (%)
Successful Alignments (%)
Successful Alignments (%)
80 80 80
60 60 60
40 40 40
20 20 20
0 0 0
500 1500 2500 3500 0 20 40 60 80 100 0 30 60 90 120 150 180
Landmarks Image Overlap (%) Illumination Angle Difference (degrees)
Figure 5: Performance as a function of three factors: (left) the number of landmarks initially extracted from the images (and
therefore the amount of information that must be uplinked to the spacecraft), (center) the amount of overlap between the Sol
N and N + 1 images, and (right) the difference in illumination angle between the images.
to be the most important features as determined by their fre- cur within a consistent block of time each sol, when illumi-
quency of use within the random forest. In fact, over 96% nation conditions are similar.
of the manually identified correct alignments are such that Finally, we have implemented a C++ version of our pre-
the density of landmark differences are greater than the back- cision targeting algorithm, with running times of less than
ground density of randomly matched landmark differences as 1 minute with over 3,500 landmarks on a 150 MHz LEON4
determined by the expression in Proposition 1. This observa- processor, which is comparable to the processing capability
tion justifies the use of DBSCAN to filter matches. of the rover’s on-board processor. Thus, the results indicate
Given the trained classifier, we can now determine the es- that our approach satisfies the requirements for operation.
timated success rate when different numbers of landmarks
are used, as shown in Figure 5 (left). The algorithm was re-
run with different numbers of landmarks ranging from 50 to
3,500. The corresponding uplink requirement (in kilobits) is
6 Conclusion
illustrated along the top of the figure. These results show
that good performance can be achieved with a reasonable up- In this paper, we present an image-registration-based ap-
link budget of several hundred kilobits. The remainder of the proach for precise instrument targeting on board the Mars
results use 2,500 landmarks, where the pointing refinement 2020 rover. We demonstrate using real data from the MSL
approaches its asymptotic performance. rover that given consistent lighting conditions (within 1–2
To evaluate how initial pointing accuracy and lighting con- Mars hours) and at least 33% overlap between images, our
ditions affect performance, we use two measurements avail- method can correctly identify the target location specified in
able via the image metadata. The initial pointing accuracy the first image within the second image in over 80% of cases.
is related to how much overlap there is in the fields of view Each of these 80% success cases translates to time saved or
of the two images, which is related to how much the point- a new capability to target small features relevant to astrobiol-
ing differs between these images. Let be the angular dif- ogy and sample return selection. For the remaining cases, we
ference in pointing between the two images expressed as a employ a classifier to reject failed image alignments and fail
fraction of the instrument field-of-view (19 mrad). Then the safe by falling back to the default strategy of measuring the
area of overlap, as target at the best-guess location coordinates.
h a fraction of the
p
circularifield-of-view area,
is: foverlap = ⇡ arccos( )
2
1 2 . Figure 5 (center) Though the analysis in this work is targeted for the Super-
Cam instrument, there are other instruments selected for the
shows the registration performance as a function of this quan- Mars 2020 rover that would benefit from such technology.
tity. The success rate of the approach is stable above 80% For example, the Planetary Instrument for X-Ray Lithochem-
after there is roughly 33% overlap between the images. istry (PIXL) [Allwood et al., 2014] and the Scanning Habit-
Finally, we evaluate the effects of changing illumination able Environments with Raman & Luminescence for Organ-
conditions between images. The solar illumination azimuth ics & Chemicals (SHERLOC) [Beegle et al., 2015] instru-
and elevation angles at the time the image was taken are also ment have small fields-of-view and are located on the rover’s
included in the image metadata. The average success rate arm, which is also subject to thermal and mechanical errors
binned by illumination angle difference is shown in Figure 5 in placement. In addition to investigating the use of point-
(right). The results suggest that the algorithm is sensitive to ing refinement for other instruments like PIXL, we are ex-
illumination changes exceeding 60 deg, likely because shad- ploring cross-camera pointing refinement, so that the image
ows formed by textured rock surfaces can vary drastically acquired from one instrument or engineering camera can be
with lighting angle (see Figure 4), making it challenging to used to refine the pointing of another instrument, reducing the
find corresponding landmarks. However, this challenge is downlink requirement and further increasing the efficiency of
mitigated by the fact science operations on Mars typically oc- making valuable scientific measurements.
3357Acknowledgments [Léveillé et al., 2014] R. J. Léveillé, J. Bridges, R. C. Wiens,
We would like to thank Raymond Francis, Daniel Gaines, N. Mangold, A. Cousin, N. Lanza, O. Forni, A. Ollila,
Vandi Verma, and Roger Wiens for feedback they provided J. Grotzinger, S. Clegg, et al. Chemistry of fracture-
during the development of this work. This research was car- filling raised ridges in Yellowknife Bay, Gale Crater: Win-
ried out at the Jet Propulsion Laboratory, California Institute dow into past aqueous activity and habitability on Mars.
of Technology, under a contract with the National Aeronau- Journal of Geophysical Research: Planets, 119(11):2398–
tics and Space Administration. Copyright 2016 California 2415, 2014.
Institute of Technology. U.S. Government sponsorship ac- [Lowe, 2004] D. G. Lowe. Distinctive image features from
knowledged. scale-invariant keypoints. International Journal of Com-
puter Vision, 2004.
References [Maurice et al., 2012] S. Maurice, R. C. Wiens, M. Saccoc-
[Allwood et al., 2014] A. Allwood, J. Hurowitz, L. Wade, cio, B. Barraclough, O. Gasnault, O. Forni, N. Mangold,
D. Baratoux, S. Bender, G. Berger, et al. The ChemCam
R. Hodyss, and D. Flannery. Seeking ancient microbial
instrument suite on the Mars Science Laboratory (MSL)
biosignatures with PIXL on Mars 2020. In American Geo-
rover: science objectives and mast unit description. Space
physical Union Fall Meeting Abstracts, volume 1, 2014.
Science Reviews, 170(1-4):95–166, 2012.
[Bay et al., 2006] H. Bay, T. Tuytelaars, and L. van Gool. [Maurice et al., 2015] S. Maurice, R. C. Wiens, R. Ander-
SURF: Speeded up robust features. In Proceedings of the son, O. Beyssac, L. Bonal, S. Clegg, L. DeFlores, G. Dro-
European Conference on Computer Vision, 2006. mart, W. Fischer, O. Forni, et al. Science objectives of
[Beegle et al., 2015] L. Beegle, R. Bhartia, M. White, L. De- the supercam instrument for the mars2020 rover. In Lunar
Flores, W. Abbey, Y.-H. Wu, B. Cameron, J. Moore, and Planetary Science Conference, volume 46, page 2818,
M. Fries, A. Burton, et al. SHERLOC: Scanning habitable 2015.
environments with Raman & luminescence for organics & [McLennan et al., 2014] S. McLennan, R. Anderson, J. Bell,
chemicals. In Proceedings of the IEEE Aerospace Confer- J. Bridges, F. Calef, J. Campbell, B. Clark, S. Clegg,
ence. IEEE, 2015. P. Conrad, A. Cousin, et al. Elemental geochemistry of
[Bradski, 2000] G. Bradski. The OpenCV library. Dr. sedimentary rocks at Yellowknife Bay, Gale crater, Mars.
Dobb’s Journal of Software Tools, 2000. Science, 343(6169):1244734, 2014.
[Breiman, 2001] L. Breiman. Random forests. Machine [Moravec, 1981] H. P. Moravec. Rover visual obstacle
learning, 45(1):5–32, 2001. avoidance. In Proceedings of the International Joint Con-
[Calonder et al., 2010] M. Calonder, V. Lepetit, C. Strecha, ference on Artificial Intelligence, pages 785–790, 1981.
and P. Fua. BRIEF: Binary robust independent elementary [Rosten et al., 2010] E. Rosten, R. Porter, and T. Drum-
features. In Proceedings of the European Conference on mond. Faster and better: A machine learning approach to
Computer Vision, pages 778–792, 2010. corner detection. IEEE Transactions on Pattern Analysis
and Machine Intelligence, 32(1):105–119, 2010.
[Ester et al., 1996] M. Ester, H.-P. Kriegel, J. Sander, and
X. Xu. A density-based algorithm for discovering clus- [Rublee et al., 2011] E. Rublee, V. Rabaud, K. Konolige, and
ters in large spatial databases with noise. In Proceedings G. Bradski. ORB: an efficient alternative to SIFT or SURF.
of the International Conference on Knowledge Discovery In Proceedings of the IEEE International Conference on
and Data Mining, 1996. Computer Vision, 2011.
[Fischler and Bolles, 1981] M. A. Fischler and R. C. Bolles. [Stein, 2014] T. Stein. The MSL analyst’s notebook. https://
Random sample consensus: a paradigm for model fitting an.rsl.wustl.edu/msl/mslbrowser/, 2014. NASA Planetary
with applications to image analysis and automated cartog- Data System.
raphy. Communications of the Association for Computing [Thompson et al., 2011] D. R. Thompson, D. S. Wetter-
Machinery, 1981. green, and F. J. C. Peralta. Autonomous science dur-
[Heinly et al., 2012] J. Heinly, E. Dunn, and J.-M. Frahm. ing large-scale robotic survey. Journal of Field Robotics,
Comparative evaluation of binary features. In Proceedings 28(4):542–564, 2011.
of the European Conference on Computer Vision, 2012. [Wiens et al., 2012] R. C. Wiens, S. Maurice, B. Barra-
[Kim et al., 2008] W. S. Kim, J. J. Biesiadecki, and K. S. Ali. clough, M. Saccoccio, W. C. Barkley, J. F. Bell III, S. Ben-
der, J. Bernardin, D. Blaney, J. Blank, et al. The ChemCam
Visual target tracking on the mars exploration rovers. In
instrument suite on the Mars Science Laboratory (MSL)
Proceedings of the 9th International Symposium on Ar-
rover: Body unit and combined system tests. Space Sci-
tificial Intelligence, Robotics, and Automation in Space,
ence Reviews, 170:167–227, 2012.
2008.
[Wiens, 2013] R. C. Wiens. MSL ChemCam remote micro-
[Leutenegger et al., 2011] S. Leutenegger, M. Chli, and R. Y.
imaging camera raw data. https://pds.jpl.nasa.gov/ds-
Siegwart. BRISK: Binary robust invariant scalable key- view/pds/viewDataset.jsp?dsid=MSL-M-CHEMCAM-
points. In Proceedings of the IEEE International Confer- RMI-2-EDR-V1.0, 2013. NASA Planetary Data System.
ence on Computer Vision, 2011.
3358You can also read