PRELIMINARY RECOMMENDATIONS REGARDING OPTIMAL FUNDING - Nevada Commission on School Funding
←
→
Page content transcription
If your browser does not render page correctly, please read the page content below
Submitted to the Governor and the Nevada State Legislature on April 23, 2021
                                                     Amended April 30, 2021

      PRELIMINARY
 RECOMMENDATIONS
REGARDING OPTIMAL
          FUNDING
      Nevada Commission on School Funding
Nevada Commission on School Funding
Preliminary Recommendations Regarding Optimal Funding
Contents
Commission on School Funding ..............................................................................................................................2
Membership ...........................................................................................................................................................2
EXECUTIVE SUMMARY ......................................................................................................................................3
Optimal Funding Definition and Progression ....................................................................................................3
Process ...................................................................................................................................................................3
Revenue Sources ...................................................................................................................................................3
Optimal Funding Levels.......................................................................................................................................3
Funding Scenarios ................................................................................................................................................4
Conclusion .............................................................................................................................................................4
INTRODUCTION ....................................................................................................................................................5
OPTIMAL FUNDING DEFINITION AND PROGRESSION.............................................................................5
Optimal Funding Progression Recommendations .............................................................................................7
TARGETS AND REVENUE GENERATION.......................................................................................................8
Recommendation Development ...........................................................................................................................8
Consideration of Funding Sources ......................................................................................................................8
Property Tax .....................................................................................................................................................9
Sales and Use Tax ...........................................................................................................................................10
Funding Targets .................................................................................................................................................10
Funding Alternatives to Achieve Target Funding Levels ...............................................................................14
CONCLUSION AND NEXT STEPS ....................................................................................................................17
1Nevada Commission on School Funding
Preliminary Recommendations Regarding Optimal Funding
Commission on School Funding
Membership
Dr. R. Karlene McCormick-Lee, Chair
Guy Hobbs, Vice Chair
Dusty Casey
Andrew J. Feuling
Jason Goudie
Dr. Dave Jensen
Paul Johnson
Mark Mathers
Punam Mathur
Jim McIntosh
Dr. Lisa Morris Hibbler
2Nevada Commission on School Funding
Preliminary Recommendations Regarding Optimal Funding
EXECUTIVE SUMMARY
Optimal Funding Definition and Progression
The Commission developed consensus-driven recommendations reflecting extensive public input, information
from subject matter experts, and identified core implementation principles for the PCFP of equity, transparency,
accountability, and flexibility. These principles were the foundation for the Optimal Funding progression
including the definition, measures, and funding levels for restoration, adequate, and optimal. (Pages 5-8)
Process
1. The Commission considered pathways to evolve Nevada’s education funding from its current levels
to improved levels of funding adequacy and efficacy and, through those steps, toward funding
optimality. This required a multi-step process that included the identification of target funding levels
that are in keeping with the stated objectives and funding opportunities that may enable achievement
of those objectives. (Page 8)
2. The Commission chose to approach the task of identifying the potential revenue sources required to
meet target funding levels through a tax reform or restructuring lens. (Pages 10-11)
3. The Commission adopted the following key principles – in order of priority - to guide discussions
and future decisions: Sufficiency, Stability/Predictability, Competitiveness, and Horizontal and
Vertical Equity (Page 9)
Revenue Sources
1. Revenue sources that best satisfy the principles above would be the property tax and sales/use tax
systems. (Page 10)
a. Although nearer-term focus is upon the broader-based property and sales tax sources, there is
a recognition that as the assembly of a funding strategy for the ensuing decade continues,
blending an array of funding sources may be required to meet the overall funding objectives.
(Page 10)
2. Property Tax: Offers the most promising, predictable, and sufficient funding source available. The
Commission focused its attention upon the property valuation side of the equation with particular
emphasis upon the application of depreciation and the imposition of abatements. (Pages 10 - 12)
3. Sales Tax: Broadening the sales tax base would create benefits beyond the opportunity to increase
revenue, including creating a base that would be far less dependent upon certain areas of trade –
which we know to be economically susceptible to fluctuations – carrying a disproportionate load.
(Pages 10, 12-13)
Optimal Funding Levels
Restoration: Restore funding to the baseline of 2019-21 budgeted dollars to include inflation and enrollment, as
well as the NDE reductions determined in the 31st Special Session. (Page 7)
Adequate: A rational metric for the enhanced funding for Nevada K-12 education may be steady progression
toward per pupil spending between the national average and the 2018 Augenblick, Palaich & Associates (APA)
recommendations adjusted for inflation. (Page 13)
2020 Nevada Per Pupil Funding - $9,249 (Page 14)
2020 National Average Per Pupil Funding - $12,645 (Page 14)
2020 Subject Matter Expert Recommended Funding - $14,337 (Page 14)
Optimal: SB 543 allows for the Commission to identify “optimal funding” for K-12 education. While the
amounts noted above do not represent optimal funding, they do identify target funding levels along a progression
leading to Optimal Funding. (Page 14)
3Nevada Commission on School Funding
Preliminary Recommendations Regarding Optimal Funding
Funding Scenarios
The capacity of existing tax sources would suggest there is ample room within those systems that are already in
place to address the identified needs. Given that a premium is placed upon revenue sufficiency, predictability, and
equity, the roster of potential funding sources also shrinks. (Pages 15-18)
Conclusion
Over the course of 2021, the Commission will continue to examine the details regarding the property and sales tax
base and exemptions in order to make more refined and specific recommendations for Optimal Funding revenue
generation. (Pages 23-24)
4Nevada Commission on School Funding
Preliminary Recommendations Regarding Optimal Funding
INTRODUCTION
The 11-member Nevada Commission on School Funding (the Commission) held its first meeting on September
27, 2019. In accordance with Senate Bill (SB) 543 (2019), Section 11, the Commission recommended:
• a definition for the optimal level of funding for Nevada education,
• monetary targets for funding, and
• revenue sources to fully fund the optimal level within ten (10) years.
The Commission grappled with many aspects of the Pupil-Centered Funding Plan (PCFP) and school funding.
Clearly defining the term Optimal Funding is critical since it outlines the strategic investment, financial fuel, and
performance indicators necessary to sustain a system of education that is among the best in the nation. The
Commission challenged itself to create a definition that was inclusive of all Nevada’s students, clear in intent, and
measurable, as well as that outlined a progression from the current funding level toward optimal funding. The
Commission benefitted from the assistance of subject matter experts who provided bodies of research and
information from peer states that have calculated the cost of educational support levels and implemented pupil-
centered funding methodologies.
The Commission developed consensus-driven recommendations regarding optimal funding in accordance with the
provisions of SB 543. The recommendations reflect extensive public input, information from subject matter
experts, and robust deliberations among Commission members who each bring unique experience and perspective
to the work. Early in its work, the Commission identified core implementation principles for the PCFP of equity,
transparency, accountability, and flexibility. Those principles were also the foundation for the recommendations
that are detailed in this report:
1. Optimal funding achieved by meeting a progression of input and output targets.
2. Funding targets quantified in current dollars with annual aspirational monetary goals.
3. Revenue generation focused primarily on tax reform with property and sales tax at the center.
These preliminary recommendations are intended to facilitate a strategic investment that will lead, for all Nevada
students, to exemplary student achievement on par with the nation's best performance.
Bringing K-12 education funding in Nevada to an optimal level will require a significant and ongoing
commitment – both in terms of political will and the investment of necessary resources. The Commission is
keenly aware of the enormity of this task, while recognizing the anticipated negative consequences of ongoing
inaction and underinvestment in education. There is no shortage of needs across the spectrum of programs and
agencies competing for funding each year with few revenue sources that are sufficient, predictable, and equitable
that also keep Nevada competitive in attracting businesses and residents. Still, no program or service offered by
any institution can eclipse the importance of providing all of Nevada’s children with equitable access to high-
quality learning opportunities.
OPTIMAL FUNDING DEFINITION AND PROGRESSION
To address Optimal Funding, the Commission developed a conceptual, operational, and measurable definition. In
Nevada, Optimal Funding is defined conceptually as:
• The per-pupil funding that enables the State's schools and districts to uniformly and equitably
provide resources and services designed to produce exemplary student performance on par with
the nation’s best.
• A strategic investment to intensify the use of effective practice recommendations contained in
the State Improvement Plan, leading to exceptional achievement for all Nevada students.
Rather than assigning a dollar amount to the definition, the Commission created a roadmap – a plan of
implementation that can evolve from current funding levels to Adequate Funding with the goal of attaining an
5Nevada Commission on School Funding
Preliminary Recommendations Regarding Optimal Funding
Optimal Funding level in the next ten (10) years. As noted, SB 543 contemplated a plan that would fund identified
needs over a ten-year period and recognizes that movement from current funding levels to adequate or optimal
levels will require a phased approach. Achieving optimal levels of funding – when compared to current funding –
will require a significant commitment on the part of the State over the next several sessions of the Nevada
Legislature. Given the limitations of existing revenues and competing demands, a steady progression toward
optimal funding increases the chances of long-term sustainability. Progress toward optimal will need to be
coupled with accountability and assurances that the investments made along the way are working as intended to
produce improved student opportunities and outcomes.
The progression addresses (1) the initial restoration of funds to the original FY 2019-21 budgeted levels, (2)
increase to adequate funding as recommended by the 2006 and 2018 Augenblick, Palaich & Associates (APA)
studies, and (3) the determination of the requisite optimal investment in practices and resources required for all
Nevada students to perform on par with the nation’s best. Table 1 outlines the fundamental elements for the three
levels of funding progression, culminating in Optimal Funding.
Optimal Funding Progression (Table 1)
Element Restoration Adequate Optimal
Definition Sufficient to bring funding to Sufficient for all students to meet Sufficient for strategic
previous baseline level set State standards and statutory investment in practices,
during the 2019 Legislative requirements resources, and services
Session, prior to cuts made to aligned with Nevada's 5-
the COVID-19 public health year renewable strategic
and economic crisis plan resulting in exemplary
student performance.
Measurement • Meet total funding per • Allocate per-pupil that is • Total funding per
local education agency at between the national average student per year plus
the legislatively approved and the adequate base inflation aligned to
budget in the 2019-21 funding amount identified in local education agency
biennium the APA report plus inflation, (LEA) expenditures.
• Set the baseline for and meeting the identified • Implementation status
performance on student aspirational weights and for uniform and
outcomes reported to related legal requirements equitable practices,
State and/or federal • Meet all State and federal resources, and
entities in 2019-20 standards including: services as necessary to
o Achieving student support the State
performance benchmarks Improvement Plan
o Providing required courses (STIP)
and content standard • Meet the student
instruction, performance goals
o Meeting class size and outlined in the STIP.
teacher evaluation • The federal and State
requirements funding for Special
o Developing required plans; Education is sufficient
and to require no dollars be
o Supporting interventions spent from LEA
related to Read By 3, general fund.
Graduation, and student
IEP requirements.
Funding • Restore to the baseline of • APA professional judgement • Cost estimates to
Level 2019-21 budgeted dollars per-pupil base (priority) + implement strategic
+ inflation, + enrollment fully funded target weights + investments associated
growth, + NDE increased total amount for with targeted student
reductions Special Education allocations outcomes adjusted for
6Nevada Commission on School Funding
Preliminary Recommendations Regarding Optimal Funding
Element Restoration Adequate Optimal
• Funds to support NDE in (separate dedicated student enrollment
a process, performance, mechanism for special growth and inflation.
and change management education comprised of LEA • Funds to conduct a
review and SEA “costing out” study
components) inflation + using the professional
enrollment growth + All judgement approach
districts total allocations are and analysis of actual
above the 2019-20 budgeted expenditures
level + NDE at adequate
level
Optimal Funding Progression Recommendations
The resulting recommendations were developed over the course of multiple Commission meetings based on
presentations, public comment, and PCFP model analysis. In order to achieve Optimal Funding within the ten-
year timeline as outlined in SB 543, the Commission recommends the following:
Restore Level:
• Timeframe: Within the biennium beginning July 2021
1. Restore funding to the original budgeted amount legislatively approved in the 2019-21 regular
session, adjusted for inflation and enrollment to all districts and charter schools as well as the
NDE reductions determined in the 31st Special Session.
2. Allocate funds to support NDE in a process, performance, and change management review to
ensure transition and efficiencies when moving to a full implementation of the PCFP.
Adequate Level:
• Timeframe: Within the next four (4) biennia
1. Fund the State Education Account/Fund at a level to provide adequate per-pupil base with target
weights fully funded based on the APA study adjusted for inflation and student enrollment.
2. Fund Special Education at a level sufficient to allow all districts to meet related legal
requirements.
3. Allocate sufficient funds to ensure that all districts are funded above the 2019-20 budgeted
levels adjusted for inflation and enrollment growth.
4. Allocate funds to increase NDE staffing to a level commensurate with the average staffing for
other SEAs considering student enrollment, State demographics, and district structures.
Optimal Level:
• Timeframe: Within the biennium beginning July 2023 for the study funds and within the next
five (5) biennia and beyond for Optimal Funding Revenue Generation.
1. Allocate funds to conduct a “costing out” study using the professional judgement approach and
analysis of actual expenditures to determine the investment required for districts, charters, and
NDE to offer the resources, supports, and services necessary to meet the input requirements and
output targets in the Nevada Statewide Plan for the Improvement of Pupils (STIP). The study
would address the constitutional requirement for a "uniform system of schools" by aligning
instructional resources, supports, and services across as well as within school districts.
7Nevada Commission on School Funding
Preliminary Recommendations Regarding Optimal Funding
2. Fund the State Education Account/Fund at a level that will enable ALL districts to offer the
associated practices, resources, and services necessary to produce the identified achievement
outcomes outlined in the STIP.
TARGETS AND REVENUE GENERATION
Senate Bill 543 authorized the Commission on Education Funding (the Commission) to identify optimal funding
for education and, if such a target were identified, to also recommend a method of achieving the target funding
level over the course of ten (10) years. Within the progression, there are logical and incremental steps between
current funding levels and the achievement of Optimal Funding. Also, the Commission considered pathways to
evolve Nevada’s education funding from its current levels to improved levels of funding adequacy and efficacy
and, through those steps, toward funding optimality. This required a multi-step process that included the
identification of target funding levels that are in keeping with the stated objectives and funding opportunities that
may enable achievement of those objectives. This section summarizes the process that the Commission
undertook, and its recommendations with respect to funding targets and funding alternatives.
Recommendation Development
The Commission chose to approach the task of identifying the potential revenue sources required to meet target
funding levels through a tax reform or restructuring lens. Rather than identify a new funding source, increasing
current tax rates, or targeting single industry taxes, the Commission preferred to examine the Nevada tax system
as a means of adjusting the way taxes are collected or managed, improving the efficiency of the tax base, and
maximizing the economic and social benefits.
As a critical first step to this process, the Commission identified characteristics and attributes of various taxation
approaches. Among the attributes discussed and considered were economic neutrality, flexibility, integration,
simplicity, ease of administration, exportability, uniformity, transparency, sufficiency, horizontal and vertical
equity, predictability, stability, and political palatability. As a result, the Commission adopted the following key
principles – in order of priority - to guide discussions and future decisions regarding revenue sources:
1. Sufficiency - The ability of the realized revenue to sufficiently fund targeted expenses.
2. Stability/Predictability - The ability of the tax to produce consistent and/or expected revenue in
the face of changing economic circumstances over time.
3. Competitiveness - Maintaining a reasonable competitive balance with bordering states.
4. Equity - Horizontal & Vertical - Individuals with similar wealth should pay about the same
amount in taxes and those individuals with the ability to pay more taxes should contribute more.
Consideration of Funding Sources
The revenue source characteristics and principles prioritized by the Commission were in the forefront of
consideration as a variety of funding alternatives were introduced. From the outset, the Commission chose to
focus attention upon revenue sources already relied upon in Nevada to fund public programs and services. The
rationale for this approach was a recognition that existing revenue sources represent accepted funding
methodologies. As such, identifying additional capacity within these sources was a logical step prior to exploring
new funding regimes that may be less politically palatable. The sources initially explored included a wide array of
funding options. Given that revenue sufficiency was viewed by the Commission as a primary objective, other
traditional funding sources that would produce insufficient revenues to support optimal education funding were
excluded from consideration. The focus remained on those revenue sources that could meet the sufficiency
threshold: property (ad valorem) taxes, sales and use tax, business taxes, gaming tax, and mining tax. The
Commission raised the following concerns:
• The stability and predictability of certain sources – particularly the industry-specific taxes that
are subject to economic volatility;
8Nevada Commission on School Funding
Preliminary Recommendations Regarding Optimal Funding
• Business-specific tax sources may prove to be problematic as primary education funding sources
due to exposing the funding sources to periodic economic cycles and further exacerbated by
conditions created by the COVID-19 pandemic;
• Equity between and among certain clusters of taxpayers; and
• Designing a balanced revenue portfolio for the ensuing decade may require blending and
expanding reliance on an array of funding sources to meet the overall funding objectives.
Via thorough and lengthy deliberations, the Commission determined that a nearer-term focus on broader-based
property tax and sales/use tax systems would best satisfy the adopted revenue principles. Therefore, the
Commission’s identification process for sufficient, predictable, and equitable funding sources concentrated on
existing sales and use tax and upon property (ad valorem) taxes.
Property Tax
Property tax in Nevada is determined by multiplying the assessed valuation of property (divided by one hundred)
times the combined ad valorem tax rate for the taxing districts in which the property is located. Thus, it is the
product of the assessed valuation and the applicable overlapping tax rate.
Tax rates are governed by both the Nevada Constitution and Nevada Revised Statutes. Simply put, the
Constitution places limitation of no more than $5.00 per $100 of assessed valuation upon the combined property
tax rate levied against property. This is further constrained by a statutory limit of no more than $3.64 per $100 of
assessed valuation. Considering levies outside of the statutory limit, the upward limit of combined ad valorem
rates stands at no more than $3.66 per $100 of assessed valuation. There are several units of government -
particularly in the less urbanized parts of the State – that exhibit combined tax rates equal to (or near) the $3.66
cap. Thus, while there may be headway within the Constitutional cap of $5.00, no room exists above the $3.66
combined rate (on a Statewide basis) as currently defined in statute.
Further limiting ad valorem tax revenue opportunities is the impact of property tax limitations known as the
“abatements.” The abatements serve to limit the growth of a taxpayer’s property tax obligation from year to year
by imposing an upward growth limit of three percent for owner-occupied residential property and eight percent
for non-residential property. Beyond these limits, there are also secondary calculations that may further limit the
growth in property tax bills from year to year. Application of the abatement limitations from year to year result in
realized property tax revenue that – even if the tax rate is held constant – lags well behind the growth in actual
assessed valuation. In application, growth in property tax revenue may also lag the growth allowed by the three
and eight percent abatement limits. The result is that a penny of property tax is no longer worth a penny of
property tax. A more meaningful result is that for those local governments (including school districts) that depend
upon property tax, the yield is far less than it was prior to the imposition of the abatement laws. While taxpayers
enjoy constrained property tax bills, local governments and school districts must contend with growth in revenue
that is less than the growth in the cost of providing services.
On the property assessment side of the equation, Nevada assesses property at the full cash value of the land plus
the replacement cost of the improvements to the land (depreciated by 1.5 percent per year for 50 years, to a
residual value of 25 percent of replacement cost). Note here that the value of the improvements is determined by
replacement cost – not by market value. Note also that the replacement cost is depreciated each year, further
increasing the gap between market value and replacement cost. Nevada is the sole state in the country that applies
a depreciation factor in valuing property for taxation.
Inherent to the explanation above is a recognition that Nevada does not align the value of property for taxation
with the actual or market value of the property. Nevada’s system necessarily results in property valuations that are
markedly less than the true or market value of the property.
Given the above, the Commission focused its attention upon the property valuation side of the equation with
particular emphasis upon the application of depreciation and the imposition of abatements. The mere fact that one
of the largest sources of annual funding for schools is derived from the application of the $0.75 per $100 of
9Nevada Commission on School Funding
Preliminary Recommendations Regarding Optimal Funding
assessed valuation operating rate across all school districts in the State necessitates that this funding source be
examined for improved application. Beyond the $0.75 tax rate imposed by the State for school operations, several
school districts across the State also rely upon property tax to fund a majority of their annual capital needs. If this
funding source were broadened without encroaching upon tax rate limitations and the resulting revenue were
readily administered through the Pupil-Centered Funding Plan, it offers the most promising, predictable, and
sufficient funding source available.
Any measure that would improve the yield from property tax must be accompanied by a change in the abatement
laws or revenue will continue to be constrained at the prior abated levels. Property tax is one form of taxation that
may be partially offset by the federal government, thereby reducing the net burden borne by the individual
taxpayer. In times when state and local property taxes are deductible from federal taxes for many taxpayers, the
federal government does pay part of the freight. In a state where return of federal dollars is often at the lower end
of the state-to-state comparisons, any federal support of local programs may be considered desirable.
Sales and Use Tax
In Nevada, taxable sales are defined as the retail purchase of tangible personal property that are not otherwise
exempt from the application of a sales tax. If the transaction is neither a retail purchase nor a purchase of tangible
property it is not subject to the sales tax and is considered implicitly exempted. Services, which comprise nearly
two-thirds of the overall economy, are implicitly exempt since they are not considered tangible. This is an area of
taxation that has not kept pace with changes over time, as more of the economy has shifted toward services and
away from goods. Additionally, there are tangible goods that are explicitly exempted from sales tax by way of
legislative act such as food purchased at grocery stores, prescription medications, and a host of other goods. What
is left of the sales tax base is merely a fraction of today’s economy, leaving much of Nevada’s annual commerce
exempted from the application of sales tax with only certain areas of trade to form the base against which the sales
tax is applied. This comparatively narrow sales tax base, evidenced by historical performance, exposes the base to
more volatility than if it were more broadly distributed over more of the economy. Broadening the sales tax base
would create benefits beyond the opportunity to increase revenue, including creating a base that would be far less
dependent upon certain areas of trade – which we know to be economically susceptible to fluctuations – carrying
a disproportionate load.
To address the guiding principle of equity when considering adding depth and breadth to the sales tax base, the
State would need to distinguish between discretionary and non-discretionary goods and services. Non-
discretionary goods or services are those that all consumers cannot do without, while discretionary goods and
services are more a matter of personal choice. Levying taxes upon non-discretionary goods and services gives rise
to concerns of regressivity as such taxes disproportionately impact those with less ability to pay for them. The
focus, then, should be upon discretionary goods and services. Note that broadening the application of any
transaction or excise tax also gives rise to a more level playing field among those selling goods and services into
the economy. Currently, only some providers of goods and services must account for the application of a sales tax
in determining pricing strategies for their products, while others are able to ignore such application.
Funding Targets
A rational metric for the enhancement of funding for K-12 education in Nevada may be steady progression toward
national averages for per-pupil spending. Although circumstances vary greatly between and among states with
respect to percentages of students who receive their education in rural versus urban settings, student populations
requiring special needs, growth trends in overall student populations, and various other factors, movement toward
the national averages – particularly for Nevada listed at the lower end of the per-pupil spending spectrum –
presents itself as a rational basis for comparison to current spending levels.
Additionally, the Commission examined recent and past adequacy studies specific to Nevada (e.g., APA, 2006;
APA, 2018) regarding per-pupil spending targets that would – based upon the professional judgment of experts in
the field of K-12 education – provide program support more commensurate with academic success for Nevada’s
students. This process involved consideration of both education inputs and outputs and the reasonable base
funding amounts per student, Special Education local and State allocations, as well as target weighted funding
needs for English Learners, At-Risk Students, and programs for Gifted and Talented Students.
10Nevada Commission on School Funding
Preliminary Recommendations Regarding Optimal Funding
To provide a basis for comparison of current and targeted funding for K-12 education, the Commission analyzed
current spending (as of Fiscal Year 2020) from all sources in support of base per student funding, weighted
funding, and auxiliary services. As noted, this computation includes all State and local funding sources and is
based upon a 2020 enrollment total of 484,863 students on a Statewide basis. Nevada’s per-pupil spending
(excluding capital) in Fiscal Year 2020 is determined to have been $9,249 per student. Again, this value
establishes the level at which Nevada currently funds education on a per-pupil basis and is a product of the
combined State and local sources divided by enrollment for that year.
As reported by the National Center for Education Statistics (2020), the national average in per-pupil spending,
also excluding capital, was $12,645. When compared to the national average of $12,645 for 2020, Nevada spent
$3,396, or 27 percent, less per student. Closing the gap of Nevada’s current spending level and the national
average would require a 37 percent increase in Nevada’s commitment to per pupil funding of education.
An alternative view of a spending level threshold, as noted above, would be to consider the recommendations of
the subject matter experts APA. Initially engaged by the Nevada State Legislature to perform the Nevada
Education Adequacy Study in 2006, APA updated the 2006 study for the Lincy Institute at the University of
Nevada, Las Vegas. The amount of funding on a per-pupil basis needed to achieve the targets identified by
APA, in 2020 dollars, equates to $14,337 per-pupil. This funding target brings the base per-pupil funding
(excluding capital), along with the weighted funding for special needs categories, into alignment with spending
levels determined to be adequate for Nevada. The gap between Nevada per-pupil funding and the level of funding
recommended by the subject matter expert, in 2020 dollars, is $5,088 per-pupil. To achieve this level of funding
would require an increase of more than 55 percent above Nevada’s current funding commitment. The table below
summarizes the calculations arising from the recommendations.
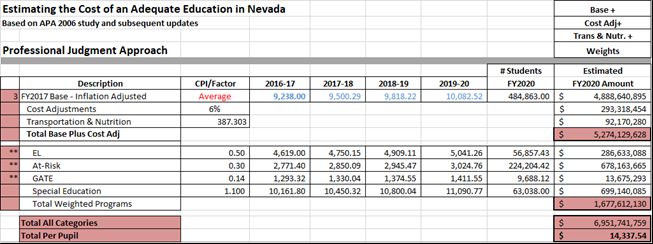
Estimating the Cost of an Adequate Education in Nevada (Table 2)
The data discussed above is summarized below:
2020 Nevada Per-pupil Funding $9,249
2020 National Average Per-pupil Funding $12,645
2020 Subject Matter Expert Recommended Funding $14,337
The amounts noted above establish the gap between the 2020 Nevada Per-pupil Funding and the national average
as a first target, and between the 2020 Nevada Per-pupil Funding and the APA recommended funding level as a
second target.
SB 543 allows for the Commission to identify “optimal funding” for K-12 education. While the amounts noted
above do not represent optimal funding, they do identify target funding levels leading to Optimal Funding. These
targets serve as points along the progression toward optimality until such time as the Optimal Funding level is
further defined. In no case can it be presumed that the Optimal Funding level is less than these targets. In addition
11Nevada Commission on School Funding
Preliminary Recommendations Regarding Optimal Funding
to identifying funding targets, the Commission is further asked to identify methods of funding to achieve the
target funding levels over a ten-year period. The ten-year period noted in SB 543 is assumed to commence with
Fiscal Year 2021-22, covering five biennial budgets for the State, continuing through Fiscal Year 2030-31. The
ten-year period inherently presumes a measured implementation of both funding and spending, with the goal to
achieve the target level of per-pupil funding noted by year ten. As such, the per-pupil funding targets will need to
be adjusted to account for inflation and increases in total enrollment over the ten-year period.
From an aggregate perspective, the annual funding requirements to maintain pace with a ten-year phase-in will be
shown under four scenarios. These are:
o Scenario 1a: Achieve the national average per-pupil funding target over a ten-year
period.
o Scenario 1b: Achieve the national average per-pupil finding target over an eight-year
period.
o Scenario 2a: Achieve the APA recommended funding level over a ten-year period.
o Scenario 2b: Achieve the APA recommended funding level over an eight-year period.
For both the national average funding target and the APA recommended funding target, an eight-year scenario is
being shown in the event that the State Legislature elects to commence the phase-in of the funding beginning in
Fiscal Year 2023-24 in lieu of commencing the phase-in in Fiscal Year 2021-22. Due to a variety of
circumstances, this may prove to be a more realistic set of scenarios. Detailed information regarding each scenario
follows.
Scenario 1a: As noted, Scenario 1a assumes a ten-year phase-in of funding necessary to achieve a per-pupil
spending level of $12,645 (in Fiscal Year 2019-20) dollars by Fiscal Year 2030-31. Per-pupil spending is inflated
by two percent per year, while enrollment is increased by 0.5 percent per year. Note that the 2020 values
previously cited have been inflated forward to a funding commencement year of 2022. This is assumed since this
is the earliest year during which funding enhancements could possibly be made. The inflation and enrollment
growth assumptions are identical for each scenario that is shown.
Scenario 1a (Table 3)
National Average Funding Level (10-Year Phase In) Status Quo Funding Level Resulting Shortfall
Required Per Pupil Pupil Funding
Funding Level Required Total Level Total Funding
Estimated Phase-In (Inflation Funding (Inflation (Inflation Incremental Aggregate
School Year (ending) Enrollment Percentage Adjusted) (Inflation Adjusted) Adjusted) Adjusted) Shortfall Shortfall
Year 1 1 2022 489,724 10% $ 9,977 $ 4,886,025,580 $ 9,623 $ 4,712,548,232 $ 173,477,348 $ 173,477,348
Year 2 2 2023 492,172 20% $ 10,538 $ 5,186,496,451 $ 9,815 $ 4,830,833,192 $ 182,185,911 $ 355,663,259
Year 3 3 2024 494,633 30% $ 11,117 $ 5,498,972,716 $ 10,012 $ 4,952,087,106 $ 191,222,351 $ 546,885,610
Year 4 4 2025 497,106 40% $ 11,716 $ 5,823,867,744 $ 10,212 $ 5,076,384,492 $ 200,597,642 $ 747,483,252
Year 5 5 2026 499,592 50% $ 12,333 $ 6,161,608,095 $ 10,416 $ 5,203,801,743 $ 210,323,100 $ 957,806,352
Year 6 6 2027 502,090 60% $ 12,971 $ 6,512,633,916 $ 10,624 $ 5,334,417,166 $ 220,410,398 $ 1,178,216,750
Year 7 7 2028 504,600 70% $ 13,629 $ 6,877,399,359 $ 10,837 $ 5,468,311,037 $ 230,871,572 $ 1,409,088,322
Year 8 8 2029 507,123 80% $ 14,309 $ 7,256,373,003 $ 11,054 $ 5,605,565,644 $ 241,719,037 $ 1,650,807,358
Year 9 9 2030 509,659 90% $ 15,010 $ 7,650,038,293 $ 11,275 $ 5,746,265,342 $ 252,965,593 $ 1,903,772,951
Year 10 10 2031 512,207 100% $ 15,734 $ 8,058,893,993 $ 11,500 $ 5,890,496,602 $ 264,624,440 $ 2,168,397,391
The table above is structured to show the national average funding per-pupil rolled forward by inflation and
enrollment. The product of the enrollment times the required per-pupil funding level yields the required funding
to achieve that objective. This can then be compared to current funding, which is also rolled forward by inflation
and enrollment. The difference between the required funding and current funding reveals the amount of new
revenue each year that must be added to current funding to achieve the national average funding target.
Scenario 1a suggests that by Fiscal Year 2030-31, the required per-pupil spending would need to be $15,734
applied against projected enrollment of 512,207 students in Nevada. The gross funding requirement to achieve
this level of funding would approximate $8.06 billion for that year. Current funding, inflated and adjusted
forward, would approximate $5.88 billon (if funding efforts by the State were to remain constant). Comparison to
12Nevada Commission on School Funding
Preliminary Recommendations Regarding Optimal Funding
the funding requirements suggests that by Fiscal Year 2030-31, an additional $2.17 billion in funding will be
required if the target value is to be achieved.
The table assumes that reaching this funding milestone would be achieved by phasing-in the annual funding
commitment on a straight-line basis over the ten-year period. The column showing the incremental shortfall
represents that additional amount that would be required to be appropriated each year to maintain pace with the
funding target.
Scenario 1b: This scenario is identical to Scenario 1a in all respects other than the timeframe over which the
funding is applied. Scenario 1b assumes that in lieu of a ten-year funding implementation schedule, the
enhancements to funding would commence in Fiscal Year 23-24 and would continue through Fiscal Year 2030-
31. Simply put, this scenario assumes an eight-year funding schedule instead of a ten-year schedule. This is
provided as an alternative in the event the commencement of the funding enhancements were not to occur until
the 2023 session of the Nevada Legislature were to convene and approve funding.
Scenario 1b (Table 4)
National Average Funding Level (8-Year Phase In) Status Quo Funding Level Resulting Shortfall
Required Per Pupil Pupil Funding
Funding Level Required Total Level Total Funding
Estimated Phase-In (Inflation Funding (Inflation (Inflation Incremental Aggregate
School Year (ending) Enrollment Percentage Adjusted) (Inflation Adjusted) Adjusted) Adjusted) Shortfall Shortfall
Year 1 1 2024 494,633 13% $ 10,472 $ 5,179,956,110 $ 10,012 $ 4,952,087,106 $ 227,869,004 $ 227,869,004
Year 2 2 2025 497,106 25% $ 11,152 $ 5,543,561,524 $ 10,212 $ 5,076,384,492 $ 239,308,028 $ 467,177,032
Year 3 3 2026 499,592 38% $ 11,854 $ 5,922,156,507 $ 10,416 $ 5,203,801,743 $ 251,177,732 $ 718,354,764
Year 4 4 2027 502,090 50% $ 12,580 $ 6,316,264,458 $ 10,624 $ 5,334,417,166 $ 263,492,527 $ 981,847,291
Year 5 5 2028 504,600 63% $ 13,330 $ 6,726,425,610 $ 10,837 $ 5,468,311,037 $ 276,267,282 $ 1,258,114,573
Year 6 6 2029 507,123 75% $ 14,105 $ 7,153,197,543 $ 11,054 $ 5,605,565,644 $ 289,517,326 $ 1,547,631,899
Year 7 7 2030 509,659 88% $ 14,906 $ 7,597,155,711 $ 11,275 $ 5,746,265,342 $ 303,258,471 $ 1,850,890,369
Year 8 8 2031 512,207 100% $ 15,734 $ 8,058,893,993 $ 11,500 $ 5,890,496,602 $ 317,507,022 $ 2,168,397,391
As is shown, the eight-year implementation schedule still has a target of $15,734 per-pupil in Fiscal Year 2030-
31. Since the phase-in of the funding occurs over a shorter span of time, the incremental shortfall amounts, per
year, are larger.
Scenario 2a: While Scenario 1a and 1b focused upon achievement of the national average in per-pupil spending
of the 2020 equivalent of $12,645, Scenarios 2a and 2b use the APA recommended funding target of $14,337.
The assumptions used to inflate and adjust the values on a forward basis are the same as were used in Scenarios
1a and 1b.
Scenario 2a (Table 5)
Adjusted APA Funding Level (10-Year Phase In) Status Quo Funding Level Resulting Shortfall
Required Per Pupil Pupil Funding
Funding Level Required Total Level Total Funding
Estimated Phase-In (Inflation Funding (Inflation (Inflation Incremental Aggregate
School Year (ending) Enrollment Percentage Adjusted) (Inflation Adjusted) Adjusted) Adjusted) Shortfall Shortfall
Year 1 1 2022 489,724 10% $ 10,152 $ 4,971,775,876 $ 9,623 $ 4,712,548,232 $ 259,227,644 $ 259,227,644
Year 2 2 2023 492,172 20% $ 10,895 $ 5,362,301,708 $ 9,815 $ 4,830,833,192 $ 272,240,872 $ 531,468,516
Year 3 3 2024 494,633 30% $ 11,664 $ 5,769,299,669 $ 10,012 $ 4,952,087,106 $ 285,744,047 $ 817,212,563
Year 4 4 2025 497,106 40% $ 12,459 $ 6,193,350,623 $ 10,212 $ 5,076,384,492 $ 299,753,568 $ 1,116,966,131
Year 5 5 2026 499,592 50% $ 13,281 $ 6,635,054,219 $ 10,416 $ 5,203,801,743 $ 314,286,345 $ 1,431,252,476
Year 6 6 2027 502,090 60% $ 14,131 $ 7,095,029,462 $ 10,624 $ 5,334,417,166 $ 329,359,820 $ 1,760,612,296
Year 7 7 2028 504,600 70% $ 15,010 $ 7,573,915,313 $ 10,837 $ 5,468,311,037 $ 344,991,979 $ 2,105,604,276
Year 8 8 2029 507,123 80% $ 15,918 $ 8,072,371,293 $ 11,054 $ 5,605,565,644 $ 361,201,373 $ 2,466,805,649
Year 9 9 2030 509,659 90% $ 16,857 $ 8,591,078,122 $ 11,275 $ 5,746,265,342 $ 378,007,131 $ 2,844,812,780
Year 10 10 2031 512,207 100% $ 17,826 $ 9,130,738,358 $ 11,500 $ 5,890,496,602 $ 395,428,976 $ 3,240,241,756
Not surprisingly, since the target value is higher than the national average, the amount required on a per-pupil
basis in Fiscal Year 2030-31 is also higher. And, in turn, the funding gap between current funding and required
total funding is also materially higher. To achieve the Fiscal Year 2019-20 equivalent of $14,337 per-pupil,
funding would have to be increased to a per-pupil funding level of $17,826 by Fiscal Year 2030-31. In total, just
over $9.1 billion in total funding would be required. Of that amount, current funding projected forward would
account for approximately $5.9 billion, leaving an amount to be funded of just over $3.2 billion.
13Nevada Commission on School Funding
Preliminary Recommendations Regarding Optimal Funding
Scenario 2a assumes a ten-year implementation timeframe, similar to Scenario 1a.
Scenario 2b: This scenario repeats the same assumptions previously used but adjusts the funding implementation
schedule to an eight-year period.
Scenario 2b (Table 6)
Adjusted APA Funding Level (8-Year Phase In) Status Quo Funding Level Resulting Shortfall
Required Per Pupil Pupil Funding
Funding Level Required Total Level Total Funding
Estimated Phase-In (Inflation Funding (Inflation (Inflation Incremental Aggregate
School Year (ending) Enrollment Percentage Adjusted) (Inflation Adjusted) Adjusted) Adjusted) Shortfall Shortfall
Year 1 1 2024 494,633 13% $ 10,700 $ 5,292,592,340 $ 10,012 $ 4,952,087,106 $ 340,505,235 $ 340,505,235
Year 2 2 2025 497,106 25% $ 11,616 $ 5,774,488,324 $ 10,212 $ 5,076,384,492 $ 357,598,597 $ 698,103,832
Year 3 3 2026 499,592 38% $ 12,565 $ 6,277,241,100 $ 10,416 $ 5,203,801,743 $ 375,335,525 $ 1,073,439,357
Year 4 4 2027 502,090 50% $ 13,547 $ 6,801,594,080 $ 10,624 $ 5,334,417,166 $ 393,737,556 $ 1,467,176,913
Year 5 5 2028 504,600 63% $ 14,563 $ 7,348,314,855 $ 10,837 $ 5,468,311,037 $ 412,826,904 $ 1,880,003,817
Year 6 6 2029 507,123 75% $ 15,614 $ 7,918,195,940 $ 11,054 $ 5,605,565,644 $ 432,626,478 $ 2,312,630,296
Year 7 7 2030 509,659 88% $ 16,701 $ 8,512,055,544 $ 11,275 $ 5,746,265,342 $ 453,159,906 $ 2,765,790,202
Year 8 8 2031 512,207 100% $ 17,826 $ 9,130,738,358 $ 11,500 $ 5,890,496,602 $ 474,451,554 $ 3,240,241,756
As with Scenario 1b, since the funding is phased-in over a shorter period, the amount needed per year increase
proportionately. The target per-pupil spending and the aggregate shortfall by Fiscal Year 2030-31 remain the
same as in Scenario 2a.
Funding Alternatives to Achieve Target Funding Levels
The funding targets - expressed on a per-pupil funding basis - to achieve parity with spending on a national
average basis or to achieve the APA recommended funding level have been quantified and expressed as a ten-year
funding goal. These targets are expressed as amounts of new funding needed each year to maintain pace in order
to achieve parity with national averages or APA recommended funding levels.
To achieve funding at the national average, an average of $216.8 million per year in new revenue would need to
be identified. Over a ten-year period, the range in annual investment ranges from a low of $173.4 million in year 1
to a high of $264.5 million in year 10. If done over an eight-year phase-in, the average incremental annual invest
would rise to $271.0 million with a range of $227.9 million in year 1 to a high of $317.5 million in year 8.
Compressing the phase-in increases the annual incremental investment, as would be expected. Achieving the APA
recommended funding levels over a ten-year period would require an average annual incremental investment of
$324.0 million. The range over the ten-year period would be from a low of $259.2 million in year one to a high of
$395.4 million in year ten. Compressing the phase-in to an eight-year period would greatly increase these targets
– an average incremental increase of $405 million, with a range of $340.5 million to $474.4 million.
The ten-year phase to reach the funding targets requires significant commitments of new funding per annum, well
above the current level of funding commitments from state and local sources. The magnitude of the funding
challenge dictates that administrative ease and transparency be considered, translating into a preference for the use
of existing tax regimes versus those that would otherwise need to be developed from scratch. The capacity of
existing tax sources suggests there is ample room within those systems already in place to address the identified
needs. Given that a premium is placed upon revenue sufficiency, predictability, and equity, the roster of potential
funding sources shrinks.
As noted, there are only two sources of tax revenue that have the capacity to achieve these levels of annual
funding increases – property tax and sales tax. While other tax sources can certainly be considered to complement
or supplement the overall funding strategy, the revenue demands to achieve the targeted levels of funding would
not be achievable without significant contributions from the tax capacity that exists within the property and sales
tax systems.
Examining property taxation first, virtually no enhancement opportunities exist without first addressing
the constraints inherent to the current system of property tax abatements. While the abatement program
has served to suppress the growth of property tax assessments to property owners, it has also served to
14Nevada Commission on School Funding
Preliminary Recommendations Regarding Optimal Funding
diminish the revenue capacity of property taxation. It is worth bearing in mind that the abatement
program was put into place at a time – just prior to the housing bubble in the mid-2000’s - when county
assessors were concerned that property assessments would be the cause of rising property tax bills.
Much has changed since that time.
Some facts about the impact of the abatements:
• Statewide, property tax revenue today is about equal to what was generated in Fiscal Year 2008-
09.
• When inflation adjusted and applied on a per capita basis, property tax revenue today is
comparable to Fiscal Year 2006-07.
• In recent years, property tax has declined on an inflation-adjusted per capita basis. It remains
below the 20-year average.
• Today, on a statewide basis, abatements total over $1.05 billion. Over the course of the 2019-21
biennium, abatements are expected to total $2.1 billion.
• K-12 educations share of the abatements is roughly 40 percent of the total, amounting to $840
million over the 2019-21 biennium.
• Abatements represent taxes that are assessed, but not billed or collected.
• All other changes to the system of property taxation are constrained by the abatements, meaning
that changes to the application of depreciation, method of assessment, increases to rates, or any
other alteration would be muted by the abatements.
The current level of accrued abatement exceeds $1 billion, which is an annualized value. If more than 35 percent
of this amount is directly attributable to the tax rate for education (including both operating and capital levies) and
further presuming that the abatements will continue to grow over time and over the course of the ten-year funding
period, it is estimated that placing the abated amounts into productive use could address well more than half of the
funding challenge identified in Scenario 1a (Recommendation 1d). Since the abatements form an essential
element of any funding plan for education, the next question would focus upon how the abatements may be used
to address the challenge.
Regarding Property Taxes, Commission recommends the following for consideration:
1. At the very least, cap any further accrual of abatements. The more the abatements increase, the
greater the opportunity cost. As the tables in this report evidence, the longer it takes to achieve
the target funding, more and more funding is needed each year to catch up.
a. Consider phasing out or eliminating the abatements to bring the abated funding into the
equation for education and other government programs.
b. Modernize the property tax assessment system to address:
i. The impact of keeping the depreciation factor in place, as it further erodes the
assessed valuation base for improvements to real property. Depreciation could be
capped, phased-out or eliminated.
ii. Migrate away from an assessment system that relies upon replacement value of
improvements as opposed to the market value of the improvements. As the
replacement value is further diminished by depreciation, the gap between market
and taxable value widens. This could be accomplished by updating valuation to
market valuation upon transfer of title, or on a more sweeping basis.
c. Consider revisiting the $3.66 combined ad valorem rate cap. This can take one of two
forms. The first would be to consider any additional headroom that may be needed to
reach the funding targets (following the alternation of the abatement constraints and the
modernization of the assessment system) and allow for property tax rates to migrate
15Nevada Commission on School Funding
Preliminary Recommendations Regarding Optimal Funding
upward to assist in filling that gap. As noted earlier in this report, it is the statutory caps
that constrain current rates; rates are materially under the State’s constitutional cap of
$5.00 per $100 of assessed valuation.
d. An alternative approach would be to remove the abatements and make other adjustments
to the assessment system (i.e., elimination of depreciation, market-based valuation, etc.)
while reducing current ad valorem tax rates to a point of revenue neutrality. While this
approach would not generate additional revenue, per se, it would significantly reduce
current combined ad valorem tax rates, thereby increasing headroom under the statutory
caps. This headroom could then be used to increase education funding – whether by
direct legislative action or through initiatives placed before the electorate. Note that due
to the requirement for equal and uniform funding, such a ballot initiative – if placed
before the voters in lieu of legislative enactment - would require approval on a Statewide
basis.
It is estimated that the combined impact of the above measures has the capacity to fund a majority of the funding
needs identified previously. If all were to be applied by year 10 of the funding horizon, sufficient capacity may
exist to fully fund the needs identified in Scenario 1a.
Opportunities exist within Nevada’s sales and use tax system, beyond simply increasing the tax rate. In fact, due
to the comparatively high tax rates in the more urbanized areas of the State, there is far less headroom with
respect to the tax rate. Nevada’s comparatively narrow base against which tax rates are applied offers far more
opportunity to not only enhances revenue production but to also equalize rates between and among different areas
of commerce. This, in turn, would also make Nevada’s sales tax system less volatile over time as it would spread
the burden over a larger number of industries and areas of trade. Expansion of the sales and use tax base is as
much an argument for modernizing the system as it is for revenue enhancement.
Nevada’s sales and use tax rates are solely applied to the retail purchase of tangible personal property. By
definition, this implicitly exempts any items that are either personal property or not sold at retail from sales or use
taxation. In essence, it exempts a majority of the economy and areas of trade from taxation. Further eroding the
narrow base are the various and sundry explicit exemptions. Over time, due both to the ongoing shift in the
economy from goods to services and the layering on of explicit exemptions, the narrow base becomes even more
narrow. This has exposed the sales and use tax system to erosion and has made it more susceptible to economic
downturns.
Using a companion tax rate of 6.85 percent, every additional $1 billion in trade that is captured by the companion
services tax would generate more than $65 million per year. As this is in current dollar terms, this amount could
grow to more than $100 million per year by year ten of the funding horizon. This level of funding would achieve
nearly 40 percent of the annual amount needed by year ten in Scenario 1a, and roughly 20 percent of the amount
needed in Scenario 2b. Identification of between $3 and $4 billion in additional trade that could be taxed would
fully fund the needs identified in Scenario 1a. Given the expanse of currently untaxed trade that exists, this is
feasible.
For Sales and Use Taxes, the Commission recommends the following approach:
1. Review all explicit exemptions for appropriateness and eliminate those that have exceeded their
useful life.
2. Review the items that are either implicitly or explicitly exempted from sales and use tax and
segregate those items that are considered discretionary purchases. Non-discretionary purchases
should be avoided as they would lead to elevated regressivity, while discretionary purchases
lessen this concern.
3. Consider implementing a services tax on the discretionary items identified among the currently
non-taxed items. This tax can be a companion rate to the rate that is currently imposed upon
16You can also read