Circular economy perspectives for future end-of-life EV batteries - Circular Impacts Workshop J Rizo - CEPS
←
→
Page content transcription
If your browser does not render page correctly, please read the page content below
Circular economy
perspectives for
future end-of-life EV
batteries
Circular Impacts Workshop
J Rizo
EC DG Environment
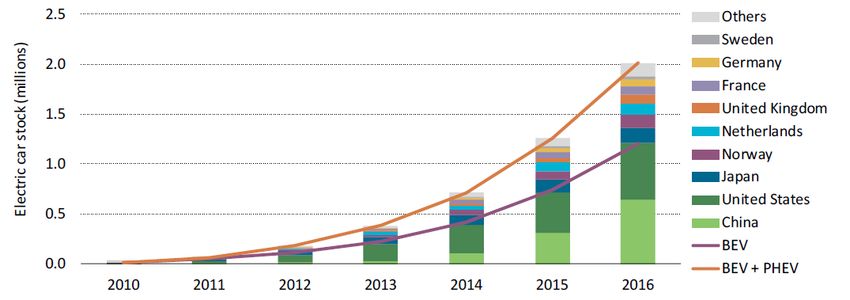
Two million and counting

 Evolution of the global electric car stock, 2010-16

 IEA: Global EV Outlook 2017, limited to BEVs and
 PHEVs
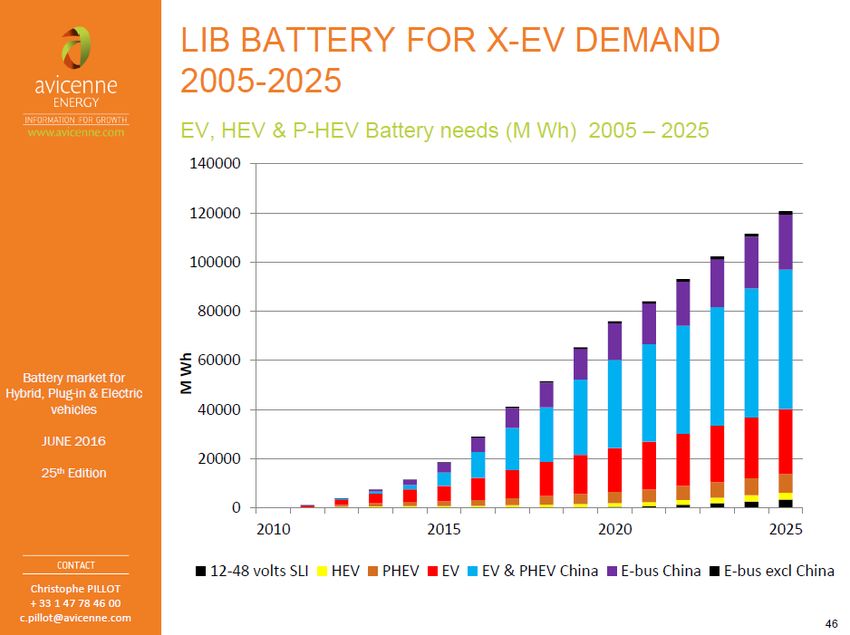
Advanced batteries
EU too

 Registered e-passenger vehicles in the EU
 1000000

 900000

 800000

 700000

 600000

 2013
 500000
 2014
 400000 2015

 300000

 200000

 100000

 0
 Electrical Energy Hybrid electric-petrol Plug-in hybrid petrol- Hybrid diesel-electric Plug-in hybrid diesel-
 electric electric
 EUROSTAT
Connectivity

 Proportion of people who used a computer or the
 internet on a daily basis

 The number of devices connected to IP networks will be more than three times the global
 population by 2021:
 • 3.5 networked devices per capita by 2021 (2.3 in 2016)
 • 27.1 billion networked devices in 2021 (17.1 billion in 2016)
 (The Zettabyte Era: Trends and Analysis. Cisco June 2017)
Novelties
Novelties

Repurposed second-life EV battery volumes will rise dramatically. By the mid-2020s a large quantity of
used EV batteries will become available for stationary applications. They will be deployed for grid-scale,
commercial, and residential storage applications and will enable higher levels of renewables to be
integrated onto the grid. They may also be used to reduce peak demand charges for public fast-charging
infrastructure, so improving the business model. (McKinsey & Bloomberg 2016)

• Price • No specific provision in EU legislation, general rules
• Performance apply.
• Safety • Waste or not waste?
• Guarantees and liability • Repurposing? Refurbishing?
 • EPR?
 • End of waste criteria?
Problems remain

 Waste batteries generated in the EU
 2,000,000

 1,800,000

 1,600,000

 1,400,000

 1,200,000
 Tons

 1,000,000

 800,000

 600,000

 400,000

 200,000

 EUROSTAT
 0
 2004 2006 2008 2010 2012 2014
A circular framework

 Reuse, Recovery & Design &
 Recycling Manufacturing

 • Recycling efficiencies for Pb, • Prohibition of Hg, Cd
 Ni • Removability
 • Classification

 • E.P.R Placing on the Market
 Collection
 & Treatment • Reporting

 • Levels of collection for • Information to end users
 portables • Labelling
 • Take back • Removability
 • No incineration Use &
 • No disposal comsumption
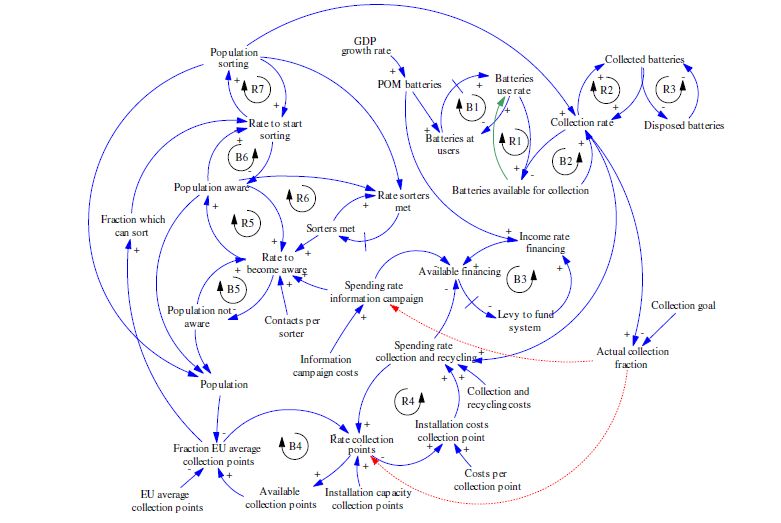
The logic • Collection of spent batteries: 45% for portables (collecting schemes) No target as such for automotive (collecting schemes) or industrial (take back), but landfilling and incineration of industrial and automotive batteries are prohibited • All batteries collected shall undergo recycling The level of recycling should be 100% • Targets are established for the recycling efficiency of recycling processes Pb, Cd, and general To the highest degree of metal recovery that is technically feasible while avoiding excessive costs
Collection

 Portable Waste Batteries collected, 2015
 70

 60

 50

 40

 30

 20

 10

 0
Lead-acid Batteries

 • EUROBAT (2015)
Lead
Lead Acid Batteries (ELV)

 120
 Lead batteries: % recycled

 100

 80

 2011
 60
 2012
 2013
 2014
 40
 2015

 20

 0
Recycling (2015)
 Re Pb Pb Mc Re Ni-Cd Cd Mc Re Other
 Belgium 80,9 98 81,6 100 63,4
 Bulgaria 97,8 69,3 68,9 Re Pb: recycling efficiency Lead acid batteries (65%)
 Czech Republic 73,5 98,1 94,6 98,5 60,4
 Denmark 80 78,9 59,3 Pb Mc: highest degree of recovery for Lead
 Germany 85,1 98,6 78,5 100 76,3
 Estonia 79,2 99 0 0 54,3 Re Ni-Cd: recycling efficiency Nickel Cadmium batteries (75%)
 Ireland 90 99,8 78,5 100 83,4
 Spain Cd Mc: highest degree of recovery for Cadmium
 France 81,8 99 80,9 64,1
 Croatia 76,6 98,4 74,6 100 66,6 Re Other: recycling efficiency for other batteries (50%)
 Italy 91,4 97,1 78,3 60
 Cyprus
 Latvia 70 90 76 85 52
 Lithuania
 Luxembourg 90 90 80,6 80,6 58,9
 Hungary 91,2 87,2 0 0 60,2
 Malta 78,9 90,9 0 0 0
 Commission Regulation (EU) No 493/2012
 Netherlands 78 79 56
 Austria 84,5 96,8 81,6 100 82,2
 Poland 76,5 96,9 99,5 100 67,4
 Portugal 70,5 98,6 94,2 100 81,4
 Romania
 Slovenia 77,3 98
 Slovakia 92,3 98,1 80,2 46,7 61,1
 Finland 82,9 96,8 79,7 100 96
 Sweden 74,2 97,1 76,5 100 67,4
 U.K.
Cost and Benefits

 "Recycling is an alternative to disposal. The good reason for recycling is that it is
 a better alternative than disposal – better in the sense that the net social cost of
 recycling is lower than the net social cost of disposal, once all the social benefits
 and costs of each are properly counted."
 • The Economics of Waste, R.C. Porter 2002
Cost and Benefits

 • The biggest part of the cost is raw materials (for LiB)
 Pillot 2006

 • Influence of recycling?

 • Recycling creates a second source of supply that helps stabilize the
 commodity price of lead.

 • Recyclers make a profit when the price of the finished product sold to
 battery producers is higher than the price recyclers pay for batteries at
 their end-of-life.
 Ellis 2016
Cost and Benefits

 <

 • Energy driven
 • Too low volume? Too high fixed costs?
 • Few Critical Raw Materials
 • Markets volatility
 • Quality issues
 • Regulatory aspects
 • Market failure?
 18
Seeking for a model

Economies of scale and efficiencies

 Blumberga et al. 2014
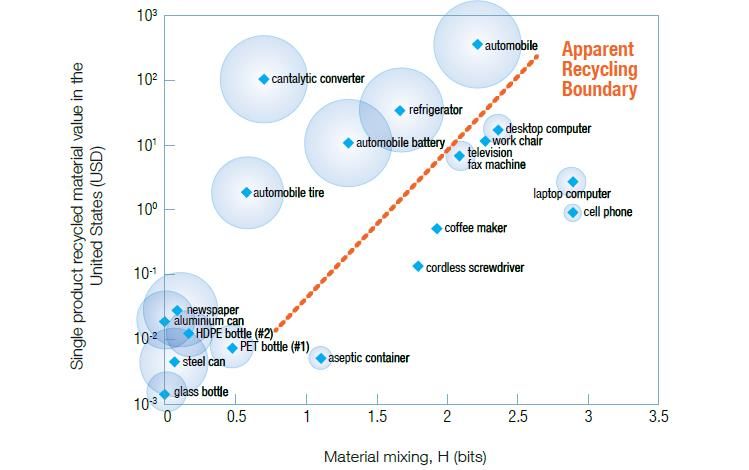
Limits to recycling…

 Entropic Backfire:

 • Miniaturizacion
 • Dilution

 Dahmus & Gutowski
 (2007).

 20
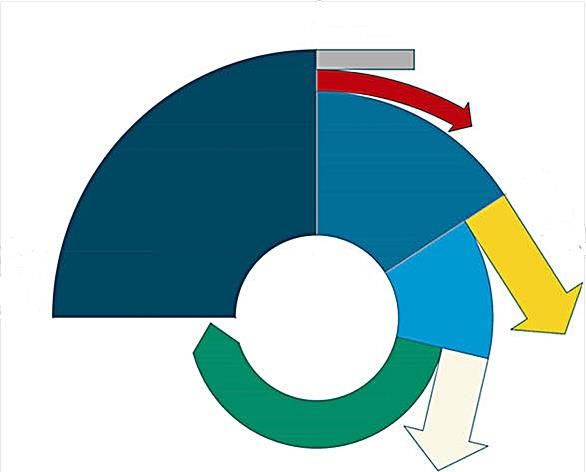
Always losses

 Unspecified losses

 • txt Dissipation in use

 Production
 Use

 Non collected

 Recycled
 Collected, but not recycled
(Adapted and modified from Ciacci et al. 2015) or non-functionally recycled
Products
 Al cans
 Life span of drinking cans = 6
 weeks
 Collection and pre-processing
 rates of waste cans = 97%;
 Recyling process efficiency=
 97%
 Collected and recycled
 aluminum is repeatedly
 included in the model.
 Conclusion:
 After 1 year 45% of the
 aluminum put in use is
 lost.
 After 5 years only 5% of
 the aluminum remains.
 After ten years only 0,2%
 is left.
Ways to explore

SUBSTANCES
• Increase the level of collection
• Increase the level of recycling
• Increase the efficiency of recycling

ECODESIGN OF PRODUCTS
• Increase lifespan
• Address entropic backfire
• Promote substitution
Many thanks!

 • jose.rizo-martin@ec.europa.eu
 • http://ec.europa.eu/environment
You can also read