Promoting Non-Motorized Transport in Asian Cities: Policymakers' Toolbox - December 2013 - UN-Habitat
←
→
Page content transcription
If your browser does not render page correctly, please read the page content below
Promoting
Non-Motorized Transport
in Asian Cities:
Policymakers’ Toolbox
December 2013
Promoting
Non-Motorized Transport
in Asian Cities:
Policymakers’ Toolbox

December 2013
Disclaimer :
The views expressed in this publication are those of Clean Air Asia staff, consultants and management, and do
not necessarily reflect the views of the Board of Trustees of the Clean Air Asia Center. The Clean Air Asia Center
does not guarantee the accuracy of the data included in this publication and does not accept responsibility for
consequence of their use.
The designations employed and the presentation of material in this publication do not imply the expression of
any opinion whatsoever on the part of the secretariat of the United Nations concerning the legal status of any
country, territory, city or area or its authorities, or concerning the delimitation of its frontiers or boundaries
regarding its economic system or degree of development. Excerpts may be reproduced without authorization,
on condition that the source is indicated. Views expressed in this publication do not necessarily reflect those of
the United Nations Human Settlements Programme, the United Nations and its member states.

Acknowledgements :
The team would like to thank UN-Habitat and Shakti Sustainable Energy Foundation for providing generous
support for funding and guidance in carrying this work into fruition.
The writing of this document was led by Sudhir Gota, together with Sameera Kumar Anthapur and Parthaa
Bosu of Clean Air Asia. Content and editing were provided by Alvin Mejia, Kathleen Dematera, and Mark
Angelo Tacderas, also of Clean Air Asia.
This report was extensively reviewed by a diverse group of global experts. For sharing their expert insights, we
would like to thank,
Derlie Babiano, Lecturer, The University of Queensland
Prof Madhav Badami, Associate Professor, McGill University - School of Urban Planning
Bert Fabian, Program Officer, United Nations Environment Programme
Bradley Schroeder, NMT Specialist
Susan Zielinski, University of Michigan - Sustainable Mobility & Accessibility Research & Transformation

©2013 Clean Air Asia. All rights reserved.
Clean Air Asia Center, 2013. “Promoting Non-Motorized Transport in Asian Cities: Policymakers’ Toolbox.” Pasig
City, Philippines.
This publication may be reproduced in whole or in part in any form for educational or non-profit purposes
without special permission from the copyright holder, provided acknowledgment of the source is made. The
Clean Air Asia Center would appreciate receiving a copy of any publication that uses this Clean Air Asia Center
publication as a source. No use of this publication may be made for resale or for any other commercial purpose
whatsoever, without prior permission in writing from the Clean Air Asia Center.

HS Number : HS/020/14E

Design : Mudra
www.mudraweb.com
Contents

1. MOTIVATIONS FOR PROMOTING NMT IN ASIAN CITIES						1

 1.1 Asia Urbanizing and Motorizing Fast								1

 1.2 Decline of Walking and Cycling in Asia								             2

 1.3 NMT Accidents and Fatalities									6

 1.4 Air Pollution Exposure										7

 1.5 Transport Energy Consumption and Emissions							8

 1.6 Impact of Improved Walking and Cycling Facilities						    8

 1.7 Growth of Public Bike Share Schemes								8

 1.8 Summary											9

2. HOW TO IMPROVE NMT IN ASIAN CITIES?								                  12

 2.1 The Transportation Planning Process								12

 2.2 Visioning											12

 2.3 Diagnosis - How to Assess Walkability								13

 2.4 Diagnosis - How to Assess Cyclability								14

 2.5 Cyclability Assessment Tool for Asia								16

 2.6 Involving Stakeholders										22

 2.7 Guidelines and Policies: Complete Streets							23

 2.8 Implementing NMT Policies, Strategies and Projects						   26

 2.9 Summary											31

ANNEXES												32

 Annex A: 5 D’s of Transport										32

 Annex B: Walkability Survey Guide									33

 Annex C: Cyclability Index Survey									42

 Annex D: Cyclists Preference Survey									58

 Annex E: Pedestrian Preference Survey								60

 Bibliography											63
1. Motivations for Promoting
    NMT in Asian Cities
                                                                           “Globally, only 68 countries have national or sub
                                                                          national policies to promote walking and cycling.”

                                                                                                      - WHO Global Road Safety Status Report 2013

1.1 Asia Urbanizing and Motorizing Fast
By 2011, 52% of the global population has lived in cities                                To cater to this increase in number of vehicles, countries
and by middle of this century it would have increased to                                 like China and India are rapidly building more roads.
almost 67%. Asia will continue to have half of the world’s
                  1
                                                                                         Latest estimates from IEA4 suggest that China nearly
mega cities. In 1975, eighty cities in Asia had a population                             tripled its paved roadway network since 2000 and India
greater than one million. By 2025, it is estimated that this                             added one million paved lane kilometers in the past
will rise to 332 cities (United Nations, 2007). Parallel to                              decade. However, building more roads is a solution that
urbanization, Asia is undergoing rapid motorization. Asia                                creates a vicious cycle of further inducing travel demand,
is now home to around half a billion vehicles. It has been                               increasing car use and again, the need for roads (Litman,
estimated that by 2035, both the vehicle population and                                  2013). Unfortunately, land is limited: A lot of Asian
motorization index2 will at least double in the Association                              cities can’t support more roads and even if they can, the
of Southeast Asian Nations (ASEAN) region, China and 3
                                                                                         construction of roads takes a long time to be approved
India from current levels (2012). In many countries, vehicle                             and constructed by responsible agencies.
growth rates are higher than gross domestic product (GDP)
                                                                                         In terms of personal expenditure, transport costs
growth rates. Despite projected high number of vehicles
                                                                                         comprise a large proportion of the expenditures of many
for 2035, the projected motorization index for Asia will
                                                                                         poor people. For instance, the low income population in
still be considerably lower than the current motorization
                                                                                         Shanghai paid as much on transport as on healthcare (5%
index of the developed world. As such, a further rise in
                                                                                         of income), clothing (5% of income) and rental (0.8% of
motorization levels can be expected beyond 2035 as Asian
                                                                                         income) combined in 2003.5 A similar situation, although
economies continue to grow. It is important to note that
                                                                                         of varying scales, can be found in other Asian cities, and
the motorization phenomenon is much more intensive
                                                                                         rising fuel prices and fuel security issues will further
in cities as compared to countries as the wealth of Asia’s
                                                                                         exacerbate this situation in the future.
economies is concentrated in its cities. Apart from rising
                                                                                         At a macroeconomic level, negative externalities from
income levels, growing dissatisfaction with available
                                                                                         transport (i.e. air pollution, traffic congestion, accidents)
transport options is forcing as well as attracting people
                                                                                         already amount to 6-10% of GDP in many Asian cities
towards the use of personalized, motorized vehicles. In
                                                                                         (Partnership on Sustainable Low Carbon Transport, 2013).
many Asian cities, the motorization levels have reached
double the national values.

1.   http://esa.un.org/unup/pdf/WUP2011_Highlights.pdf

2.   Motorization index/motorization rate = number of vehicles per 1000 population, http://data.worldbank.org/indicator/IS.VEH.NVEH.P3

3.   ASEAN = Association of Southeast Asian Nations; ASEAN countries included are Indonesia, Malaysia, Philippines, Singapore, Thailand and Viet Nam.

4.   http://www.iea.org/publications/freepublications/publication/TransportInfrastructureInsights_FINAL_WEB.pdf

5.   Per Capita Consumption Expenditures Urban Household In Main Years http://www.statssh.gov.cn/2003shtj/tjnj/nje07.htm?d1=2007tjnje/e0919.htm

                                                                                                                                                        1
450 800
400 700
350
600
300
500
250
400
200
300
150
200
100
50 100
0 0
2005 2008 2015 2025 2035 2005 2008 2015 2025 2035 2005 2008 2015 2025 2035 2005 2008 2015 2025 2035 2005 2008 2015 2025 2035 2005 2008 2015 2025 2035
Southeast Asia* ChinaI NDIA OECD North America OECD Europe
Total Vehicles (in millions)-
Figure 1: Vehicle Count and Motorization Index in Asia vs OECD
Source: Asian Development Bank and Clean Air Initiative for Asian Cities. 2009
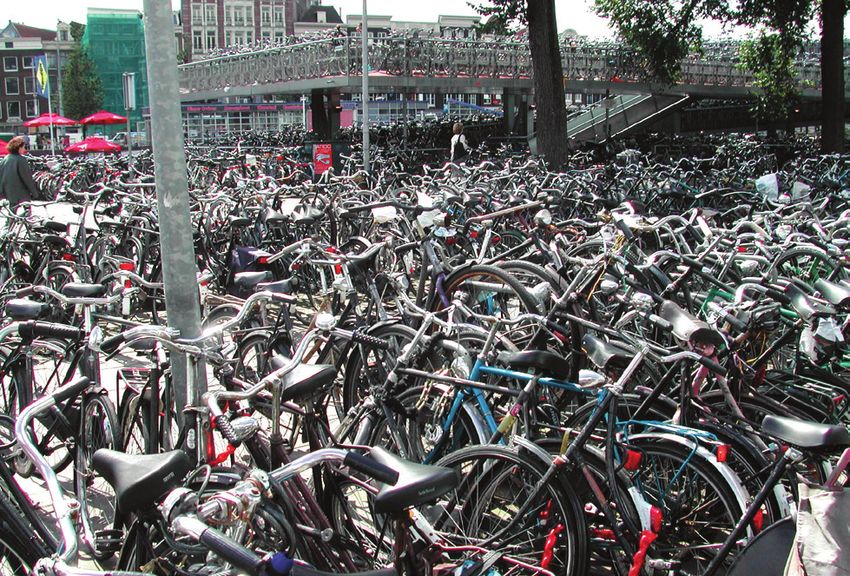
1.2 Decline of Walking and Cycling in Asia
It is no longer pleasant to walk and cycle in many Asian
cities and in fact for some cities it is becoming almost
impossible. The rapid increase in motorization in Asia
combined with limited attention to pedestrian, cycling
and public transport facilities have resulted in a decrease
in the overall non-motorized transport trip mode share.
However, it needs to be highlighted that walking and
cycling still provide mobility to a large percentage of
people in many cities (Figure 5). Short distance non- 1989
motorized transport trips are very common in Asian
cities which are characterized by very high population
densities and mixed land-use development. But this trend
is changing fast. Rapid urbanization and migration of
people is causing population growth in city areas with
new development being sprawled in the absence of more
public and non-motorized transport modes, especially
along massive ring road networks. This “steroid effect”
results in higher trip lengths causing an increase in 1998
motorized trips.
Consider Ho Chi Minh City (HCMC) as an example for the
above discussion. The following geographic information
system (GIS) images show the growth patterns that
occurred in the development of HCMC from 1989 to 2006.
Massive migration and development activities have led to
the rapid expansion of Ho Chi Minh City. In the absence
of policy support, investment and prioritization for public
and non-motorized modes, Ho Chi Minh City has a very 2006
high vehicle ownership (especially motorcycles). At the
end of June 2010, there were 4.7 million motorcycles Figure 2: Growth in Urban Built-up Area of HCMC, 1989 – 2006
registered in HCMC.6 This equates to 1.5 motorcycles Source: Tran et al (2008)
2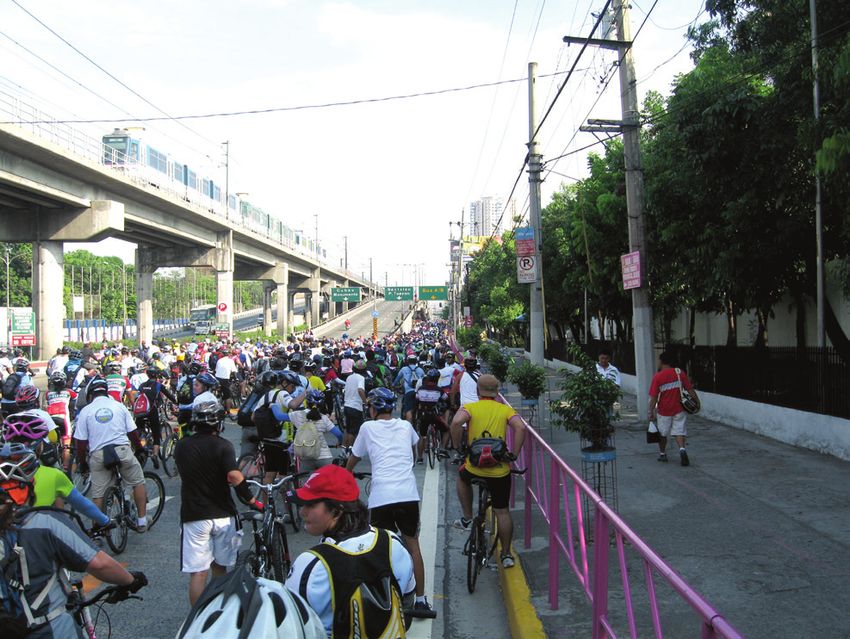
Figure 3: HCMC Metropolitan Region Urban Built-up Area, 2011
Source: Clean Air Asia, ADB and Chreod

per capita. This shows that as the city expands and non-                               In many Asian cities, a significant share of the population
motorized transport space shrinks, average trip lengths                                owns bicycles but it is not reflected in trip mode share data
for the general population increase, forcing travelers                                 (Figure 4). In India, there is a large number of households
to use motorized forms of transport even more. Non-                                    owning bicycles compared to those that own motorized
motorized trips which were 61% in 1995 reduced to 33%                                  vehicles but this is not reflected in statistics, policies,
in 2002.7 HCMC now has one of the highest motorcycle                                   strategies and investments. The traditional transport
ownership per land area in the world.                                                  demand models usually take into account only motor
                                                                                       vehicle ownership and motor vehicle trips and not the
                                                                                       non-motorized modes, which results in recommendations
                                                                                       that are strong in terms of improving the level of service
                                                                                       for motorized travel.

A significant number of bicycles do exist but are not reflected
in transport statistics
Source: Clean Air Asia

6.   Phi (2011)

7.   The Master Plan of Urban Transportation for Hanoi City (1997), JICA and ADB-TA - 6416 (REG) : A Development Framework for Sustainable Urban Transport

                                                                                                                                                             3
50
45
40
35
30
25
% Households
20
15 INDIA
10 Urban
5 Rural
0
2001 2011 2001 2011 2001 2011
BicycleT
Bicycle wo-wheeler
Two Wheeler Car
Car
Figure 4: Vehicle ownership in India between 2001 and 20118
Xianyang,2006 80
Jiaozuo,2005 80
Luoyang,2006 76
Nanchang,2005 73
Zhengzhou,2005 71
Jinan,2004 71
Bikaner,2007 65
Raipur,2007 63
Chongqing,2002 63
Changzhi,2006 60
Shimla,2007 59
Dongguan,2006 58
Patna,2007 57
Pondicherry ,2007 55
Weihai,2006 53
Madurai,2007 52
Amritsar,2007 52
Beijing,2005 52
Nagpur,2007 49
Bhubaneshwar,2007 49
Kanpur,2007 48
Agra,2007 48
Thiruvananthapuram,2007 45
Urumqi,2006 44
Surat,2007 43
Bhopal,2007 43
42
Hubli/Dharwad,2007 42
Varanasi,2007 41
Chandigarh,2007 41
Xi'an,2006 39
Jaipur,2007 39
Guangzhou,2005 38
Panji,2007 37
Ahmedabad,2007 36
Shanghai,2004 36
Mumbai,2007 33
Delhi,2007 33
Bangalore,2007 33
Pune,2007 33
Chennai,2007 31
Hyderabad,2007 31
Kolkata,2007 30
Linfen,2006 26
Kochi,2007 21
01 02 03 04 05 06 07 08 09 0
%
Figure 5: NMT Mode Share in Selected Asian Cities
Sources: Ministry of Urban Development in China, World Bank, Clean air Asia and ADB
8. http://censusindia.gov.in/
4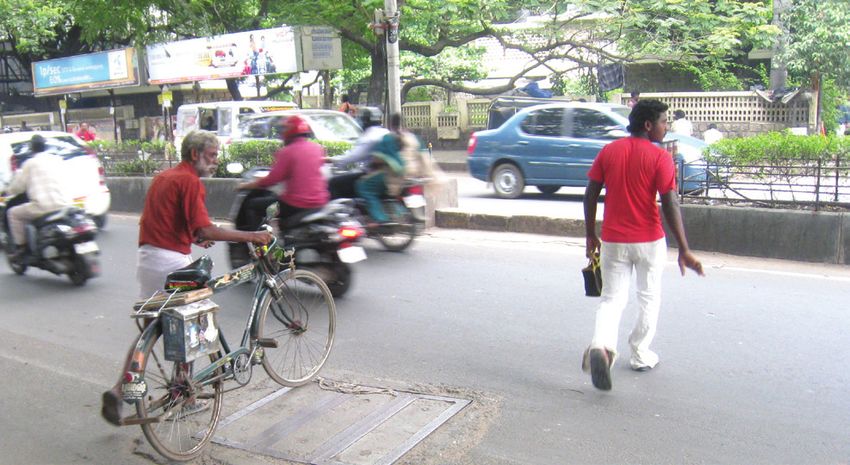
A recent study conducted by the World Health Organiza- Pedestrian perception surveys were carried out by Clean
tion (WHO, 2013) on global road safety concluded that Air Asia across thirteen cities in Asia, reaching a total of
“Only 68 countries in the world have national or local 4,644 pedestrians (Leather, et al., 2011).Survey results
level policies that promote walking and cycling.” The ab- reveal that if the walking environment is not improved,
sence of such policies will contribute to the continued de- 81% voiced that they will shift to other modes when they
cline of NMT trips and shifts to private motorized modes. can afford to; 25% to cars and 13% to two-wheelers.
In Asia, motorized congestion facilitated the shrinking of This means that policy makers have a short window of
space allocated to pedestrians and cyclists. Considering opportunity to reclaim the streets and translate the
the deterioration of facilities and shift of people to mo- existing transport network to more sustainable forms.
torized modes, it would be apt to say that pedestrians
and cyclists are victims of policy neglect.
1000 915
900
800 755
671
700
600 489 478
500
400 290
300
200
100
0
Figure 6: Shift to Other Modes if No Improvement is Done on the Walking Facilities
Sources: Clean Air Asia
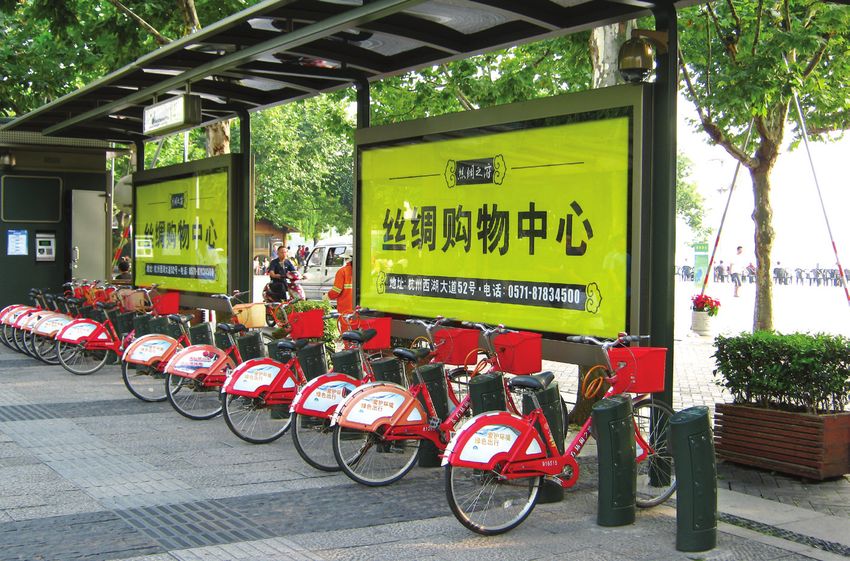
bike sharing station in Hangzou
Source: Clean Air Asia
5
“It is a paradox that walking and cycling provide mobility to a large segment of the society
and generally the poor who are the most vulnerable in the transport system rely on use
of walking with cycling and bus for daily transport. However the current infrastructure
which supports walking and cycling is very poor. Reports suggest that the percentage of
roads with pedestrian footpaths runs to hardly 30% in most cities. Loss of accessibility
due to poor infrastructure allows victimizing the vulnerable in the transport system. There
is an urgent need to change this paradigm. It is clear that non-motorized transport should
become the first step in an enlightened urban transport policy. It is important to know
what pedestrians/cyclists need from the government and what the infrastructure actually
provides so as to understand the implications and plan for the future.”
                                                                                                  - Prof Madhav Badami

1.3 NMT Accidents and Fatalities
A recent publication from WHO suggests that 27%                It is interesting to note that pedestrians and cyclists
of all traffic fatalities globally are pedestrians and         constitute a higher share of total fatalities in cities
cyclists. Almost half of the world’s road traffic fatalities   where facilities do not match the needs of users nor
of approximately 1.3 million people are pedestrians,           meet the demand. For example, although the national
cyclists and motorcyclists, and more than 90% occur in         pedestrian fatality share in India is 13% of road accidents,
developing countries (WHO, 2009). The WHO study which          metropolitan cities like New Delhi, Bangalore and
analyzed policies around the world related to road safety      Kolkata have pedestrian fatality shares greater than 40%.
suggested that:                                                Similarly, in Kathmandu, pedestrians represent 40% of all
                                                               road accident fatalities in the city in 2001 (KVMP, 2001).
“Our roads are particularly unsafe for pedestrians, cyclists
                                                               In Ulaanbaatar, Mongolia, 80% of the reported traffic
and motorcyclists who, without the protective shell of a
                                                               fatalities are pedestrians (Government of Mongolia,
car around them, are more vulnerable. These road users
                                                               2007).9 The problem is even more severe when the impact
need to be given increased attention. While progress has
                                                               on most vulnerable groups in society, such as children
been made towards protecting people in cars, the needs
                                                               and the elderly, is assessed. For example, in Bangalore,
of these vulnerable groups of road users are not being
                                                               elderly people and school children comprise 23% of the
met.”
                                                               fatalities and 25% of the injuries. It is also worth noting
                                                               that injuries for traffic accidents are typically under-
                                                               reported. The actual values are likely to be higher than
                                                               the reported ones.

Missing links in infrastructure aiding pedestrian injury and
death in Bangalore
Source: Clean Air Asia

9.   From 2000 to 2007

6
NMT Fatality share(2010)
Thailand
Sri Lanka
Singapore
Republic of Korea
Pakistan
Maldives
Malaysia
Japan
Indonesia
India
China
Bangladesh
Figure 7: NMT Fatality Share of Road Accident Fatalities in Figure 8: How Lack of NMT Facilities Induce Increased
Selected Asian Countries Exposure of NMT Facilities and Vice-versa
Sources: World Health Organization. Global Status Report on Road Safety Source: Clean Air Asia
1.4 Air Pollution Exposure
The 2010 Global Burden of Disease (IHME, 2013) states exposed to high levels of traffic-related air pollution
that most countries experienced an increase in disease (HEI, 2010). Considering the high density in many Asian
burden due to non-communicable diseases from 1990 to cities, the percentage of people walking, living or
2010. Exposure to air pollution such as particulate matter, working within high exposure zones is likely to be higher.
contribute to those non-communicable diseases as well. Pedestrians are exposed to very high levels of air pollution
Outdoor air pollution is one of the leading causes of when they walk along these busy roads, very close to the
deaths globally and ranks fourth in China with 1.2 million emissions from vehicle tailpipes. In a study conducted by
estimated premature deaths and 25 million healthy the East-West Center (2007) in Hanoi, pedestrians were
years of life lost, which is a 33% increase in the burden found to be exposed to 495 µg/m3 of PM10, motorcyclists
of disease attributable to ambient air pollution in China to 580µg/m3, and car drivers to 408µg/m3 and bus
over the past twenty years.10 Road injuries are also one of passengers to 262µg/m3; all of which are way above the
the dominant and rising causes of premature death and WHO guidelines for levels of PM10 of 20 µg/m3 (World
disability in countries such as India. Health Organization, 2006).
The figure below shows how the lack of appropriate non-
motorized facilities can spur a vicious cycle of making
people want to shift to motorized modes and increasing
the exposure of pedestrians and cyclists to pollution and
vehicular accidents.
A special report of the Health Effects Institute (HEI, 2010)
synthesizes the best available evidence on the assessment
of exposure to traffic-related air pollution. It concluded
that the high exposure zone to traffic emissions stretches
up to 300 to 500 meters from highways or major roads
(the range reflects the variable influence of background
pollution concentrations, meteorological conditions, and
season). The study also estimated that 30% to 45% of Pedestrians walk beside the vehicle tailpipe, travel at slow
people living in large North American cities live within speeds and have high exposure rates to pollution
such zones (HEI, 2010). Estimates made for Delhi and Source: Clean Air Asia
Beijing show 55% and 76% of the population within 500
meters of a freeway and 50 meters of a major road likely
10. http://www.healtheffects.org/International/HEI-China-GBD-PressRelease033113.pdf
71.5 Transport Energy Consumption and Bank, 2010). In most transport assessment frameworks,
Emissions however, many of the benefits of NMT are considered as
indirect and hence not considered in the evaluations.
Transport accounts for 62% (2011) of global oil
consumption and nearly 26% of world energy use
Benefits Co-Benefits
(International Energy Agency, 2013). The latest IEA
projections suggest that CO2 emissions from transport Improved NMT • Improved user convenience and
are expected to rise by 70% by 2050 compared to 2010 Conditions comfort
levels and majority of this growth to occur in developing • Improved accessibility for non-
countries despite ongoing vehicle technology and fuel- drivers, which supports equity
economy improvements. It has been established that objectives
transport CO2 emissions in Asia have increased at a higher • Higher property values
rate compared to Gross Domestic Product (GDP) growth
Increased NMT • User enjoyment
and that transport in developing countries is responsible Transport Activity
• Improved public fitness and
for up to 70% of air pollution in some cities in Asia. health
• Increased community cohesion
1.6 Impact of Improved Walking and (positive interactions among
Cycling Facilities neighbors due to more people
walking on local streets) which
tends to increase local security
A large body of literature concentrates on the benefits of
walking and cycling for users, stressing that it is not just a Reduced Automobile • Reduced traffic congestion
means of mobility but also a physical activity. The World Travel
• Road and parking facility cost
Health Organization estimates that physical inactivity savings
is responsible for the following global disease burdens: • Consumer savings
27% of diabetes, 30% of ischemic heart disease, and • Reduced chauffeuring burdens
21 to 25% of breast and colon cancers. Users of bicycles • Increased traffic safety
and people who walk are indeed reported to be fitter, • Energy conservation
less obese with reduced risks of cardiovascular diseases • Pollution reductions
compared to users of motorized transports(Reynolds, • Economic development
Winters, Ries, & Gouge, 2010).
More Compact • Improved accessibility,
In a recent article in The Lancet11 on health impact, Communities particularly for non-drivers
alternate transport scenarios were estimated in London • Transport cost savings
and Delhi. It was found that for Delhi, the cleaner motor • Reduced sprawl costs
vehicles and increased active travel scenarios (walking • Open space preservation
and cycling) resulted in a greater health gain from • More livable communities
reduced air pollution than for London. Authors estimated • Higher property values
that the reduction in CO2 emissions through an increase
in active travel and less use of motor vehicles had larger Table 1: Benefits of Walking and Cycling
health benefits per million population (7,332 disability- Source: Litman, 2013
adjusted life-years [DALYs] in London, and 12,516 in Delhi
in 1 year) than from the increased use of lower-emission 1.7 Growth of Public Bike Share Schemes
motor vehicles (160 DALYs in London, and 1,696 in Delhi).
Maximum benefits can also be gained with a combination There has been an explosive growth in the number of
of active travel and lower-emission motor vehicles notably bike share schemes (Midgely 2011, Larsen 2013). This
from a reduction in the number of years of life lost from massive interest in bike share schemes can translate to a
ischemic heart disease (10-19% in London,11-25% in bike revolution if Asian cities support this initiative with
Delhi).A recent publication of the Asian Development the right planning and a bold vision. Bike share systems
Bank showed that NMT projects would be economically with the latest technology and branding are transforming
feasible even if the emissions benefits are quantified mobility in many cities (Beroud and Anaya 2012). Bike
and converted to economic terms (Asian Development share systems have evolved in last four decades - from
11. Public health benefits of strategies to reduce greenhouse-gas emissions: urban land transport
8simple, differently painted, free-to-use bicycles to coin- consider the future growth of vehicles, subsequent con-
operated locking to third generation systems using card gestion and future infrastructure investment required
reading technology (Shaheen, Guzman, Zhang 2010). By to realize the impact of such systems. To understand the
2013, about 500 cities are facilitating bike share schemes scale of growth, the Hangzhou system alone operates
with over 500,000 bicycles (Larsen, 2013). 697,000 public bicycles and 2,962 service stations across
the city, with an average of 257,500 trips per day. The
highest rental record is 378,500 trips in a day (Yiqi, Lin, &
Jingxi, 2013).
Figure 9: Number of bike sharing schemes implemented per
continent
Source: http://bike-sharing.blogspot.in/ Bike Sharing Station in Hangzhou
The recent schemes are formulated with the philosophy 1.8 Summary
of collaborative consumption and are attractive because
they work best for short trip lengths, help reduce This chapter introduced the motivations for promoting
congestion and improve the health of citizens. Many non-motorized transport in Asia. Section 1.1 discussed
believe that like the Bus Rapid Transit System (BRTS), urbanization and transport in Asia. The region is grow-
these systems have the potential to transform public ing fast and more than half of the Asian population will
transport and also help in evolving public acceptability of live in urban areas within the next fifty years. Demand
bicycles as a means of active transport. for mobility is increasing as population is also increasing.
Section 1.2 discussed the effects of unplanned urbaniza-
Statistics (Shansan & Schroeder, 2010) reveal that while
tion on mobility: People have stopped walking and have
the bike-share programs bring substantial numbers of
depended on cars for mobility needs. A large fraction of
new bicycle riders, such schemes do not have a significant
Asian cities have been designed to support motorized
impact in reducing congestion. The evaluation of differ-
transport, becoming increasingly fuel-dependent, in-
ent schemes suggests that a substantial number of public
creasing pollution exposure and road risk, and dissuading
bicycle riders earlier made bus trips (46%).
people from using more sustainable forms of transport.
The approximate shift from cars, two-wheelers and tax- These issues were discussed in detail in Sections 1.3 to 1.5.
is is found to be only 12%. However, one also needs to
In Sections 1.6 and 1.7 co-benefits of NMT are outlined
Largest Bike Sharing Programs Worldwide August 2013 to emphasize the efficacy of NMT as a remedy to
transport problems. Section1.7 provides an example of an
Series1
Zhuhai 5,000
5,000
Guangzhou 5,000 implemented and growing NMT program: the public bike-
Montreal 5,120
New York 6,000 sharing scheme. This has been successfully implemented
Barcelona 6,000
Zhongshan 7,000 in various Asian cities such as Hangzhou, China.
Foshan (Guicheng) 7,000
Xuzhou 7,500
Foshan (Chancheng) 7,600 Chapter 2 will present the transportation planning process
London 8,000
Wenzhou
Taizhou (Jioajiang)
10,000
10,000
and how to incorporate NMT into the process. Visioning
Quingzhou
Huizhou
10,000
10,000
will also be introduced as an important step for ensuring
Taiyuan 15,000
Shanghai (Minhan g) 19,170 public participation. Tools will be provided for assessing
Zhuzhou 20,000
Paris 23,900 walkability and cyclability. These tools are intended
Hangzhou 69,750
Wuhan 90,000 for planners, policy makers and decision makers alike.
Figure 10: Bike Population in Bike Sharing Programs
Finally, this chapter will share some experiences about
Worldwide the implementation of NMT strategies in various cities in
Source: Earth Policy Institute Asia to establish a range of city and country perspectives.
92. How to Improve NMT in
Asian Cities?
2.1 The Transportation Planning Process
Regional Vision and Goals
Saf
ety
int Visioning and Goal Se ng
tra
ns
l Co Alternate Improvement Strategies Determine the vision for the future of transport and society
A
ca
Stakeholder Engagement
Capital
ir
s
Fi
Q
ua
Include NMT in the Transport Strategy
lit
y
t
Make NMT strategies part of the alterna ves
en
Strategies
opm
Economic Devel
Non D Assessment and Diagnosis of NMT Applicability
Plan Assess walkability and cyclability of area being planned
iscriminatio
Implementa on of NMT Strategies
Public Par cipa on
Improvement Programs
Adopt NMT strategy
n
nt
me
Project Development Monitoring and Evalua on
ve
Use data and feedback mechanisms to monitor and evaluate NMT
vol
En
impact for further improvements and replanning
In
vi
c
i
ro
bl nm
Pu en
ta
l Is
Da
ta su
es Replanning, Adjustment and Feedback
Figure 11: The transportation planning process Figure 12: A hypothetical integration of NMT into the
transportation planning process
Source: Transportation Planning Capacity Building Program, 2007
Source: Clean Air Asia
Part of an effective adoption of NMT is integrating the The importance of stakeholder engagement and public
concept into transportation planning. participation into any planning process cannot be em-
phasized enough. NMT cannot succeed without involving
Planning in general is an iterative thought process for
important sectors of society and without raising aware-
creating future development scenarios. There is no single
ness and cooperation from the people.
model that solely describes the transportation planning
process. However, the key steps are similar across all
models. Figure 11 shows an example transportation
2.2 Visioning
planning process used by the United States Transportation Visioning is just as important as technical assessment and
Planning Capacity Building Program. evaluation: What kind of society do the people see for
themselves in the future? Will people walk or drive cars in
The basic parts of transportation planning process are as
the long term? Do the people want to have enough bike
follows:
lanes and pedestrian lanes? It is important to visualize
1) Visioning and Goal Setting
the future, ensuring that the vision is from the people.
2) Generation of Alternatives Visioning is a process that ensures that the application of
3) Evaluation, Diagnosis and Assessment of Strategies any strategy is socially inclusive and that public interest
is upheld.
4) Implementation of Strategy
A vision of a compact and healthy city does not equate to a
5) Monitoring and Evaluation
car-based city.12 A clear vision of what the city should look
NMT can be integrated into the transportation planning like in the future is needed. What a livable city constitutes
process. Figure 12 shows a hypothetical integration of is determined by what type of city its citizens want to live
NMT into the transportation planning process. in. To understand that perspective, consultations have to
12. CAI-Asia (Clean Air Asia) Sustainable Urban Mobility in Asia(SUMA) Programhttp://cleanairinitiative.org/portal/whatwedo/projects/SUMA
10be conducted with relevant government agencies and 2.3 Diagnosis - How to Assess Walkability
stakeholder groups that influence their decisions, such
as community groups, residential welfare associations, Several methodologies are available to assess walkability
private sector, non-government organizations (NGOs), and they vary in several respects: the emphasis in
academic and research institutions, and development qualitative or quantitative assessment, components
agencies. The engagement process is helpful as it brings covered in the assessment, sampling and scoring methods.
together groups who would otherwise not meet. This For example, the Ministry of Urban Development (MoUD)
helps develop an understanding of each stakeholder’s of the Government of India uses a walkability index that
specific limits, needs, and difficulties and defuses conflicts. is a function of the availability of footpaths and rating
of pedestrian facilities (Ministry of Urban Development,
2008). Using this walkability index, MoUD assessed the
quality of pedestrian infrastructure of thirty cities in
2008 and found an average index of 0.52 (out of 1). The
facility rating is determined with an urban transport
benchmarking tool that uses three indicators: signalized
intersection delay(seconds) per pedestrian, street lighting
levels (Lux) and percentage of the city covered with
footpaths wider than 1.2 meters. The limitation of this
methodology is that it is difficult to assess what parameter
needs improvement, such as safety, security, amenities,
disability infrastructure, among others.
Carless day in Manila: The activity allows for public
participation, engagement and awareness about NMT
Source: Clean Air Asia
The aim of this consultation is to determine what the
people desire as the characteristics of a livable city they
want to live in. These will vary between cities, however,
common characteristics are: accessibility of all citizens
to work, education, healthcare and other places of
importance to them, sufficient public spaces for relaxation Figure 13: Snapshot of Walk Score Application and Ratings in
Asia
and recreation, security and safety, a green environment
and clean air. This vision has consequences on land use
Similarly, a popular website, “walkscore.com” calculates
planning, covering amongst others, office buildings,
an area’s walkability based on the distance of residents’
public spaces, residential areas and the transport
houses to nearby amenities (Walk Score, 2013). Using
system that connects them. Consequently, it will help in
this scoring system, Pune in India is considered a walker’s
identifying relevant transport policies and projects that
paradise whereas Bangkok, Beijing and Cebu are
should be given priority in terms of NMT promotion. It
considered car-dependent cities. Although walkscore.
is essential to involve a diverse set of stakeholders for
com measures how easy it is to live a car-free lifestyle and
consultation and dialogues in obtaining feedback on
considers how dense the land use is (which can reduce trip
policies and projects. The feedback will in turn be used
lengths), it does not include a qualitative assessment of
for further feasibility analysis.
pedestrian facilities like street width, block length, street
While planning and promoting NMT in cities, consultations design, traffic and crime safety, among others. As a result,
with stakeholders should not end with the visioning many Asian cities can have high scores in walkscore.com
process but needs to be continued while designing, because of the traditionally mixed-use character of the
constructing and monitoring projects to develop a cities and high density, but this does not mean that these
continuous stakeholder engagement. cities are easy to walk in.
11An example for more in-depth methodology is Transport A good example for a comprehensive yet simple
for London’s Pedestrian Comfort Guidance 2010. The methodology is the Global Walkability Index developed
assessment comprises of a 3-step process: by H. Krambeck for the World Bank which provides a
qualitative analysis of the walking conditions including
1. Assess footway comfort which is sub-divided into:
safety, security, and convenience of the pedestrian
a) Site selection, site visit and selection of location,
environment. It consists of a field walkability survey to
b) Categorization of area type, assess pedestrian infrastructure in four areas: commercial,
c) Activity data (measurement) collection, residential, educational, and public transport terminals.
The survey identifies pedestrian preferences, and
d) Spreadsheet assessment,
analyzes government policies and institutional setup in
e) Review and interpretation of results, support of walking. The methodology is qualitative but
2. Assess crossing comfort, and because it encompasses several key parameters, provides
a good insight into the current state of the walkability
3. Review impact scheme.
environment, and enables the identification of areas for
The survey, however, does not consider the qualitative improvement.
parameters such as maintenance, cleanliness and others.
The Clean Air Asia Walkability Index is the Global
It is an in-depth assessment of streets, sites, looking into
Walkability Index modified to suit the Asian context. In
pedestrian volume, width, obstructions, among others
this assessment, areas with high pedestrian volume are
aspects, in different land use types such as i) high street,
selected based on preparatory surveys and consultation
ii) office and retail, iii) residential, iv) tourist attraction,
with local partners. Complete route assessments are
and v) transport interchange. The data collected from the
conducted by following logical pedestrian routes in the
field is entered into specially-designed excel spreadsheets
specific areas linking origins to destinations. Complete
which provide outputs in the form of scores of A, B, C,
route assessments are also conducted to provide a
D, E with A being the most comfortable walkway. The
holistic overview that links design and execution to
main objective of the assessment is to influence and bring
user perception and the built environment. In order to
about changes in the design of walkway and crossings
facilitate comparisons among cities, the field survey uses a
alike, such as increasing the signal timing, providing
uniform rating system for all nine qualitative parameters
a larger island, increasing the width of the walkway,
(Table 2).
among others, and to open dialogues with authorities.
The Clean Air Asia Walkability Index method of deriving a
The Institute for Transportation and Development
“Walkability Rating” differs from the Global Walkability
Policies’s (ITDP) Better streets, better cities is a guide
Index (GWI). The GWI takes into account the number of
to street design using the concept of complete streets,
people walking (pedestrian count) during the time of
providing equitable space to all road users. A prerequisite
the survey and the length of the stretch being surveyed.
for the design process is comprehensive data collection
While the Clean Air Asia Walkability Index methodology
and assessment. It involves a topographic survey of the
documents street lengths and pedestrian counts, it
street to identify physical entities such as buildings, roads,
excludes these two factors from the rating to eliminate
trees, electric posts and with the help of the pedestrian
the inherent bias generated by the number of people
activity survey collects information on usage of walkways
walking on a certain stretch and its length. For example,
and crossings, presence of vendors and other activities
a stretch with adequate infrastructure and very high
that occur on the street and influence design.
pedestrian traffic should not receive a higher rating
than a high-quality stretch with low pedestrian traffic.
Utilization by itself should not be a parameter to assess
the walkability of a certain area because it penalizes
good areas with lower utilization rates. Current levels of
pedestrian traffic are more useful in identifying priority
areas for improvement (e.g. areas with high pedestrian
traffic but with low walkability ratings). This argument
also holds true for distance. A relatively short but high
quality stretch of footpath should not be penalized
because it is shorter.
Source: Clean Air Asia
12A good example for a comprehensive yet simple facilitate comparisons among cities, the field survey uses a
methodology is the Global Walkability Index developed uniform rating system for all nine qualitative parameters
by H. Krambeck for the World Bank which provides a (Table 2).
qualitative analysis of the walking conditions including The Clean Air Asia Walkability Index method of deriving a
safety, security, and convenience of the pedestrian “Walkability Rating” differs from the Global Walkability
environment.13 It consists of a field walkability survey to Index (GWI). The GWI takes into account the number of
assess pedestrian infrastructure in four areas: commercial, people walking (pedestrian count) during the time of
residential, educational, and public transport terminals. the survey and the length of the stretch being surveyed.
The survey identifies pedestrian preferences, and While the Clean Air Asia Walkability Index methodology
analyzes government policies and institutional setup in documents street lengths and pedestrian counts, it
support of walking. The methodology is qualitative but excludes these two factors from the rating to eliminate
because it encompasses several key parameters, provides the inherent bias generated by the number of people
a good insight into the current state of the walkability walking on a certain stretch and its length. For example,
environment, and enables the identification of areas for a stretch with adequate infrastructure and very high
improvement. pedestrian traffic should not receive a higher rating
The Clean Air Asia Walkability Index is the Global than a high-quality stretch with low pedestrian traffic.
Walkability Index modified to suit the Asian context. In Utilization by itself should not be a parameter to assess
this assessment, areas with high pedestrian volume are the walkability of a certain area because it penalizes
selected based on preparatory surveys and consultation good areas with lower utilization rates. Current levels of
with local partners. Complete route assessments are pedestrian traffic are more useful in identifying priority
conducted by following logical pedestrian routes in the areas for improvement (e.g. areas with high pedestrian
specific areas linking origins to destinations. Complete traffic but with low walkability ratings). This argument
route assessments are also conducted to provide a also holds true for distance. A relatively short but high
holistic overview that links design and execution to quality stretch of footpath should not be penalized
user perception and the built environment. In order to because it is shorter.
Parameter Description
1. Walking Path Modal Conflict The extent of conflict between pedestrians and other modes on the road, such as
bicycles, motorcycles and cars
2. Availability of Walking Paths The need, availability and condition of walking paths. This parameter is amended from
the parameter “Maintenance and Cleanliness” in the Global Walkability Index
3. Availability of Crossings The availability and length of crossings to describe whether pedestrians tend to jaywalk
when there are no crossings or when crossings are too far apart
4. Grade Crossing Safety The exposure to other modes when crossing roads, time spent waiting and crossing the
street and the amount of time given to pedestrians to cross intersections with signals
5. Motorist Behavior The behavior of motorists towards pedestrians as an indication of the kind of pedestrian
environment
6. Amenities The availability of pedestrian amenities, such as benches, street lights, public toilets,
and trees, which greatly enhance the attractiveness and convenience of the pedestrian
environment, and in turn, the surrounding area
7. Disability Infrastructure The availability of, positioning of and maintenance of infrastructure for the disabled
8. Obstructions The presence of permanent and temporary obstructions on pedestrian pathways.
These ultimately affect the effective width of the pedestrian pathway and may cause
inconvenience to pedestrians
9. Security from Crime The general feeling of security from crime on a certain stretch of road
Table 2: Field Walkability Survey Parameters
13. More information on the Global Walkability Index is available at http://www.cleanairnet.org/caiasia/1412/article-60499.html
13Field surveyors rate the selected road stretches from 1 to more on objective measurements (presence of bike lanes,
5 for each parameter (1 being the lowest, 5 being the of traffic signals and so on).
highest) in each of the area types. The averages for each
of the parameters are translated into a rating system
from 0 (lowest score) to 100 (highest score). Walkability
ratings in the different area types in each city are derived
by taking the average of the individual parameters’
averages. The final city walkability ratings are derived
by averaging the walkability ratings in the different area
types in each city (see Annex B).
Bike crossings are as important as bike lanes
Source: Clean Air Asia
The Copenhagenize Index (http://copenhagenize.eu/) is an
Despite making the most trips, cyclists and pedestrians are
interesting ranking system developed jointly with James
marginalized on the streets
Source: Clean Air Asia Schwartz of the Urban Country (a bicycle transportation
blog). It focuses on major cities of all continents, from
One of the limitations of the field surveys is the subjectivity
New York to Rio de Janeiro, and from Tokyo to Dublin.
of responses as it influenced by the surveyor, especially
Cities were given between 0 and 4 points in 13 different
in the initial study of thirteen Asian cities that involved
categories by volunteers.
different organizations and individuals to carry out the
surveys. There needs to be a balance between accuracy, In addition, it uses a concept of bonus score (maximum
simplicity and resources availability. The methodology 12 points) to reward cities for extra efforts. In total a
adopted for the thirteen cities’ study is very economical maximum of 64 points are awarded which are later
and simple but less accurate when compared to many scaled to 100 points to determine the index. The
quantitative methodologies. The objective is that the parameters used are: advocacy, bicycle culture, bicycle
results need to give a clear enough indication about facilities, bicycle infrastructure, bike share programme,
the weak areas in the current pedestrian infrastructure, gender split, modal share for bicycles, and modal share
facilities, supporting policies and institutional set up, so increase since 2006, perception of safety, politics, social
that actions for improvement can be taken. acceptance, urban planning and traffic calming. The
Copenhagenize considers the current use of bicycles as a
A pedestrian preference survey was also prepared to
criteria for cyclability (“percentage of modal share made
capture the views of pedestrians. The survey consists of
up by cyclists”), while this may be redundant with all
a series of questions on age, income, travel patterns,
other categories that may already explain the poor/high
improvement preferences among others. The responses
current use of bikes in the city. The repetition may then
will help supplement the findings of the index survey.
exaggerate the scores of the city in focus.
The questionnaire is present as Annex E.
The US Department of Transportation checklist14 is
2.4 Diagnosis - How to Assess Cyclability a widely used toolkit to rate communities for biking
infrastructure. It was developed by the US Department
Similar to walkability indices/assessment tool, diverse
of Transportation in collaboration with the National
cyclability assessment tools and indices are available with
Highway Traffic Safety Administration and the Pedestrian
different degrees of development and sophistication.
and Bicycle Information Center. The primary objective of
While some use only a handful of criteria, others follow
this checklist is to help cyclists evaluate the cyclability of
an exhaustive list of indicators. While some rely on
their communities with minimal resources. It is a tool
subjective assessment (general impressions), others rely
14for evaluation of and improvement of existing bike The LGA checklist is divided into five sections (158 criteria):
infrastructure rather than a reflection of how to get non- • Strategy and Planning
bicycle users on the road, or on the relationship between
• Level of service
the spatial pattern of the city and bike use.
• Comfort and Attractiveness
The document basically consists of seven groups of
multiple answer questions which give a final score to rate • Safety
cyclability in the community (the scale is not specified), • Environment and Health
and a set of advice for bike users to improve cyclability.
The Route Based Checklist is divided into seven sections
The main questions posed are: (63 criteria):
• Did you have a place to bicycle safely? • Coherence
• How was the surface that you rode on? • Directness
• How were the intersections you rode through? • Comfort and Convenience
• Did drivers behave well? • Safety
• Was it easy for you to use your bike? • Intersections
• What did you do to make your ride safer? • Off-Road Paths (if applicable)
• Tell us a little about yourself. • End of trip facilities
The TravelSmart Toolkit was developed by the Bicycle This toolkit is very comprehensive and it focuses not only
Federation of Australia (BFA) for the Australian on infrastructure but also on the governance aspect of
Greenhouse Office in the Department of the Environment cyclability, such as involvement of the civil society and
and Heritage, with the endorsement of the Australian budgeting. The guide however does not propose to
Bicycle Council. This cyclability index can be understood include any mapped data analyses to combine these
as an improved version of the US Department of results with the land use context of the city, so there is a
Transportation checklist, being more extensive and lack of visual outcome.
functioning as a guide for cyclability assessment.
University of British Columbia’s Cyclability Index was
The objectives of the toolkit are: developed as a result of an academic exercise. This tool
To provide a simple, easy-to-use checklist that identifies is not a simple tool but a GIS-based extensive tool which
barriers and opportunities to create physical environments links the physical environment data analyses and opinion
which encourage cycling, and provides further resources survey findings. The first phase of the study consisted of
an opinion survey in the Greater Vancouver region. Data
• To allow local government to assess its strengths and
was collected from 2,149 adults from phone interviews
identify areas where improvement can be made to
in which origins, destinations and modes of travel per
encourage and promote cycling
weekly trips were reported for each individual. Results
• To provide ideas and ‘easy-to-access’ resources for from this opinion survey were jointly analyzed with the
further information built environment and helped identify features of the
The resource materials include references, guidelines built environment associated with a higher likelihood of
and other resources to assist in the implementation of cycling, versus driving. The survey also determined which
local cyclability audits and actions. The target audience components are deemed important to cyclists for cyclable
comprises four kinds of actors: local government, state neighbourhoods, and these results were further explored
government, developers and community. The TravelSmart at focus group discussions that considered each type of
Toolkit consists of two main checklist documents to bike user separately (regular cyclists, occasional cyclists
evaluate either the cyclability of the local government and potential cyclists).
area (LGA) or the cyclability of a specific route. Both come
in short and detailed versions.
14. http://www.nhtsa.gov/people/injury/pedbimot/bike/cyclability/checklist.htm
15A cyclability index was created out of the findings and 5 • University Locations: Universities and colleges are
main criteria were central: important bicycle destinations and trip generators.
College students, those that live within three miles
• Bicycle route density
of campuses, are more likely to use bicycles for
• Bicycle route separation
transportation and leisure activities.
• Connectivity of bicycle-friendly streets
• Population Density: The population density factor
• Topography corresponds to the relative population density within
• Destination density the city. Areas with more people but with more mixed
use per square mile have a great potential for bike
Cyclability maps of Metro Vancouver were made out of
riding and a greater need for bike facilities.
this index and confirmed by the objective findings of the
matching between GIS analysis and trip details. • Employment Density: Areas with high employment
density typical have high activity levels and closely
In the BikeScore approach, the philosophy of walkscore
spaced destinations for cycling trips.
is reflected in the bikescore concept(Walk Score, 2013).
Bikescore measures biking quality of a location on a scale • Job Housing Balance: This factor is related to
of 0 to 100 based on four equally weighted components: employment density but captures the bicycle potential
of areas with mixed use.
• Bike lanes
• Auto Access: Households with access to an automobile
• Hills
are less likely to use bicycles as their primary form of
• Destinations and road connectivity transportation.
• Bike commuting mode share • Proximity to Transit: Bicycle routes that connect
The score is derived based on the analysis of parameters housing and job locations to transit stops may
as described earlier based on GIS data provided by the city encourage transit ridership (Bernheim, 2004).
authorities. The outcome of the study is a map of San Jose showing
which roads should be prioritized in the Master Plan (and
the degree of priority, according to color gradients) for
future accommodation of bike users.
2.5 Cyclability Assessment Tool for Asia
Most Asian cities, though naturally built for non-
motorized transport, lack infrastructure and rarely use
scientific toolkits to create biking or cycling plans and
undertake policy and investment interventions to support
cycling. Clean Air Asia with support from UN-Habitat and
Shakti Sustainable Energy Foundation developed a toolkit
for assessing cyclability (Asian Cyclability Index) using a
similar approach to that of the Clean Air Asia Walkability
Index. The main objective was to develop a simple tool
Source: Clean Air Asia
which would aid both cyclists and policy makers.
Another interesting approach is the San Jose Index which Based on discussions with various partners, the following
is different from the approaches previously discussed. This philosophy was adopted in developing the Asian
index, developed in 2004 by transportation consultants Cyclability Index:
Fehr & Peers for the Bicycle Master Plan Process of San
“The index would assess the cycling friendliness or
Jose, California, mainly focuses on the bicycle potential
‘cyclability’ of a street. There are different levels the
of future bike lanes or paths. Using GIS software
‘cyclability’ can be assessed, such as at the city level, the
programs, developers used demographic and social data
neighborhood level or the street level. Here, the street
to determine the bicycle potential of roads. The main
level is chosen as this is the basic unit at which the
indicators chosen are:
assessment can be carried out. A neighborhood score is
16considered as a sum of many streets and a city is a sum of the parameters were dropped and some included in the
its neighborhoods. Moreover, to look into the facilities interview survey. Some of findings of the response survey
aspect, such as cycle tracks, shade, lighting, traffic are:
calming, crossings, perception of security and such others
1. Nearly 37% of responses came from people who
can be assessed better on a street level than at a much
do not cycle and 63% responses from people who
larger level. The functional linkage between corridors
bike/cycle more than once a week. About 33% of
and network would be captured with a cyclist interview
respondents ride the bicycle 5 times or more a week.
survey.”
2. Responses from Bangalore city were the highest
To arrive at the cyclability index, two survey instruments
comprising 27%. Metro Manila, Beijing and New
are to be completed: cyclability index survey (Annex C)
Delhi were next with 15%, 11%, 10% respectively.
and cyclist perception survey (Annex D).
Responses from 21 cities of developed countries and
There are sixteen parameters considered in the Cyclability 55 of developing countries were received. Of the
Index Survey: 250 responses, 82% of the respondents came from
i) Conflict with other modes, ii) Availability of Cycle developing cities while the remaining 18% came
Tracks, iii) Behavior of motorists, iv) Lighting, v) Quality of from developed cities. This represents a good mix as
Riding surface, vi) Crossing points, vii) Availability of cycle the focus is on promoting cycling in the developing
parking, viii) Shaded lanes, ix) Exposure to air pollution, cities, especially in Asia.
x) Traffic calming measures, xi) Connectivity of street 3. 76% of respondents were male and 24% were
network, xii) Sign boards and marking, xiii) Connectivity female. While there were not many significant
with other modes, xiv) Presence of service shops, xv) differences in the preferences between men and
Priority at junctions, and xvi) Perception of security (see women, the requirement of lighting scored higher
Table 3b for a description of each parameter).The rating for women (55% rating it 5 than 35% men rating it
system for each parameter is 0 to 4, with 0 being the 5). Conflict with other modes, 71 % women rated it
lowest indicating poor facilities. The total score obtained 5, while 60% men did so. This means that safety and
from all the parameters are summed and converted into security were primary factors for women.
a score out of 100.
4. Most of the respondents ranged from 20- 35 years
Apart from the index survey, a Cyclist Perception Survey of age; 4% of the respondents were 60+ years of
was also developed to understand the needs of the age and 2% were less than 20. This means that the
cyclists. The survey is a questionnaire that captures details survey did not capture schoolchildren who could be
such as age, origin, destination, travel time, income, travel a primary group of bike users. It is recommended to
characteristics, preferences, among others. Completion of consider interviewing school children to get their
the Cyclist Perception Survey is independent of the index insights during cycling preference survey.
survey but will help in providing better insights of what
5. Detailed ratings on several parameters are shown
cyclists feel and what improvements they would like to
in the chart below. It is interesting to note that top
see in cycling facilities. See details in Annex D.
priorities or top parameters which dictate good
The succeeding paragraphs tell the story of how the Asian cyclability in developing cities are - conflict with
Cyclability Index was developed. other modes, availability of cycle tracks, priority at
Based on the review of various methodologies discussed junction, air pollution exposure, motorist behaviour,
earlier, an initial list of twenty-two parameters to assess connection with public transport have received
cyclability was arrived at (see Table 3a). An online overwhelming majority. In comparison, cyclists in
survey was then conducted to capture insights from developed cities were concerned about conflict,
respondents in different countries on which parameters availability of cycle tracks, behaviour of other
they considered most important. Respondents were motorists, lighting etc.
asked to rate each parameter on a scale of 1 to 5, with
5 being most important and 1 being least important.
Almost 250 responses were received, of which 189
were complete responses while others were incomplete
with only few parameters being rated. Based on the
responses or people’s priority which scored low, some of
17You can also read