Prospective Environmental and Economic Assessment of a Sensor Network
←
→
Page content transcription
If your browser does not render page correctly, please read the page content below
sustainability

Article
Prospective Environmental and Economic Assessment of a
Sensor Network
Francisco Portillo             , Rosa María García * , Alfredo Alcayde                , José Antonio Gázquez            , Manuel Fernández-Ros
and Nuria Novas

                                          Department of Engineering, University of Almeria, ceiA3, 04120 Almeria, Spain; portillo@ual.es (F.P.);
                                          aalcayde@ual.es (A.A.); jgazquez@ual.es (J.A.G.); mfernandez@ual.es (M.F.-R.); nnovas@ual.es (N.N.)
                                          * Correspondence: rgarciasalvador@ual.es

                                          Abstract: Sustainability is becoming of vital importance in project management, and a life cycle
                                          assessment (LCA) can ensure a body of knowledge to bear in mind the environmental burdens
                                          the project involves. In this study, two different ways of supplying energy to a sensor network are
                                          analyzed. Firstly, we analyze the environmental impact of the devices connected to the public grid.
                                          Secondly, we analyze the completely full off-grid system, with the sensor connected to a photovoltaic
                                          (PV) panel. Our findings show that the off-grid option has a greater number of benefits than the grid-
                                          connected option in terms of environmental impacts, although it is less economically advantageous.
                                          In a detailed analysis of the off-grid scenario, it can be observed that the battery is the component
                                          with the highest impact, so actions to try to reduce consumption, and, therefore, the battery size and
                                          its negative impact are taken. After reducing the battery size, the break-even point was reached,
                                providing a net economic benefit of EUR 0.23 sensor/year. However, this analysis refers to a single

                                          sensor, and although the environmental and economic benefits seem low, in an economy of scale, this
Citation: Portillo, F.; García, R.M.;     could result in large savings if these types of sensors are massively installed.
Alcayde, A.; Gázquez, J.A.;
Fernández-Ros, M.; Novas, N.              Keywords: life cycle assessment; product environmental footprint; life cycle cost; sensor network; sus-
Prospective Environmental and             tainability
Economic Assessment of a Sensor
Network. Sustainability 2021, 13,
10306. https://doi.org/10.3390/
su131810306
                                          1. Introduction
Academic Editor: Adriana Del Borghi             In the past few decades, there has been an increase in the literature that studies the
                                          environmental analysis of products, technologies, or services. Some of the common aspects
Received: 15 July 2021                    have focused on a greater comprehension and consciousness of the environmental impacts.
Accepted: 9 September 2021                The increasing demand for services and infrastructure of current society is essential for the
Published: 15 September 2021              social progress and economic development of the countries [1], but this, in turn, is causing
                                          environmental issues. This supposes a real challenge for the present generation. In that
Publisher’s Note: MDPI stays neutral      sense, sustainability is becoming a core element of a new thinking for achieving the target
with regard to jurisdictional claims in   of reducing impacts [2]. To meet the goal of sustainability, appropriate assessment tools
published maps and institutional affil-   are required, and a basic and extended tool used for this type of studies is the Life Cycle
iations.                                  Assessment or LCA [3].
                                                The use of LCA has expanded rapidly, especially in a comparative context between two
                                          products or services. It has supported the selection of better environmentally alternatives,
                                          promoting eco-design principles and recognizing the potentially largest environmental
Copyright: © 2021 by the authors.         impacts [4]. The first application of a (partial) LCA can be traced back to 1969. In that
Licensee MDPI, Basel, Switzerland.        year, Coca-Cola evaluated the consumption of resources and emissions from beverage
This article is an open access article    packaging. The company analyzed the possibility of using returnable glass bottles instead
distributed under the terms and           of disposable plastic containers. They traced the complete process, analyzing the whole
conditions of the Creative Commons        life cycle (from raw material origin to final waste disposal) and provided a quantitative
Attribution (CC BY) license (https://     analysis to be able to compare these two options. This assessment is identified as one of
creativecommons.org/licenses/by/          the first LCAs [5].
4.0/).

Sustainability 2021, 13, 10306. https://doi.org/10.3390/su131810306                                      https://www.mdpi.com/journal/sustainability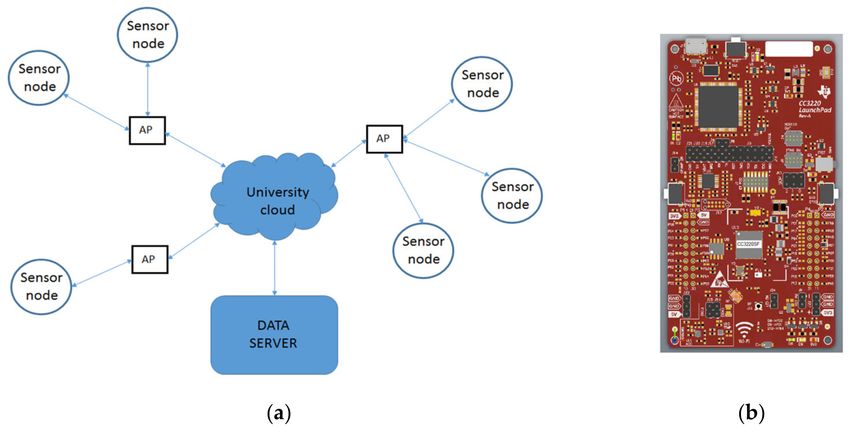
Sustainability 2021, 13, 10306                                                                                              2 of 19

                                       However, the focus of LCAs has recently expanded from elementary products to more
                                 sophisticated ones, and from local decisions to strategic policies. According to Heijungs
                                 et al. [6], the scope of LCA has also changed from an environmental assessment to a
                                 sustainability study, and the spectrum of the impact categories targeted has progressively
                                 increased, especially in the environmental domain: from a basic evaluation of waste and
                                 energy, to acidification, human toxicity, ozone depletion, resource and water use, etc.
                                       Life cycle costing (LCC) is another life cycle analysis for a product or service, but it is
                                 focused on the monetary costs involved, from the conception of the idea until the end of its
                                 useful life. Apart from the initial investment, it also considers the long-term expense of
                                 owning and operating a project. One perspective only from the customer’s point of view is
                                 called the total cost of ownership (TCO) and only takes into account the life cycle cost of
                                 the product or system after its purchase by an organization [7].
                                       LCC is older than LCA [8], but the concept of matching LCA and LCC in a more
                                 comprehensive analysis is relatively new. An environmental LCC can be performed
                                 alongside LCA, using the same system boundaries and models. This enables the economic
                                 evaluation of a product or service from a systems perspective [9]. Thus, combining LCA
                                 and LCC analysis has become a powerful tool to obtain knowledge of a product or process
                                 for decision making to:
                                 •    Reduce the environmental impacts by reducing the energy consumption, the use of
                                      raw materials, pollutant emissions, etc.;
                                 •    Identify possible improvements in the system (hotspots);
                                 •    Improve the brand image through Corporate Social Responsibility strategies.
                                       Therefore, the consolidation of environmental requirements in concert with the tra-
                                 ditional criteria in product design is becoming of crucial importance as a mechanism to
                                 guide the decision-making process in private companies [10–15].
                                       As a society, we need to raise our actions to influence decisions that lead human
                                 development towards sustainability, and in addition to private companies, governments
                                 are a key player to achieve these goals. Nowadays, public administrations around the
                                 world encourage the application of LCA and LCC principles, so much so that they have
                                 become a basic element in the environmental policies in the USA, Canada, the European
                                 Union (EU), Japan, Korea, Australia, China, and also in developing countries such as
                                 India [5]. One example of this is the LCA performed by the German Federal Environment
                                 Agency, which promoted the return deposit procedure for the beverage packaging [16].
                                       It should be noted that the importance that LCA and LCC is in acquiring the Green
                                 Public Procurement, since the publication of the Directive 2014/24/EU of the European
                                 Parliament on public procurement. This directive allows organizations to contract public
                                 authorities to determine which is the most economically advantageous offer and the
                                 lowest cost through an LCC approach. In addition, Directive 2010/31/EU of the European
                                 Parliament on the energy performance of buildings and Directive 2012/27/EU of the
                                 European Parliament on energy efficiency include environmental information for energy
                                 certificates.
                                       In Spain, the Climate Change and Energy Transition Law was adopted on 21 May
                                 2021, and it established four minimum objectives for 2030:
                                 1.   The reduction of the greenhouse gas (GHG) emissions of the Spanish economy by at
                                      least 23% referred to 1990;
                                 2.   Reaching a penetration of renewable energies of at least 42% in the final energy
                                      consumption;
                                 3.   Achievement of an electrical system with at least 74% generation from renewable
                                      energy sources;
                                 4.   Improvement in energy efficiency by reducing primary energy consumption by at
                                      least 39.5% with respect to the baseline, in accordance with community regulations.
                                     Consequently, an LCA can contribute to meet these challenges. Nevertheless, LCA
                                 and LCC have always been a major concern for large account projects of architecture,
Sustainability 2021, 13, 10306                                                                                           3 of 19

                                 engineering, construction, and services: Muteri et al. [17] carried out an LCA of PV panels;
                                 Wiedemann et al. [18] evaluated through an LCA the Australian red meat supply chains in
                                 terms of environmental impacts; Oğuz et al. [19] made a comparative between different
                                 kind of technologies (wind versus PV); and Muñoz et al. [20] assessed an LCA and LCC
                                 study for a wastewater treatment plant with heat recovery. There are many more examples
                                 of LCAs in large projects, although a significant lack of LCA and LCC assessments is
                                 appreciated in low-cost projects.
                                       Nowadays the development of the Internet of Things (IoT) platforms is becoming a key
                                 factor for the evolution of the smart city concept, focusing on improving the quality-of-life
                                 and economic expansion. These kinds of projects have turned out to be low-cost/high-
                                 impact projects, so we think it is important to start including LCA and LCC analyses in
                                 these kinds of projects since the concept of smart cities and smart homes will be developed
                                 exponentially in the coming years [21]. IoT environments are characterized by the presence
                                 of many heterogeneous devices, often massively installed in an area to enable a certain
                                 application [22]. According to Kandaswamy and Furlonger [23], there were about 8.4
                                 billion connected devices worldwide in 2020, and this number is expected to reach 20.4
                                 billion in 2022. The evolution of a new generation of products and services is expected to
                                 have a great impact on the social and technological ecosystem. In a globalized world, even
                                 low-cost projects such as ours could become large-scale projects since the IoT will need a
                                 great number of devices. Therefore, it is essential from the point of view of sustainability
                                 and economics that research groups such as ours start promoting environmental and
                                 economic analyses since combining them could supplement this kind of projects towards
                                 sustainability.

                                 1.1. Quality of Databases
                                      One important point to keep in mind is that the quality and origin of the baseline data
                                 is particularly relevant to identify the level of confidence in the results. It is well known
                                 that LCAs need a great volume of information in the initial steps [24,25], which is precisely
                                 when it is not fully available and it is difficult to obtain. Thus, primary data from the most
                                 relevant top-tier suppliers must be included, depending on the framework of the study.
                                 There are public and private databases to obtain all the necessary data, but it is important
                                 to analyze their degree of representativeness with the studied system. The key question is
                                 how reliable and comparable the results are.
                                      Due to the diversity of methods, it is surprising that there has not been an in-depth
                                 research of the different techniques, the relationship between them, and how we could
                                 move forward to integrate them [26]. There is a great influence on the environmental
                                 impact results depending on the database selected. Pauer et al. [16] compared a LCA
                                 of six packaging systems using three different databases: GaBi, Ecoinvent 3.6, and the
                                 Environmental Footprint (EF). They found a similar impact for climate change but striking
                                 discrepancies for the other impact categories. A review about the available methods for
                                 the life cycle interpretation presented by Laurent et al. [27] found a lack of exhaustive
                                 guides to perform the individual stages within the life cycle interpretation, leading to
                                 circumstances where LCA users concluded improper findings, or the comparison of the
                                 results were arbitrary. Weidema [28] presented an article which provided a detailed
                                 procedural statement for the stage of the consistency check. He found that the fact of
                                 reviewing and amending the inconsistencies can elude most consistency issues, although
                                 the lack of resources might make this revision impossible, and the implications of the
                                 inconsistencies when the conclusions are formulated may then simply be stated and
                                 adapted.
                                      Performing an LCA is a challenging and complicated process, where making material
                                 mistakes due to unreliable input information collected from unrepresentative sampling is
                                 likely to occur, even in developed countries [29]. LCA requires accurate and up-to-date
                                 data that differs from time to time, place to place, and case to case. In many cases, such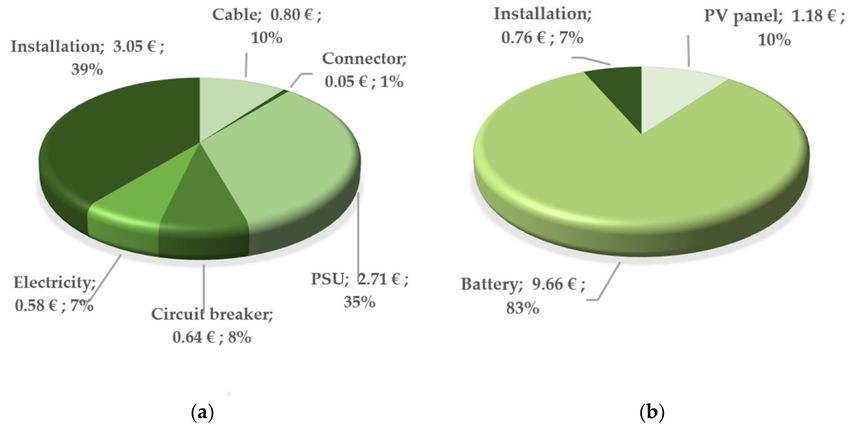
Sustainability 2021, 13, 10306                                                                                           4 of 19

                                 complex input data either is not available or is based on irregular sampling due to the
                                 absence of an appropriate database [30–32].

                                 1.2. Product Environmental Footprint
                                       In order to increase the comparability of the environmental assessment studies, in 2013,
                                 the European Commission launched the “Recommendation 2013/179/EU on the use of
                                 common methods to measure and communicate the life cycle environmental performance
                                 of products and organizations” [33], where an EU-wide environmental assessment method,
                                 named the Product Environmental Footprint (PEF), is described. In 2017, version 6.3 of the
                                 Product Environmental Footprint Category Rules (PEFCR) Guidance was released [34].
                                       The main intention of the PEF method is to establish a consistent set of precepts to
                                 determine the environmental performance of a product throughout its life cycle [35] and
                                 to increase the comparability between products [36]. It is built on the LCA procedure,
                                 trying to avoid alterations between the life cycle stages’ trade-offs of the environmental
                                 impacts and considering all the relevant impacts of the inputs across the whole life cycle
                                 of a product or service [37]. Predefining specifications for certain methodological aspects
                                 based on value choices was expected to achieve an increase in the comparability. This
                                 carries out a limitation in the flexibility for which the international standards for LCA are
                                 known for (ISO 14040/44 [38]).
                                       In [34], there are 16 impact categories which must be included in the analysis. The
                                 PEF guideline sacrifices flexibility by minimizing the number of choices and decisions that
                                 the user would have to take [39]. PEF pilots have also been conducted by the European
                                 Commission during 2013–2016, which includes 26 pilots covering different type of product
                                 or sectors [40]. Since the completion of the pilots, this method attracted more and more
                                 attention to improve the product sustainability throughout the entire product life cycle.
                                 Russo et al. [41] presented a paper with the state of the art of the PEF in the olive sector.
                                 Six et al. [42] conducted an LCA in line with the PEF guidelines for a section of the pork
                                 production chain in Belgium. Soode-Schimonsky et al. [43] followed the PEF methodology
                                 to calculate the environmental impacts of some strawberry production systems in Esto-
                                 nia. Famiglietti et al. [44] developed a tool to assess the environmental burdens of dairy
                                 products, allowing the identification of hotspots through the PEF of 16 different impact
                                 categories. Pyay et al. [45] evaluated the PEF of the primary and intermediate outcomes
                                 from the rubber cultivation in Thailand. Corradini et al. [46] applied the PEF methodology
                                 to a wooden wall element in an existing building in Italy. He et al. [47] developed the
                                 PEF assessment process of an agricultural picking robot. Kuo and Lee [48] proposed an
                                 multi-criteria method to design a supply chain network based on the results of the PEF.
                                 Egas et al. [49] developed a compliant tool to determine the dairy products PEF. Wohner
                                 et al. [9] developed a sustainability evaluation method for food-packaging based on ISO
                                 14040 with additional guidance from the PEF.
                                       These kinds of studies demonstrate that the PEF is a powerful tool to assess environ-
                                 mental analysis, although it is still a relatively new method for LCA studies. Currently,
                                 there is also a lack of PEF in electronics devices. Wu and Su [40] presented a paper with a
                                 LCA of a LED luminaire using the PEF methodology. They used the latest Environmental
                                 Footprint (EF) secondary database in the openLCA software tool [50]. The lighting prod-
                                 ucts were not included in the PEF pilots, so they the authors conclude that the outcomes of
                                 the study will be supplementary for developing PEF category rules for lighting products.

                                 2. Materials and Methods
                                      In this section, we provide the description of the project and the different methods
                                 and techniques needed to carry out the environmental analysis. The goal and scenarios
                                 assessed are described, as well as the selection of the functional unit (FU). Regarding the
                                 economic assessment, a simplified TCO is carried out.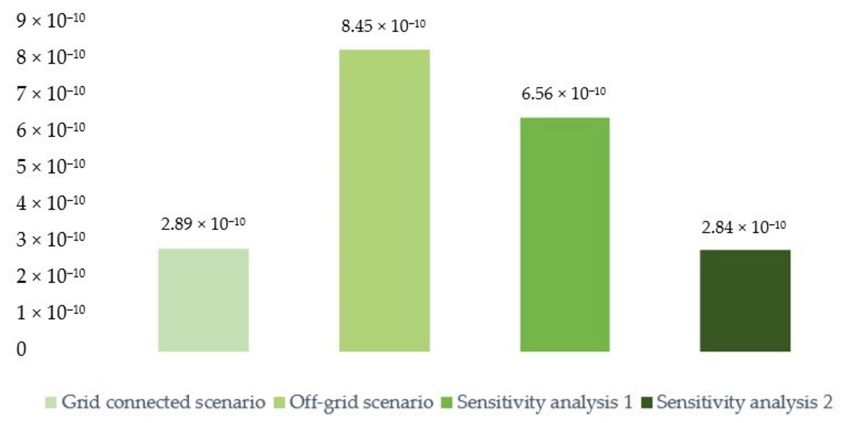
Sustainability 2021, 13, 10306 5 of 19
2.1. Project Description
The starting point for the prospective assessment is a sensor network described in
the R&D project UAL18-TIC-A025-A within the framework of the European Regional
Development Fund (ERDF) 2014–2020 Andalusia Operational Program. The project is
called “Monitored Electromagnetic Field Generated by Electrical Grids”, and the objective
is to build a 10-sensor network spatially distributed in the campus (see Figure 1) of the
University of Almeria (UAL) with the aim of monitoring in real time the electromagnetic
field produced by equipment and electrical installations. In Spain, the grid frequency is
50 Hz, and the study extends to the harmonics within 1 kHz bandwidth, called Power Line
Harmonic Radiation (PLHR).
Figure 1. Node locations in the UAL campus [51].
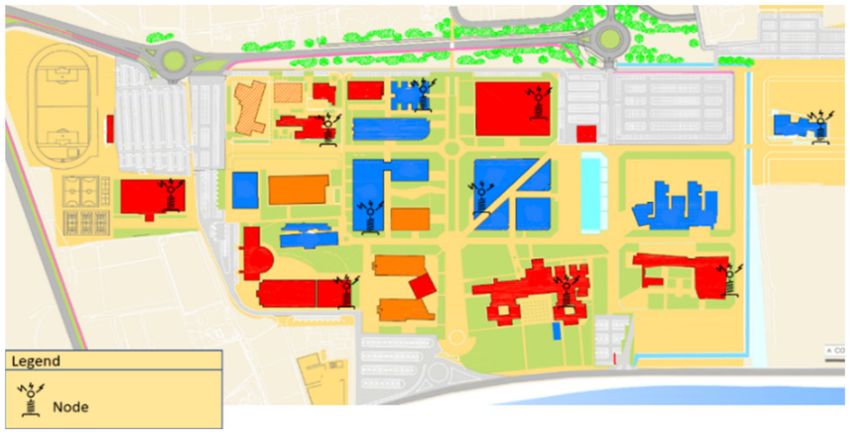
Figure 2a shows the diagram of the sensor network, where every node consists of the
following elements:
• Electromagnetic sensor;
• Signal conditioning (SC);
• Analog–digital converter (ADC);
• Microcontroller (MC);
• Wi-Fi communication module (CM).
The SC is based on the INA188 [52] instrumentation amplifier from Texas Instruments
and the LT1490 [53] operational amplifier from Linear Technology. The ADC, MC, and CM
are integrated into a single component, the CC3220SF Simplelink Wi-Fi Single-Chip MCU
Solution [54] (AMCM), from Texas Instruments. For the preliminary tests, the evaluation
kit CC3220SF_LAUNCHPAD will be used (see Figure 2b).
The communication of each node with the central server is done through the access
points (AP) of the campus Wi-Fi network. This provides flexibility in terms of spatial
location, not depending on a wired connection. The nodes are located on the flat roofs of
the campus buildings, and they can be powered from the electrical grid since there are
electrical boxes. Another possibility could be making the nodes totally off grid by installing
a PV panel and a battery. This will be discussed more extensively in Section 2.2, and it will
provide the basis for the goal and scenarios assessed in this study.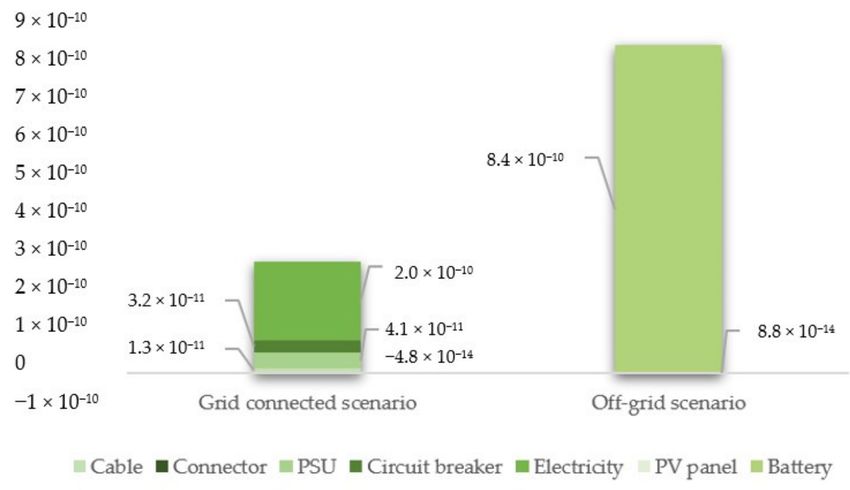
Sustainability 2021, 13, 10306                                                                                           6 of 19

                                 Figure 2. (a) Sensor network diagram; (b) CC3220 SimpleLink LaunchPad Development kit [55].

                                      The initial specifications of the project are the following:
                                 •   There is only one electromagnetic sensor per node, so only one acquisition channel is
                                     required;
                                 •   The main supply voltage is 7.2 V. The SC supply voltage is 6 V, and the AMCM supply
                                     voltage is 3.3 V;
                                 •   The SC is permanently powered;
                                 •   The ADC acquires data (12 bits) continuously with a sample rate of 62.5 ksps;
                                 •   Data are processed in the MC, and the sample rate is decimated to 7.8125 kHz;
                                 •   Once the decimation process has been carried out, the data is grouped into 6” packages
                                     (750,000 data bits) to be sent by the CM to the data server via Wi-Fi;
                                 •   The transmission rate depends on the Wi-Fi link, and it ranges from 1 to 54 Mbps;
                                 •   The transmission energy consumption is difficult to evaluate because it depends on
                                     the proximity of the sensor to the AP, link conditions, etc. In an initial approach, the
                                     worst situation has been considered, and an energy consumption corresponding to
                                     maximum power is assumed;
                                 •   PV panel (off-grid option): 7.2 V, 240 mA (1.73 Wp);
                                 •   System autonomy (off-grid option): 10 days.
                                       A PV panel and a battery must be installed to make the system completely off grid,
                                 and some calculations are needed to find out their specifications to choose the right models
                                 and sizes.
                                       The estimated SC consumption is 2.2 mA [52,53]. Overall, AMCM consumption is
                                 difficult to evaluate because it integrates three modules with different functionalities: the
                                 ADC, the MC, and the CM. The following current consumptions are estimated:
                                 •   The minimum consumption of the AMCM is 25.2 mA [54]. The ADC operates con-
                                     tinuously, and because of this, it is not possible to bring the MC to any of its possible
                                     low-power states.
                                 •   The remaining consumption of the AMCM depends on the CM transmission rate.
                                     Two scenarios are assumed: in the most conservative one, the transmission speed is
                                     6 Mbps (9.6 mA average current). In the most favorable one, the transmission rate is
                                     54 Mbps (1 mA average current).
                                      We have considered a solar irradiation of 150 kWh/m2 , corresponding with the
                                 average monthly value between 2010–2016 of November (the worst month of the year).
                                 This data has been obtained from the Photovoltaic Geographical Information System
                                 (PVGIS) [56] for a PV panel facing South with an inclination of 60◦ in coordinates 36.280 N
                                 2.406 W (UAL campus).
                                      Based on the above-mentioned data and assumptions, the result is a consumption of
                                 11,093 mAh considering the most conservative scenario (6 Mbps transmission rate) and a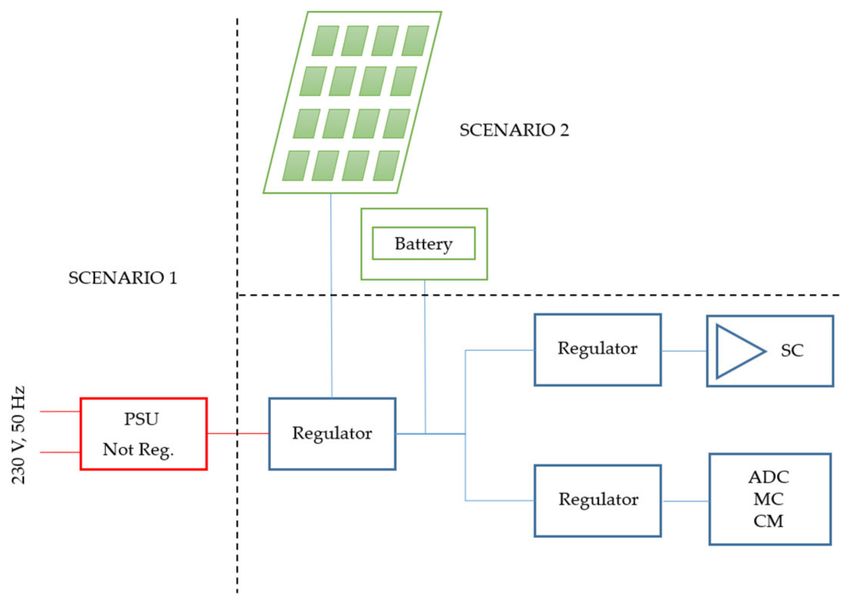
Sustainability 2021, 13, 10306                                                                                              7 of 19

                                 consumption of 8508 mAh in the case of transmitting at 54 Mbps (best scenario). Since we
                                 are already in the design phase and we do not know the real transmission rate, the worst
                                 scenario is assumed, and the selected components are a PV module from PowerFilm Solar,
                                 model MP7.2-150F (1.73 Wp) and two 6700 mAh commercially rechargeable batteries.
                                      As said before, this project is still in the design phase, so the results obtained after the
                                 environmental analysis and the TCO study will be useful for setting the requirements of the
                                 project or even improving the final design in sustainability, environmental, and economic
                                 terms. According to [57], it is estimated that over 80% of the environmental impact of
                                 a product or service is established in the early stage of the design, so an environmental
                                 analysis in this phase is not only feasible, but also provides valuable information to make
                                 the best and most transparent possible decisions [29]. Accordingly, it is not only helpful
                                 but also necessary to use such methods at the beginning of a project [58]. In this way, we
                                 can identify opportunities for improvement at a lower cost since these methods applies to
                                 the inputs and it helps to reverse some of the major damaging impacts because it is still
                                 possible to modify the design based on the results obtained. On the contrary, in this phase,
                                 there is less detailed information on the product, its future use, or end-of-life scenario, and
                                 estimations may be necessary.

                                 2.2. Methods, Goal, and Scenarios Assessed
                                     The LCA analysis was based on ISO 14040/44 [38] with additional guidance from the
                                 PEF [34]. For this study, the PEF guidance was used for:
                                 •    Selection of life cycle impact categories;
                                 •    Default transport distances;
                                 •    Allocation regarding input and output of secondary materials.
                                      The software selected to perform the study is openLCA [50] since it is an open-source
                                 software, freely available and easy to use, which is very suitable for beginners. In addition,
                                 our inventory database consists of only a few elements, so we do not have the need for
                                 specialized databases. There are also private companies that sell more advanced software,
                                 such as SimaPro [59], Gabi [60], BEES [61], etc. With this kind of tool, practitioners are free
                                 to set certain assumptions, and their databases include more product data information.
                                 However, they require technical expertise in the methodology to use it and to understand
                                 the results.
                                      The aim of the paper was to compare the environmental impacts and the costs from
                                 the customer’s point of view of a sensor network connected to the grid (scenario 1) in
                                 comparison to the proposed off-grid option (scenario 2), with the sensor connected to a PV
                                 panel. The objective of the R&D project is to build a 10-node network spatially distributed
                                 in the campus, but we chose one node as the target for this study since all the nodes are
                                 identical. One point to keep in mind is that only components that differ from each scenario
                                 were analyzed because the rest of the components of the sensor network are the same for
                                 both scenarios. Therefore, the question arises if the overall environmental burdens and
                                 the total costs of the off-grid scenario solution are lower or higher than its benefits and
                                 savings. To answer this question and to become aware of further improvement potentials
                                 and financial consequences, an LCA and a TCO analysis were conducted.

                                 2.3. Functional Unit and Reference Flow
                                      An FU is a quantified description of the performance of the product systems, for use
                                 as a reference unit. A reference flow is a quantified number of product(s), including the
                                 parts needed for a specific product system to deliver the performance described by the
                                 functional unit. The goal of the reference flow is to translate the abstract functional unit in
                                 specific product flows for each of the compared systems, so that the product alternatives
                                 are compared on an equivalent basis, reflecting the real consequences of a possible product
                                 substitution [62].
                                      The FU of this study is the electrical power supply to feed one node at 7.2 V DC during
                                 a year. The reference flow is the material annual consumption attributable to one year of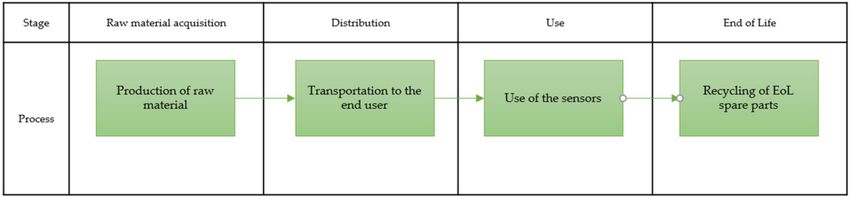
Sustainability 2021, 13, 10306                                                                                             8 of 19

                                 operation. Scenario 1 considers the reference flow if the node is powered from the public
                                 grid, and scenario 2 considers that the node is powered from a PV panel (see Figure 3).

                                 Figure 3. Different ways of supplying energy to the node at 7.2 V DC.

                                 2.4. System Boundary
                                      The system boundaries describe the life cycle stages of the system and the processes
                                 and flows included in the analysis. In this study, four stages were included (see Figure 4).
                                 The assembly stage was not considered since the different components only need a manual
                                 assembly.

                                 Figure 4. System boundaries.

                                 2.5. Data Collection for LCA
                                       The life cycle model was developed with data contained in the library ef_secondary
                                 data_201908. The use of LCA databases enables users to reduce time, efforts, and resources
                                 for data collection and reflect supply chains they have no direct control over [63]. To
                                 complete the inventory analysis, a set of processes from the EF secondary database was
                                 chosen.
                                       This database has been developed under the PEF initiative, which recommended to
                                 investigate the feasibility of an initiative on the ecological footprint to address the dilemma
                                 of the environmental impact of products and services, including carbon emissions. This
                                 initiative encouraged researchers to seek alternatives for establishing a common European
                                 methodology. Therefore, the European Commission delivered this database, which is
                                 available for the GreeDelta open source software openLCA [50].
                                       Below we describe the data, assumptions, and calculations performed for both scenar-
                                 ios in the different stages of the project life cycle: construction, distribution, operation, and
                                 end of life (EoL).
                                       The inventory used in the construction stage of the sensor network is derived from
                                 a detailed bill of materials of the installation. As said before, one point to keep in mind
                                 is that only components that differ from each scenario will be analyzed, since the rest of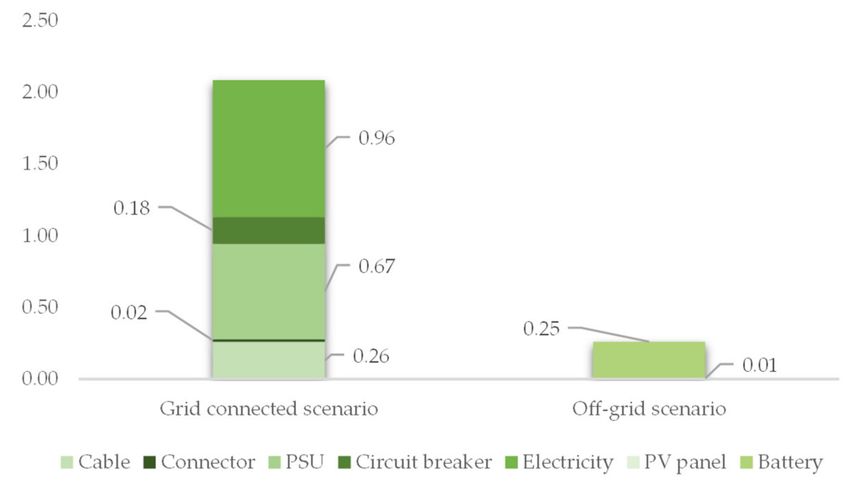
Sustainability 2021, 13, 10306                                                                                                 9 of 19

                                 components of the sensor network are the same for both scenarios, and logically, their
                                 contribution to the final impact would be the same.
                                      In the grid connected option, the following materials needed to connect the node to
                                 the grid available in the flat roof of the building were considered:
                                 •     20 m of three-conductor cable, section 1.5 mm2 , 60 g/m;
                                 •     12 cylindrical connectors, section 1.5 mm2 ;
                                 •     Two-pole circuit breaker;
                                 •     230 VAC/7.2 VDC power supply unit (PSU).
                                       As before, the following materials were considered to implement the off-grid option:
                                 •     PV panel from PowerFilm, model MP7.2-150F, 0.037 m2 ;
                                 •     2 rechargeable Lithium-Ion batteries, 6.7 Ah 7.2 V.
                                       As a next step, useful lives were attributed to each item, based on expected wear and
                                 tear. The chosen values are as follows:
                                 •     20 years for the PV module and electrics components (cable, circuit breaker, and
                                       connectors);
                                 •     10 years for electronics components (PSU);
                                 •     8 years for batteries. According to Beltrán et al. [64], expectancy lifetime of a lithium-
                                       ion battery under real operation conditions is between 8 and 12 years. We choose
                                       8 years, the lower value, since in this design phase we do not know the real conditions
                                       of the batteries (temperature, depth of discharge, etc.).
                                       The service life of the complete system is set to 20 years. Concerning land use by this
                                 system, it is not considered because it is assumed that the PV modules are mounted on
                                 the flat roofs of the existing facilities of UAL. Against this background, Table 1 describes
                                 the material annual consumption for the grid connected scenario and Table 2 for the
                                 off-grid scenario.

                                 Table 1. Materials’ annual consumption in the grid-connected scenario.

                                                                                                                     Annual
                                                                      Unit          Total           Service Life
                                      Component        Amount                                                      Consumption
                                                                    Weight (g)    Weight (g)          (Years)
                                                                                                                     (g/Year)
                                         Cable           20 m           60            1200              20              60
                                       Connector       12 items        0.52           6.24              20             0.312
                                          PSU           1 item         270             270              10               27
                                     Circuit breaker    1 item        231.86         231.86             20            11.593

                                 Table 2. Materials’ annual consumption in the off-grid scenario.

                                                                                                       Service       Annual
                                                                       Unit           Total
                                      Component         Amount                                           Life      Consumption
                                                                     Weight (g)     Weight (g)
                                                                                                       (Years)       (g/Year)
                                     PV solar panel      1 item         25.51          25.51             20           1.276
                                        Battery          2 items         196            392               8            49

                                      In the distribution stage, we included two transportation activities for the electronics
                                 components: transoceanic ship from China to the Spain seaport (9000 km) and lorry
                                 (>32 ton) (339 km) from Algeciras Port, Spain, to the warehouse based in Almeria, Spain.
                                 Regarding the PV panel, the transportation was considered as follows: transoceanic ship
                                 from the USA to the Spain seaport (6000 km) and lorry (>32 ton) (339 km) from Algeciras
                                 Port, Spain, to the warehouse based in Almeria, Spain. The transportation distances
                                 were estimated, and the associated impacts are subsequently assessed with these average
                                 estimations.
                                      Under operation, we only include the electricity consumed by the equipment, which,
                                 in the grid-connected scenario, is expected to be 6392 mWh/day (2.33 kWh/year). The
Sustainability 2021, 13, 10306 10 of 19
electricity production proportion in 2019 in Spain [65] used to model the electricity con-
sumption is shown in Table 3. In the off-grid scenario, there is no electrical consumption
since all the power is supplied by the PV solar panel.
Table 3. Electricity production proportion in 2019 in Spain.
Electricity Mixture Proportion
Natural gas 30.8%
Nuclear 21.3%
Wind 20.3%
Hydro 9.8%
Coal 5.2%
Oil 4.6%
Solar 5.5%
Biofuels 1.8%
Waste 0.7%
Dismantling of the sensor network is built with the data sets and flows existing in
the EF database. As in the inventory for the construction of this system, the reference
flow is the disposal of materials attributable to one year of operation. The EoL of the
components is dealt with Waste Electrical and Electronic Equipment procedures, as the
waste disposal of electrical and electronic equipment is defined in the Directive 2012/19/EU
of the European Parliament on waste electrical and electronic equipment (WEEE). The EoL
of the components will be carried out by professionals, thus it is assumed to fully comply
with WEEE procedures. The WEEE management company dealing with the EoL of the
components provides the material treatments after collection (end of life of electronics
scrap, production mix, at plant, recycling of copper and precious metals (Ag, Au, Pd, Pt)
from electronics, recycling processes: 95–98% efficiency, scrap incineration: 11.0 MJ/kg
NCV), which are referred to the different processes with this EoL scenario existing in the
EF database.
2.6. Data Collection for the TCO Analysis
TCO analysis included two stages for both scenarios under study:
• Investment;
• Operation during service life.
In our assessment, we excluded decommissioning costs, as these are expected to be
negligible in magnitude.
Investment costs are annualized by means of the Equation (1):
Ia = I ·CRF (1)
where Ia is the annualized amount of the investment cost (€/year), I is the investment
cost in EUR, and CRF is the capital recovery factor (1/year). CRF is calculated with the
Equation (2): !
r · (1 + r ) N
CRF = (2)
(1 + r ) N − 1
where N represents the service life in years and r is the interest rate (dimensionless).
The interest rate used in the study to annualize the investment costs is 0.377%. This
value is collected from the GDP-weighted Euro area 10-year sovereign bond yield, in
accordance with the information supplied by the European Central Bank at the beginning
of 2021 [66].
The investment for both scenarios is calculated based on data from specialized dealers
with whom UAL has purchasing agreements. The annualized investment cost is calculated
with the CRF equation. Table 4 shows the annualized investment cost for the grid-connected
scenario and the Table 5 for the off-grid scenario.Sustainability 2021, 13, 10306 11 of 19
Table 4. Annualized investment cost in the grid connected scenario.
Service Life Annualized Cost
Materials and Installation Amount
(Years) (EUR/Year)
Cable 20 m 20 0.80
Connector 12 items 20 0.05
PSU 1 item 10 2.71
Circuit breaker 1 item 20 0.64
Installation 1 item 20 3.05
Table 5. Annualized investment cost in the off-grid scenario.
Service Life Annualized Cost
Materials and Installation Amount
(Years) (EUR/Year)
PV solar panel 1 item 20 1.18
Battery 2 items 8 9.66
Installation 1 item 20 0.76
Operation costs included the electricity consumption of the node, which is perma-
nently powered because the objective of the project is monitoring the electromagnetic field
in real time. Electricity costs are quantified based on the specific consumption described
before and the unitary cost of the electricity. The price of the electricity in Spain is taken as
0.243 EUR/kWh. This price is the average in Spain for industrial consumers in the band
less than 20 MWh/year and includes the price of energy, network, and taxes and levies [67].
According to this, the annualized cost in the operation stage for the grid connected scenario
is 0.58 EUR/year.
We only consider the electricity cost in the operation stage given that maintenance
was assumed to be negligible. This kind of task will be carried out by the researchers of the
group since the data obtained by the sensor network will be used for other publications
and works. No operation cost is considered for the off-grid scenario.
2.7. Impact Assessment Method
The impact assessment method was the EF 3.0 (Mid-point indicator). The European
Commission proposed the EF method as an accepted way of measuring environmental
performance and aimed at standardization [33,34]. It is the EU recommended method for
quantifying the environmental burdens of products, services, and organizations. In this
way, the environmental impacts of the conventional scenario were compared to the solar
scenario solution.
3. Results and Discussion
In this section, we present the results of the LCA analysis, where 16 different impact
categories were analyzed and compared for both scenarios. Afterwards, the results of
the TCO analysis are shown, and lastly, two sensitivity analyses were conducted. All the
results are discussed in the corresponding section.
3.1. Lyfe Cycle Impact Assessment
The result at a midpoint level of the life cycle impact assessment for the 16 impact
categories is shown in Figure 5. The analysis was made for both scenarios in a series of bar
charts, where the bar on the left (S1) corresponds to scenario 1, while the bar on the right
(S2) corresponds to scenario 2.Sustainability 2021, 13, 10306 12 of 19
Figure 5. Life cycle impact assessment: (a) Acidification (mol); (b) Climate change (kg CO2 eq.); (c) Ecotoxicity, freshwater
(Items); (d) Eutrophication, marine (kg); (e) Eutrophication, freshwater (kg); (f) Eutrophication, terrestrial (kg); (g) Human
toxicity, cancer (Items); (h) Human toxicity, non-cancer (Items); (i) Ionizing radiation (kBq); (j) Land use (Items); (k) Ozone
depletion (kg); (l) Particulate matter (Items); (m) Photochemical ozone formation (kg); (n) Resource use, fossils (MJ); (o)
Resource use, minerals and metals (kg); (p) Water use (m3 ).
For most of the impact categories, the off-grid option was more favorable, but there is
only one indicator in which the off-grid option is worse: ozone depletion (see Figure 5k).
The grid-connected scenario presented a value of 2.89 × 10⁻¹⁰ kg, while in the off-grid
scenario, the value was 8.45 × 10⁻¹⁰ kg, 2.9 times higher values than the grid-connected
option. An additional analysis was carried out for the ozone depletion impact category,
detailing the contribution of each component in both scenarios. It can be inferred from
Figure 6 that the greatest impact on this indicator was produced by the battery, and it
represented 99.9% of the impact of the off-grid option. In the grid-connected scenario
the element with the greatest impact was the electricity consumption, with a 70.3% of the
total impact.Sustainability 2021, 13, 10306 13 of 19
Figure 6. Contribution analysis of each component for ozone depletion in Kg.
One of the greatest challenges for the present and coming generations is climate
change. One parameter that most contributes to climate change is GHG emissions. For this
reason, efforts to cut this kind of emissions are recognized as an important step to fight
against climate change [58]. Because of the importance of the subject, a further analysis
was carried out for this impact category, detailing in Figure 7 the contribution of each
component. It can be observed that the climate change impact expressed in Kg CO2 eq. for
the off-grid scenario was seven times lower than for the grid connected option. The battery
continued to represent the higher contribution in the off-grid scenario, with 96.4% of the
impact, as well as the electricity consumption in the grid-connected scenario, with 46.2% of
the total impact.
Figure 7. Contribution analysis of each component for climate change in Kg CO2 eq.
3.2. Total Cost of Ownership
We can observe in the Table 6 that from a financial point of view the off-grid option
involved a significant cost increase compared with the grid connected option. Therefore,
the decision of making the system completely off grid does not provide economic savings.
Despite the positive results in the LCA for the off-grid scenario, the TCO shows that the
off-grid option is 48% more expensive, representing an extra cost of EUR 3.77 node/year.
The LCA thus does not address the economic elements of the life cycle, which indeed is the
focus of the TCO.Sustainability 2021, 13, 10306 14 of 19
Table 6. TCO in EUR/years.
Activity Grid Connected Off-Grid Difference
Materials investment 4.20 10.84 6.64
Installation 3.05 0.76 −2.29
Electricity 0.58 0 −0.58
Total 7.83 11.60 3.77
The elements with a larger influence on the cost can be identified thanks to the TCO
analysis. The contribution of the different components and activities for each scenario is
shown in Figure 8. In the off-grid scenario (Figure 8b), the component with the greatest
impact was the battery since it represents 83% of the total cost. This negative impact in the
cost is because of the high price and limited life service of the battery. In the grid-connected
scenario (Figure 8a) the element with the greatest impact was the installation, with 39% of
the total cost. Even though the off-grid option was economically less attractive than the
grid-connected option, we think that this is the best choice because of the requirements
of the R&D project UAL18-TIC-A025-A. This research project is totally dependent on the
data obtained by the sensor, and the off-grid option ensures that no data will be lost due to
possible power cuts.
Figure 8. (a) Costs distribution of the grid-connected scenario; (b) of the off-grid scenario.
3.3. Sensitivity Analysis
The process in which the values of one or some input data are modified to check the
reaction in the result is called a sensitivity analysis. According to Klöpffer and Grahl [68],
a sensitivity analysis helps to determine and register changes in the output data due
to adapted input information. All the knowledge acquired from recognizing sensitive
input data or parameters may help the product development process, and therefore, it can
categorize and/or prioritize those components with a larger weight on the environmental
impact of a product or system [27]. As said before, the greatest impact was produced by
the battery, so we changed some assumptions to reduce the battery size, and two sensitivity
analysis were performed as follows:
1. Sensitivity analysis 1: We considered a transmission rate of 54 Mbps due to the high
density of AP in the UAL campus. The result was a consumption of 8508 mAh, and
the selected batteries for this analysis were two 5200 mAh commercially rechargeable
batteries.
2. Sensitivity analysis 2: According to [69], the average hours of sun per year between
2011–2015 was 3201 h, and thus we proposed changing the parameter of the system
autonomy from 10 days to 4 days of low solar irradiation. The result was a consump-
tion of 4437 mAh in the most conservative scenario (6 Mbps transmission rate), andSustainability 2021, 13, 10306 15 of 19
the selected batteries for this purpose were two 2250 mAh commercially rechargeable
batteries.
We have performed these two sensitivity analyses, both at environmental and eco-
nomic level, to check the robustness of the results.
Changing the battery size entailed a 30% reduction in the ozone depletion category
impact in the case of sensitivity analysis 1 and a three times reduction in sensitivity analysis
2. Comparing now with the grid-connected option, the value of the ozone depletion was
2.3 times higher for sensitivity analysis 1 and 2% lower for sensitivity analysis 2. This
meant that sensitivity analysis 2 showed preference for all the impact categories, ozone
depletion included (Figure 9).
Figure 9. Sensitivity analysis for the ozone depletion (kg) impact category.
In Figure 10 we show the sensitivity analysis results at the economic level, where
we recalculated the costs when the battery size was reduced. The results show a cost
reduction of 15% in sensitivity analysis 1, although the total cost was still higher than the
grid-connected option, while in sensitivity analysis 2, the cost reduction was 53% and
the break-even point is reached, providing a net economic benefit of EUR 0.23 node/year
in comparison with the grid-connected option. Considering that the service life of the
complete project is 20 years, the total economic savings of the project (10-node network)
is EUR 460. This amount may seem insignificant compared to the cost of large account
projects of architecture, engineering, construction, etc., but in an economy of scale, this
could result in large savings if these types of sensors are massively installed.
Figure 10. Total cost sensitivity analysis in EUR/years.
Hence, replacing the two 6.7 Ah batteries with two 2.25 Ah batteries represents an
environmental and economic improvement, as evidenced in the second sensitivity analysis.Sustainability 2021, 13, 10306 16 of 19
4. Conclusions
Social progress and economic development demand new services and infrastructures,
but this is causing environmental issues that suppose real challenges for the current
generation. To meet the goal of a sustainable world, appropriate assessment tools are
required, and a basic tool used for this type of studies is the LCA, which is becoming a
strong tool for decision making towards sustainability.
The main goal of this paper was to compare through an LCA and a TCO analysis two
different ways of supplying energy to a sensor network, as well as succeeding in choosing
the least burdensome one in environmental and economic terms. The two different ways
of supplying energy were considering the sensor network connected to the public grid and
considering the system totally off grid, with a PV panel as primary energy source. The
framework of this study was outlined following the methodological recommendations
provided by ISO 14040/44 [38] with additional recommendations from the PEFCR guidance
6.3. [34]. The software used was openLCA 1.10.3 [50], and the life cycle analysis was
modelled with the library available in ef_secondarydata_201908 as background database.
The method used for the impact assessment was the EF 3.0 (Mid-point indicator) developed
under the PEF initiative.
R&D project UAL18-TIC-A025-A is still in the design phase, and the results obtained
after this study have been useful for improving the final design in environmental and
economic terms. It helped to reverse some of the major damaging impacts based on
the results obtained and in leading its development towards sustainability. From this
research group and belonging to a public university, we must promote this type of study,
but it was not the aim of this paper to create an accuracy model. Therefore, the authors
recommend focusing on general conclusions, since the results of a LCA require an excellent
database quality, and researchers are deeply dependent on this issue. Secondary data
are not based on direct process measurements or calculations, but they will be used for
establishing approximate studies. Of course, we are aware of the persevering efforts of
the database providers to constantly improve them, however, maintaining the commercial
data confidentiality without losing the credibility of the LCA results is also a great issue.
Currently, private companies are reluctant to give information which may recognize that
their products are worse in environmental terms than the competitor’s ones.
LCAs are sometimes regarded with some suspicion. Obstacles for implementation,
for instance, include prejudices about the high complexity of its use, arbitrariness of the
results, accuracy, misconception of the conclusions, etc. Despite all the limitations and
criticisms presented in this paper, we think that LCAs could be a powerful tool to make a
strong contribution to the challenge of sustainability. Even though the demand for similar
assessments in low-cost projects is currently low, a substantial increase is expected in a
foreseeable future.
Author Contributions: Conceptualization, methodology, software, formal analysis, resources, and
writing—original draft preparation, F.P. and M.F.-R.; writing—review and editing, F.P., R.M.G., A.A.,
J.A.G., M.F.-R. and N.N.; visualization, F.P., R.M.G., A.A., M.F.-R. and N.N.; supervision, M.F.-R. All
authors have read and agreed to the published version of the manuscript.
Funding: This research received no external funding.
Institutional Review Board Statement: Not applicable.
Informed Consent Statement: Not applicable.
Data Availability Statement: Data available in a publicly accessible repository that does not issue
DOIs. Publicly available datasets were analyzed in this study. This data can be found here:
https://nexus.openlca.org/database/Environmental%20Footprints (accessed on 10 July 2021).
Acknowledgments: Under I+D+I Project UAL18-TIC-A025-A, University of Almeria, the Min-
istry of Economy, Knowledge, Business and University, and the European Regional Development
Fund (FEDER); Andalusian Regional Government through the Electronics, Communications andSustainability 2021, 13, 10306 17 of 19
Telemedicine TIC019 Research Group of the University of Almeria, Spain; and in part by the European
Union FEDER Program and CIAMBITAL Group.
Conflicts of Interest: The authors declare no conflict of interest.
References
1. Novas, N.; Garcia, R.M.; Camacho, J.M.; Alcayde, A. Advances in solar energy towards efficient and sustainable energy.
Sustainability 2021, 13, 6295. [CrossRef]
2. Walker, S.; Coleman, N.; Hodgson, P.; Collins, N.; Brimacombe, L. Evaluating the environmental dimension of material efficiency
strategies relating to the circular economy. Sustainability 2018, 10, 666. [CrossRef]
3. Katarzyna, P.; Izabela, P.; Patrycja, B.W.; Weronika, K.; Andrzej, T. Lca as a tool for the environmental management of car tire
manufacturing. Appl. Sci. 2020, 10, 7015. [CrossRef]
4. Hellweg, S.; Canals, L.M.I. Emerging approaches, challenges and opportunities in life cycle assessment. Science 2014, 344,
1109–1113. [CrossRef]
5. Guinée, J.B.; Heijungs, R.; Huppes, G.; Zamagni, A.; Masoni, P.; Buonamici, R.; Ekvall, T.; Rydberg, T. Life cycle assessment: Past,
present, and future. Environ. Sci. Technol. 2011, 45, 90–96. [CrossRef]
6. Heijungs, R.; Settanni, E.; Guinée, J. Toward a computational structure for life cycle sustainability analysis: Unifying LCA and
LCC. Int. J. Life Cycle Assess. 2013, 18, 1722–1733. [CrossRef]
7. Barbušová, M.; Medvecká, I.; Gašo, M. Use of TCO Analysis in Industry 4.0. In Proceedings of the Průmyslové Inženýrství 2019
Mezinárodní Studentská Vědecká Konference, Pilsen, Czech Republic, 3–4 September 2019.
8. Spellerberg, I.; Fogel, D.S.; Fredericks, S.E.; Harrington, L.M.B. Berkshire Encyclopedia of Sustainability: Measurements, Indicators, and
Research Methods for Sustainability; Berkshire Publishing Group: Great Barrington, MA, USA, 2012. [CrossRef]
9. Wohner, B.; Gabriel, V.H.; Krenn, B.; Krauter, V.; Tacker, M. Environmental and economic assessment of food-packaging systems
with a focus on food waste. Case study on tomato ketchup. Sci. Total Environ. 2020, 738, 139846. [CrossRef]
10. Piekarski, C.M.; da Luz, L.M.; Zocche, L.; de Francisco, A.C. Life cycle assessment as entrepreneurial tool for business management
and green innovations. J. Technol. Manag. Innov. 2013, 8, 44–53. [CrossRef]
11. Ribeiro, I.; Peças, P.; Silva, A.; Henriques, E. Life cycle engineering methodology applied to material selection, a fender case study.
J. Clean. Prod. 2008, 16, 887–1899. [CrossRef]
12. Peças, P.; Ribeiro, I.; Folgado, R.; Henriques, E. A Life Cycle Engineering model for technology selection: A case study on plastic
injection moulds for low production volumes. J. Clean. Prod. 2009, 17, 846–856. [CrossRef]
13. Alves, C.; Ferrão, P.M.C.; Freitas, M.; Silva, A.J.; Luz, S.M.; Alves, D.E. Sustainable design procedure: The role of composite
materials to combine mechanical and environmental features for agricultural machines. Mater. Des. 2009, 30, 4060–4068.
[CrossRef]
14. Simões, C.L.; Xará, S.M.; Bernardo, C.A. Life cycle assessment of a road safety product made with virgin and recycled HDPE.
Waste Manag. Res. 2011, 29, 414–422. [CrossRef]
15. Simões, C.L.; Pinto, L.M.C.; Bernardo, C.A. Modelling the environmental performance of composite products: Benchmark with
traditional materials. Mater. Des. 2012, 39, 121–130. [CrossRef]
16. Pauer, E.; Wohner, B.; Tacker, M. The influence of database selection on environmental impact results. Life cycle assessment of
packaging using gabi, ecoinvent 3.6, and the environmental footprint database. Sustainability 2020, 12, 9948. [CrossRef]
17. Muteri, V.; Cellura, M.; Curto, D.; Franzitta, V.; Longo, S.; Mistretta, M.; Parisi, M.L. Review on Life Cycle Assessment of Solar
Photovoltaic Panels. Energies 2020, 13, 252. [CrossRef]
18. Wiedemann, S.; McGahan, E.; Murphy, C.; Yan, M.J.; Henry, B.; Thoma, G.; Ledgard, S. Environmental impacts and resource
use of Australian beef and lamb exported to the USA determined using life cycle assessment. J. Clean. Prod. 2015, 94, 67–75.
[CrossRef]
19. Oğuz, E.; Şentürk, A.E. Selection of the most sustainable renewable energy system for Bozcaada Island: Wind vs. Photovoltaic.
Sustainability 2019, 11, 4098. [CrossRef]
20. Muñoz, I.; Portillo, F.; Rosiek, S.; Batlles, F.J.; Martínez-Del-Río, J.; Acasuso, I.; Piergrossi, V.; De Sanctis, M.; Chimienti, S.; Di
Iaconi, C. Prospective environmental and economic assessment of solar-assisted thermal energy recovery from wastewater
through a sequencing batch biofilter granular reactor. J. Clean. Prod. 2019, 212, 1300–1309. [CrossRef]
21. Salmerón-Manzano, E.; Rahmani-Andebili, M.; Alcayde, A.; Manzano-Agugliaro, F. Worldwide Research Trends on Smart Homes.
In Operation of Smart Homes; Rahmani-Andebili, M., Ed.; Springer International Publishing: Cham, Switzerland, 2021; pp. 1–31.
ISBN 978-3-030-64915-9.
22. Aboubakar, M.; Kellil, M.; Roux, P. A Review of IoT Network Management: Current Status and Perspectives. Available online:
https://www.sciencedirect.com/science/article/pii/S1319157821000707 (accessed on 10 July 2021).
23. Kandaswamy, R.; Furlonger, D. Blockchain-Based Transformation: A Gartner Trend Insight Report. Available online: https:
//www.slideshare.net/SantiagoRiveraGonzle/blockchainbased-transformation-a-gartner-trend-insight-report (accessed on 10
July 2021).
24. Millet, D.; Bistagnino, L.; Lanzavecchia, C.; Camous, R.; Poldma, T. Does the potential of the use of LCA match the design team
needs? J. Clean. Prod. 2007, 15, 335–346. [CrossRef]Sustainability 2021, 13, 10306 18 of 19
25. Nakano, K.; Hirao, M. Collaborative activity with business partners for improvement of product environmental performance
using LCA. J. Clean. Prod. 2011, 19, 1189–1197. [CrossRef]
26. Miah, J.H.; Koh, S.C.L.; Stone, D. A hybridised framework combining integrated methods for environmental Life Cycle
Assessment and Life Cycle Costing. J. Clean. Prod. 2017, 168, 846–866. [CrossRef]
27. Laurent, A.; Weidema, B.P.; Bare, J.; Liao, X.; Maia de Souza, D.; Pizzol, M.; Sala, S.; Schreiber, H.; Thonemann, N.; Verones, F.
Methodological review and detailed guidance for the life cycle interpretation phase. J. Ind. Ecol. 2020, 24, 986–1003. [CrossRef]
[PubMed]
28. Weidema, B.P. Consistency check for life cycle assessments. Int. J. Life Cycle Assess. 2019, 24, 926–934. [CrossRef]
29. Shahabian, A.; Fadai, A.; Peruzzi, T. Future of Life-Cycle Assessment in a Smart and/or Sustainable World. In Interdisciplinary
Approaches to Public Policy and Sustainability; Das, R., Mandal, N., Eds.; IGI Global: Harrisburg, PA, USA, 2020; pp. 177–207.
30. Onat, N.C.; Kucukvar, M.; Halog, A.; Cloutier, S. Systems Thinking for Life Cycle Sustainability Assessment: A Review of Recent
Developments, Applications, and Future Perspectives. Sustainability 2017, 9, 706. [CrossRef]
31. Reap, J.; Roman, F.; Duncan, S.; Bras, B. A survey of unresolved problems in life cycle assessment. Int. J. Life Cycle Assess. 2008, 13,
374–388. [CrossRef]
32. Saadah, Y.; Abuhijleh, B. Decreasing CO2 emissions and embodied energy during the construction phase using sustainable
building materials. Int. J. Sustain. Build. Technol. Urban Dev. 2010, 1, 115–120. [CrossRef]
33. European Commission. Commission Recommendation of 9 April 2013 on the Use of Common Methods to Measure and Communicate the
Life Cycle Environmental Performance of Products and Organisations; European Commission: Brussels, Belgium, 2013.
34. European Commission. PEFCR Guidance Document; European Commission: Brussels, Belgium, 2018.
35. Lehmann, A.; Bach, V.; Finkbeiner, M. EU product environmental footprint-mid-term review of the pilot phase. Sustainability
2016, 8, 92. [CrossRef]
36. Bach, V.; Lehmann, A.; Görmer, M.; Finkbeiner, M. Product environmental footprint (PEF) pilot phase-comparability over
flexibility? Sustainability 2018, 10, 2898. [CrossRef]
37. Page, G.; Ridoutt, B.; Bellotti, B. Carbon and water footprint tradeoffs in fresh tomato production. J. Clean. Prod. 2012, 32, 219–226.
[CrossRef]
38. ISO 14040/14044. Environmental Management—Life Cycle Assessment—Principles and Framework; ISO: Geneva, Switzerland, 2006.
39. Manfredi, S.; Allacker, K.; Pelletier, N.; Schau, E.; Chomkhamsri, K.; Pant, R.; Pennington, D. Comparing the European
Commission product environmental footprint method with other environmental accounting methods. Int. J. Life Cycle Assess.
2015, 20, 389–404. [CrossRef]
40. Wu, Y.; Su, D. LCA of an industrial luminaire using product environmental footprint method. J. Clean. Prod. 2021, 305, 127159.
[CrossRef]
41. Russo, C.; Cappelletti, G.M.; Nicoletti, G.M.; Michalopoulos, G.; Pattara, C.; Palomino, J.A.P.; Tuomisto, H.L. Product environ-
mental footprint in the olive oil sector: State of the art. Environ. Eng. Manag. J. 2016, 15, 2019–2027. [CrossRef]
42. Six, L.; De Wilde, B.; Vermeiren, F.; Van Hemelryck, S.; Vercaeren, M.; Zamagni, A.; Masoni, P.; Dewulf, J.; De Meester, S. Using
the product environmental footprint for supply chain management: Lessons learned from a case study on pork. Int. J. Life Cycle
Assess. 2017, 22, 1354–1372. [CrossRef]
43. Soode-Schimonsky, E.; Richter, K.; Weber-Blaschke, G. Product environmental footprint of strawberries: Case studies in Estonia
and Germany. J. Environ. Manag. 2017, 203, 564–577. [CrossRef] [PubMed]
44. Famiglietti, J.; Guerci, M.; Proserpio, C.; Ravaglia, P.; Motta, M. Development and testing of the Product Environmental Footprint
Milk Tool: A comprehensive LCA tool for dairy products. Sci. Total Environ. 2019, 648, 1614–1626. [CrossRef]
45. Pyay, S.; Thanungkano, W.; Mungkalasiri, J.; Musikavong, C. A life cycle assessment of intermediate rubber products in Thailand
from the product environmental footprint perspective. J. Clean. Prod. 2019, 237, 117632. [CrossRef]
46. Corradini, G.; Pierobon, F.; Zanetti, M. Product environmental footprint of a cross-laminated timber system: A case study in Italy.
Int. J. Life Cycle Assess. 2019, 24, 975–988. [CrossRef]
47. Fuengwarodsakul, N.H. Battery management system with active inrush current control for Li-ion battery in light electric vehicles.
Electr. Eng. 2016, 98, 17–27. [CrossRef]
48. Kuo, T.C.; Lee, Y. Using Pareto optimization to support supply chain network design within environmental footprint impact
assessment. Sustainability 2019, 11, 452. [CrossRef]
49. Egas, D.; Ponsá, S.; Colon, J. CalcPEFDairy: A Product Environmental Footprint compliant tool for a tailored assessment of raw
milk and dairy products. J. Environ. Manag. 2020, 260, 110049. [CrossRef]
50. GreenDelta. OpenLCA Software. Available online: http://openlca.org (accessed on 31 May 2021).
51. University of Almeria Campus Map. Available online: https://w3.ual.es/conocenos/en/img/UAL2007.pdf (accessed on 10 July
2021).
52. Texas Instruments. INA 188 Datasheet. Available online: https://www.ti.com/product/INA188?keyMatch=INA%20188&
tisearch=search-everything (accessed on 24 November 2020).
53. Linear Technology. LT1490 Datasheet. Available online: https://www.analog.com/media/en/technical-documentation/data-
sheets/14901fb.pdf (accessed on 24 June 2021).You can also read