Protein Clipping Variant Analysis of Vedolizumab using dedicated workflows in BioPharma Compass
←
→
Page content transcription
If your browser does not render page correctly, please read the page content below
Protein Clipping Variant Analysis of Vedolizumab
using dedicated workflows in BioPharma Compass
Proteolytic degradation of biopharmaceuticals during their life cycle can pose health
risks and require dedicated analysis.

Abstract                                                                                                            Introduction                          Keywords:
                                                                                                                                                          Proteoform analysis,
                                                                                                                                                          protein degradation,
                                                                                                                                                          enzyme specificity,
In this work we used enzy-                               proposed clipping candidates.                              For Biopharmaceuticals, degra-        Middle-Up, Middle-Down,
                                                                                                                                                          sequence analysis,
matically introduced antibody                            However, CID Middle-Down                                   dation of the active drug             Elute_UPLC, maXis II
truncation variants as a case                            spectra provided sufficiently                              substance during production,          ETD, BioPharma
                                                                                                                                                          Compass 2021
study. These clipping variants                           long terminal sequence tags to                             formulation or storage poses a
were detected based on accurate                          confirm candidates as well.                                threat to drug efficacy and safety
mass measurements using a                                                                                           and is a critical quality attribute
maXis II ETD and confirmed by                            Dedicated clipping variant ana-                            (CQA). The detection of such trun-
LC-ETD and LC-CID Middle-                                lysis workflows in BioPharma                               cated protein species  –  clipping
Down      protein   sequencing.                          Compass 2021 enabled the                                   variants  –  can be difficult to
Typically, ETD yielded higher                            detection and confirmation of                              achieve through classic peptide
sequence coverages of the                                these variants rapidly and easily.                         mapping with trypsin.

Authors: Christian Albers 1, Detlev Suckau 1, Tomasz Gozdziewicz 2;
         1
           Bruker Daltonics, Bremen, Germany; 2 Polpharma Biologics S.A., ul. Trzy Lipy 3, 80-034 Gdansk, Poland.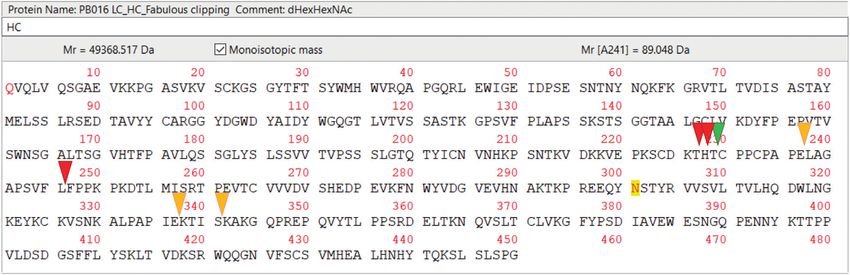
Fab      Fd          Fc      Fc/2
                ... PKSCDKTHT CPPCPAPELAGAPSV ...

                     1       FabULOUS (SpeB) digest                                   3     LC-MS                                       4   CID + ETD Middle-Down
                             in the hinge region                                            Intact mass based                               verification of clipping
                     2       Reduction of disulfide                                         clipping variant screening                      variant candidates
                             cross links

Figure 1: Experimental design for the Vedolizumab protein clipping analysis. SpeB digestion produced Fab and Fc fragments. After reduction Fd, Fc, and LC
subunits were analyzed by LC-MS, yielding the major expected subunits plus some low abundant fragments. Protein clipping analysis in BioPharma Compass
provided candidates based on accurate mass and isotope pattern. They were confirmed by direct sequence analysis of the clipping product candidates by
ETD and CID.

Vedolizumab is a recombinant,                                                     heavy chain. Minor cleavage products               Experimental
humanized IgG1 monoclonal antibody                                                with uncharacterized specificity have
directed against the human lympho-                                                also been observed.                                Samples
cyte α4β7 integrin, a key mediator
of gastrointestinal inflammation. It is                                           We analyzed the reduced SpeB                       A Vedolizumab biosimilar candidate
used in the treatment of moderate                                                 digest products with LC-MS using                   drug substance (Polpharma Biologics)
to severe active ulcerative colitis and                                           an ultrahigh resolution maXis II ETD               was measured after treatment with
Crohn's disease.                                                                  QTOF instrument to characterize                    FabULOUS and IgGZERO enzyme
                                                                                  the enzyme specificity and evaluate                kits (Genovis) followed by reduction
In this case study, a Vedolizumab                                                 the performance of the BioPharma                   using TCEP. Concentration after di-
biosimilar was characterized after                                                Compass 2021 clipping variants                     lution was approximately 0.5 mg/mL.
SpeB treatment, which cleaves IgG1                                                detection workflow. Middle-Down                    The resulting major subunits are
predominantly in the hinge region at                                              ETD and CID sequence validation                    named following the usual IgG sub-
...KTHT | CPPCPAPE... corresponding                                               measurements were subsequently                     unit nomenclature: Fd, Fc/2 and LC.
to T229|C230 on Vedolizumab’s                                                     performed to confirm the findings.

                    x107                              Fc/2 NF_15.24                LC_16.85              Fd pQ_18.78

                     6.0
 Signal intensity

                     5.0
                     4.0
                                                                   5                                            7
                                          3                                           6
                     3.0
                     2.0
                                                          4
                     1.0           1 2
                         0
                             13   13.5   14        14.5       15       15.5   16 16.5 17     17.5   18   18.5       19   19.5   20
                                                                               Time [min]

Figure 2: Top: Total Ion Chromatogram of the SpeB-digested, reduced and deglycosylated Vedolizumab
with the annotated subunits peaks 5 - 7 . Peaks 1 - 4 were further characterized as putative protein
clipping variants, which elute earlier in the chromatogram.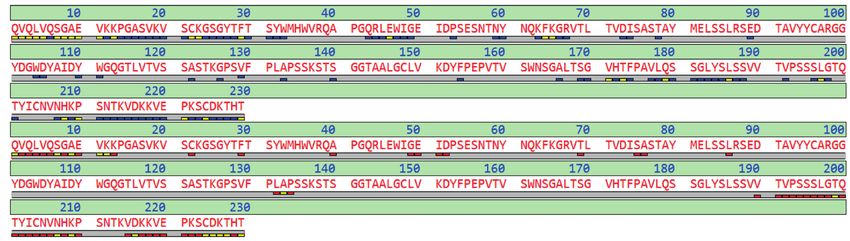
LC-MS and MS/MS                                                   ICC Target Intensity Controlling:                   flows allowed to specifically analyze
                                                                  1000 Mio                                            protein clipping variants. All molecular
A Bruker Elute UPLC with Waters                                   ICC Time Accumulation Analyte                       weights calculated were based
Protein BEH C4, 300Å 1.7 µm,                                      min: 1 ms                                           on the monoisotopic masses
2.1 x 100 mm column was used for                                  ICC Time Accumulation Analyte                       determined      using      the    SNAP
the protein separation.                                           max: 600 ms                                         algorithm in BioPharma Compass.
                                                                  Injection Time: 16 - 22 ms
Solvents: A: 0.1% Formic Acid in Water;                           Extended Reaction time: 4 - 6 ms                    Results
          B: 0.1% Formic Acid in ACN
Gradient: 0 min 10% B                                 For CID, a 50/50 Stepping with 25 eV                            The regular SpeB cleavage products
           1.5 min 10% B                              and 30 eV collision energy was
           2.5 min 15% B                              applied to all precursor ions.                                  The cleavage products resulting
           34 min 45% B                                                                                               from       Vedolizumab     IgGZERO
           35 min 95% B                               Data Analysis                                                   deglycosylation, SpeB treatment and
           40 min 95% B                                                                                               reduction predominantly yielded the
         40.2 min 10% B                               All datasets were transferred to                                expected Fd [1-229], Fc/2 [230-450]
           45 min 10% B                               BioPharma Compass 2021 for                                      and LC [1-219] subunits (peaks 5-7).
                                                      data processing and analysis. The                               In addition 4 additional peaks (1-4)
A Bruker maXis II ETD Ultrahigh                       Vedolizumab LC and HC sequences                                 were observed by LC-MS analysis
Resolution QTOF was used for                          were imported from [1] as FASTA                                 (Figure 2).
MS spectra acquisition in the                         file. N-terminal pyro Q was defined
150-2800 m/z range. The samples                       as variable modification together                               Chromatographic peaks 5-7 contained
were also subjected to ETD and CID                    with G0F, G1F and G2F as major                                  predominantly – but not exclusively,
fragmentation for Middle-Down                         glycoforms. The MAM Protein                                     see Figure 9 – the expected subunits
protein sequence analysis using a                     Screening workflow was used                                     as confirmed by the maximum
mass range from 100-2400 m/z.                         for intact mass analysis of the                                 entropy-deconvoluted mass spectra
                                                      SpeB proteolysis products and the                               (Figure 3).
The precursor ion intensity for ETD                   Top-Down Sequencing ESI work-
experiments was controlled in all                     flow for the sequence analysis of the
experiments using these parameters:                   CID and ETD spectra. Both work-

              5                                                      6                                                  7
             x10 5      25142.528                                 x10 6         23891.777                             x10 5                 24576.039
              1.0         Fc/2 NF                                  1.0             LC                                 1.75                    Fd pQ
              0.9                                                  0.9
                                                                                                                      1.50
              0.8                                                  0.8
              0.7                                                  0.7                                                1.25
 Intensity

                                                      Intensity

                                                                                                          Intensity

              0.6                                                  0.6
                                                                                                                      1.00
              0.5                                                  0.5
              0.4                                                  0.4                                                0.75
              0.3                                                  0.3                                                1.00
              0.2                                                  0.2
                                                                                                                      0.50
              0.1                                                  0.1
                0                                                    0                                                   0
                25,000 25,100 25,200 25,300 25,400                         23,900   23,910    23,920                     24,300 24,400 24,500 24,600 24,700
                                  Da                                                Da                                                    Da

Figure 3: MaxEnt deconvoluted MS spectra of chromatogram peaks 5 - 7 , containing the IgGZERO deglycosylated Fc/2, the LC and pyro-glutamylated Fd
subunit. All spectra were isotopically resolved and the calculated isotope patterns (red, LC in peak 6) show perfect alignment with the mass spectra. Minor
additional peaks are indicative of, e.g., potential protein clipping products of the drug sample (see Figure 9). Monoisotopic molecular weights are annotated
to the peaks.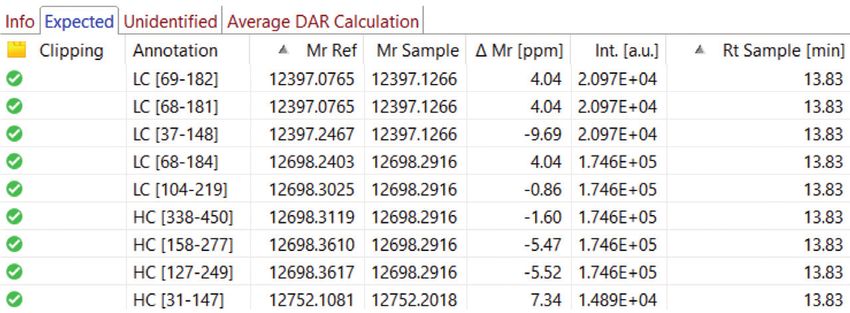
x10 3
GA S V K V S S G Y T S Y W R L I G
c
D E V K K D
1.25 y
T K D K V K K D V K T N S S Y L GS S V
z+1
1.00
Intensity
z+1 (13)
0.75
z+1 (2) z+1 (21)
0.50 c (27)
c (31) z+1 (49)
z+1 (34) z+1 (45)
0.25
0
500 1000 1500 2000 2500 3000 3500 4000 4500 5000 5500
m/z
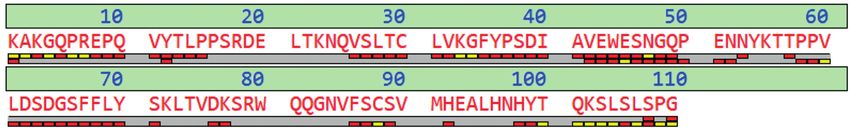
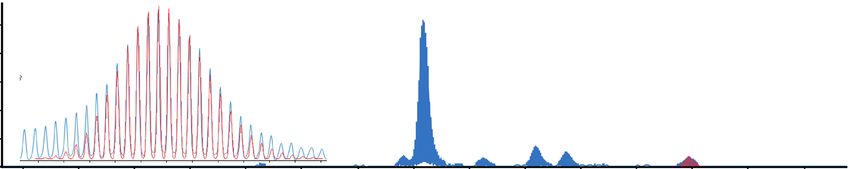
Figure 4: Top: ETD Middle-Down sequencing spectrum of the Fd subunit in peak 7; c-, y- and z+1 fragment ions were annotated. Center: Sequence coverage
map of the ETD fragments (blue); top row of bricks represents observed c-ions, bottom row represents matching y- and z+1-ions. Bottom: Sequence
coverage map of the CID fragments (red) from the CID spectrum (not shown); top row of bricks represents observed a- and b-ions, bottom row represents
matching y-ions. The yellow bricks indicate tolerated gaps in the observed fragment ion ladders for the calculation of the SVP [2].
1 2 3
x10 4
12397.121 12698.287 x10 5
12397.127 12698.292 x10 5 12269.029
7.0 LC [68-181] HC [338-450] 1.75 LC [68-181] HC [338-450] HC [342-450]
5.0
6.0 1.50
4.0
5.0 1.25
Intensity
Intensity
4.0 3.0
Intensity
1.00
3.0 0.75 2.0
2.0 1.00
1.0
1.0 0.50
0 0 0
12,200 12,400 12,600 12,800 13,000 12,400 12,600 12,800 11,000 12,000 13,000 14,000
Da Da Da
Figure 5: MaxEnt deconvoluted MS spectra of chromatogram peaks 1 - 3 . Some clipping candidates are annotated, some aren’t even visible here such as
HC [246-450] in peak 3 at 23605.831 Da (∆Mr -0.86 ppm).
Subsequent LC-ETD and LC-CID ana-                                         LC: 60/43% and Fd:48/36%, and for                          can be quite extensive if somewhat
lyses of each of the chromatographic                                      CID were Fc/2:36/29%, LC:47/38%                            relaxed mass tolerances, e.g., 10 ppm
peaks provided sequence information                                       and Fd:28/21%, respectively. In                            in this case, are applied to match
of the fragmented protein subunits,                                       average, 50% SVP were obtained from                        sequence candidates (Figure 6).
which were automatically calculated                                       LC-ETD analysis for the 3 subunits                         However, the applied calibration
based on the Vedolizumab protein                                          and 37% SVP from LC-CID. The                               provided for a mass accuracy better
sequence. Sequence Coverage (SC)                                          results confirmed the Vedolizumab                          than 2 ppm, which coincided with
and Sequence Validation Percentage                                        subunit sequence even in case of the                       the only sequence identified by ETD
(SVP) [2] were determined; the SVP                                        weakest spectra of the Fd (Figure 4).                      analysis in peak 2 (Figure 7). LC
calculation tolerated a terminal gap                                                                                                 [68-181] in Figure 5, amongst other
size of 15 and internal gap size of 3                                     Clipping variant analysis                                  candidates, was ruled out based on
missing fragments in the ion series.                                                                                                 poor mass accuracy (Figure 6) and
The observed SVP and SC values                                            The initial list of proposed clipping                      the absence of a match with the
obtained for ETD were Fc/2:41/27%,                                        candidates based on intact mass                            respective ETD spectrum.

Figure 6: Proposed clipping variants in peak 2 after application of a 10 ppm mass tolerance. The 2
entries at 12698.3 Da. with
x10 4
                                      G                 V Y                                                            A V
                           a
                                      GQ           P Q V Y T L P                        S L T C L V       F   Y P S D I A V E W E S y (47)
                                                                                                                                        Q
                                                      b (11)
   Intensity

                           b
                2.0                                 T Y H N H                    F                        D            Y L F   F SG D S D L     P                E P QGN S      E V
                            y

                                                                                                                                               y (52)                           y (67)
                1.0                y (3)                                                       b (31)
                                                                     y (18)   y (23)

                  0
                                           500    1000        1500   2000     2500     3000   3500        4000      4500       5000     5500        6000   6500     7000     7500        8000
                                                                                                          m/z

Figure 8: CID spectrum of the 12269.029 Da protein in peak 3 matching the sequence HC [342-450]. None of the other candidate sequences at 12698.3 Da
were identified by Middle-Down sequencing.

                                   x10 5
                                                                                                                                   25243.572
                                     2.0                                                                                          HC [229-450]
                       Intensity

  15.24
                                                                                                                                                              25380.648
                                     1.0
                                                                                                                                                             HC [228-450]

                                           0
                                               24,800           24,900            25,000                25,100             25,200              25,300             25,400              25,500
                                                                                                                     Da

                                   x10 5
                                                                                                                                               24475.019
                                                                                                                                        HC [1-228] Gln->pyro-Glu
                                     2.0
                       Intensity

  18.78                                                                                                        24337.957
                                     1.0                                                                  [1-227] Gln->pyro-Glu

                                           0
                                                          24,100               24,200                   24,300                 24,400                   24,500               24,600
                                                                                                                     Da

Figure 9: Intact mass spectra from chromatographic peaks 5 (top) and 7 (bottom). The annotated peaks show cleavage behind positions HC 227 and HC 228.
All peaks show a perfect overlap with the calculated isotope pattern (red) with a mass error between 0.4 and 1.5 ppm. The HC [228-450] was matched by
the SNAP algorithm even against a significant background of chemical noise.

The HC [342-450] clipping product                                              In addition, peaks were proposed as                             HC [1-229]|HC [230-450] (Figure 10).
at 12269.029 Da in peak 3 was                                                  clipping candidates, which weren’t                              All 4 peaks were matched with an
confirmed by ETD and CID, the CID                                              directly confirmed by Middle-Down                               average mass accuracy of 0.8 ppm
spectrum is shown in Figure 8.                                                 sequencing but represented the                                  and well matching isotope patterns.
                                                                               N-terminal and C-terminal fragments
The Mr 24348.231 base peak in the                                              of the same cleavage sites:
MaxEnt spectrum of Peak 4 was                                                  HC [1-227]|HC [228-450] and
confirmed by ETD as HC [238-450]                                               HC [1-228]|HC [229-450], adjacent
with a 29% SVP (data not shown).                                               to the theoretical SpeB cleavage site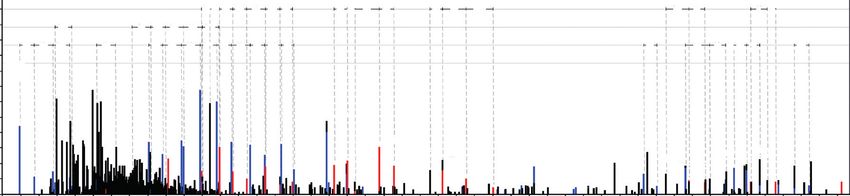
Summary                                             validated by their complementary                    The identity and amount of the
                                                    nature and mass accuracy (Figure 9,)                observed      cleavage       products
Three LC-MS runs of SpeB-digested                   and one by mass accuracy and                        were comparable between the
and reduced Vedolizumab (LC-MS,                     isotopic fidelity alone, in the absence of          Vedolizumab originator and bio-
LC-ETD, LC-CID) confirmed the                       alternative possible matches (Figure                similar drug substances (data not
expected cleavage site in the hinge                 caption 5). The results are summarized              shown), which indicates that clipping
region. In addition, the combined                   in Figure 10. In case of Vedolizumab,               analysis might become a useful
approach to qualify candidates by                   ragged ends of the Fc/2 and the Fd                  protein-based MAM approach
intact mass measurements for                        were obtained in the hinge region;                  in comparability, stability and aging
Middle-Down sequencing yielded                      and an overall of 6 unspecific                      studies.
6 more, minor, cleavage sites, 3 of                 cleavage sites were observed with
which were confirmed by direct ETD                  the implemented new workflows in
and CID analysis (Figures 7, 8), 2 were             BioPharma Compass.

Figure 10: Vedolizumab HC sequence from [1] with the confirmed main cleavage site (green), CID/ETD-confirmed sites (orange) and sites where the
identification was based on accurate mass and isotopic pattern matching (red).

    Conclusions                                                               • ETD and CID on the maXis II ETD UHR-QTOF
                                                                                were suitable to verify all clipping variants
    • A workflow was described to identify antibody                             subjected to MS/MS analysis, though ETD typically
      clipping variants based on subunit mass                                   provided 20-35% more sequence information.
      measurements and Middle-Down sequencing.                                • BioPharma Compass 2021 Clipping workflows,
    • A mass accuracy of well below 2 ppm was                                   both for the intact mass-based prediction as well
      important to provide sufficient specificity to define                     as for the Middle-Down sequencing facilitated the
      candidate sequences. This was achieved with                               prediction and confirmation of clipping variants
      monoisotopic mass assignments using the SNAP                              significantly to speed up potential drug substance
      algorithm.                                                                clipping analysis.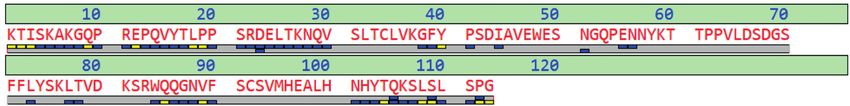
Learn More
You are looking for further Information?
Check out the link or scan the QR code.

www.bruker.com/biopharma-compass

                                                                                                                                                                                     to change specifications without notice. © Bruker Daltonics 11-2020, LCMS-176, Rev. 01, 1883859
References

[1] www.drugbank.ca/drugs/DB09033

                                                                                                     Bruker Daltonics is continually improving its products and reserves the right
[2] Resemann A, et al. (2016). Full validation of therapeutic antibody sequences by middle-up mass
    measurements and middle-down protein sequencing. MAbs. 8(2):318-30. www.ncbi.nlm.nih.gov/
    pmc/articles/PMC4966597/

For Research Use Only. Not for Use in Clinical Diagnostic Procedures.

Bruker Daltonics GmbH & Co. KG                             Bruker Scientific LLC
Bremen · Germany                                           Billerica, MA · USA
Phone +49 (0)421-2205-0                                    Phone +1 (978) 663-3660

ms.sales.bdal@bruker.com – www.bruker.com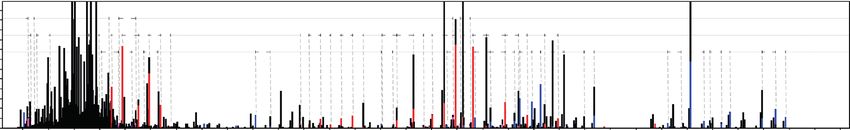
You can also read