PROVINCIAL CONSULTATIVE WORKSHOP REPORT - Science Technology & Innovation for Sustainable Human Settlements Roadmap
←
→
Page content transcription
If your browser does not render page correctly, please read the page content below
PROVINCIAL CONSULTATIVE WORKSHOP REPORT
       Science Technology & Innovation for
 Sustainable Human Settlements Roadmap
Contents
       Common                            1. Common purpose & Contents                        1.    Key issues

       purpose                           2. Introduction
                                                                                             2.
                                                                                             3.
                                                                                                   Visualising chart
                                                                                                   Priority interventions

                                         3. Overview                                         4.    Workshop feedback

                                         4. Setting the scene: Risk                    6. Preliminary analysis
The purpose of the STI 4 SHS
Roadmap is to unlock the potential          trajectories of South African              7. Way forward
of South Africa’s human settlements         settlements                                      1.    Various inputs consolidated
                                              1.   Background
for a decent standard of living; safe,                                                       2.    Opportunities to be appraised
                                              2.   Rationale for the Green Book
resilient and sustainable households                                                         3.    Draft Roadmap
                                              3.   South Africa’s urban future
and neighbourhoods via the smart                                                       8. References
                                              4.   FS population estimates 2050
uptake of science, technology and
innovation.                                   5.   FS vulnerabilities                  9. Acknowledgements
                                              6.   2050 projected changes in climate
                                                                                       Appendix A – Roadmap definition process
                                              7.   Implications for Free State
                                                                                       Appendix B - Stakeholder engagement strategy at
                                         5. Workshop inputs                            a glance
Introduction consultative workshop, which formed
part of a systematic provincial
(3)
KwaZulu-Natal Department of
consultative workshop series targeting Human Settlements (2)
The Science, Technology and Innovation government thought leaders, from
for Sustainable Human Settlements University of KwaZulu-Natal (3)
national, provincial and local
Technology Roadmap (STI 4 SHS government. eThekwini Municipality
Roadmap) will set out a 10 year plan for Stormwarning
a coordinated investment and The purpose of the workshops was to Water and Sanitation
collaboration between key stakeholders reflect on the current state of Environmental Planning and
in pursuit of the Common Purpose. The technology in human settlements, Climate Protection
STI 4 SHS Roadmap definition is to be envision a future preferred state, and Human settlements
underpinned by intensive engagement, identify the technologies, innovations
and extensive research (referenced and Research and Policy
and capabilities and the necessary
available for further scrutiny at “ingredients” to reach that state over
www.sti4shs.co.za ). time.
In order to engage relevant Fifteen participants from the following
stakeholders, a number of distinct organisations are acknowledged for
stakeholder groups were identified, viz. their active participation in the
government and civil society, academia, KwaZulu-Natal workshop:
private sector & industry and the
investment community. In the first Technology Innovation Agency (TIA)
round each stakeholder group is to be
(2)
engaged separately. This report records
inputs from the KwaZulu-Natal (KZN) Housing Development Agency (HDA)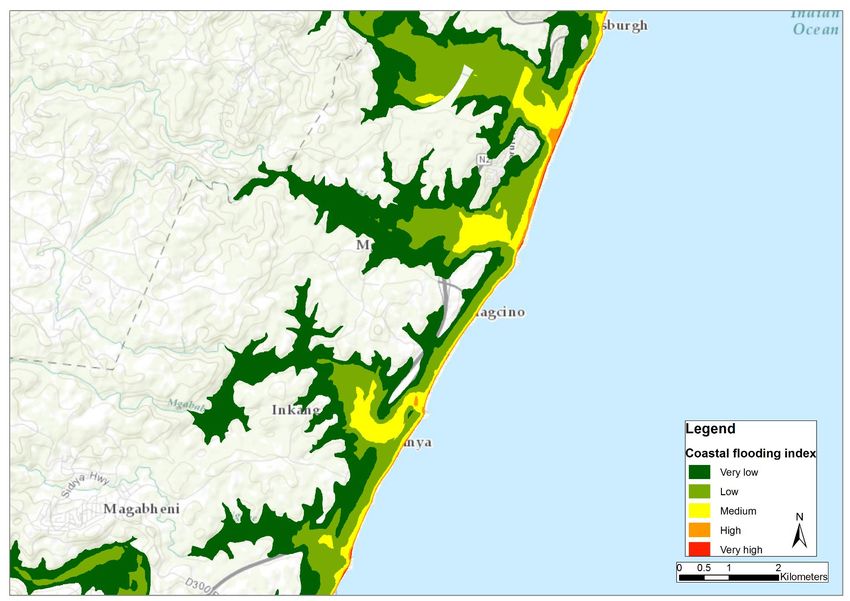
Overview                                 Workshop preliminaries
Roadmapping                              The CSIR hosted the KwaZulu-Natal
                                         Provincial Consultative Workshop
                                                                                    The Green Book
Roadmapping uses a graphical             on the 5th of October 2018 in
approach to visualise an entire          Bloemfontein. The STI 4 SHS Draft
strategy on a page. It provides a
framework to help organisations
                                         Desktop Review Trends Report was      Risk trajectories of South African
tackle fundamental questions             electronically provided to
applicable in any strategic context      participants before the meeting,                 settlements
and is used extensively at company,      and an excerpt on Mega-challenges
sector and national levels to align      and Trends presented (available at    KwaZulu-Natal initial findings
investment and research with             www.sti.shs.co.za).
strategic goals.
                                         The workshop participants were                  18 January 2019
Significant features of roadmapping      then presented a province-specific
are its ability to build consensus,      extract from the forthcoming Green
breadth and versatility: roadmaps        Book focussing on Risk trajectories
can encompass a complex scope of         of South African settlements. This
issues and long timeframes, whilst       input is incorporated into this
at the same time focusing down on        report and will heavily inform the
critical details, leading to decisions   validation phase of roadmap
and actions.                             development.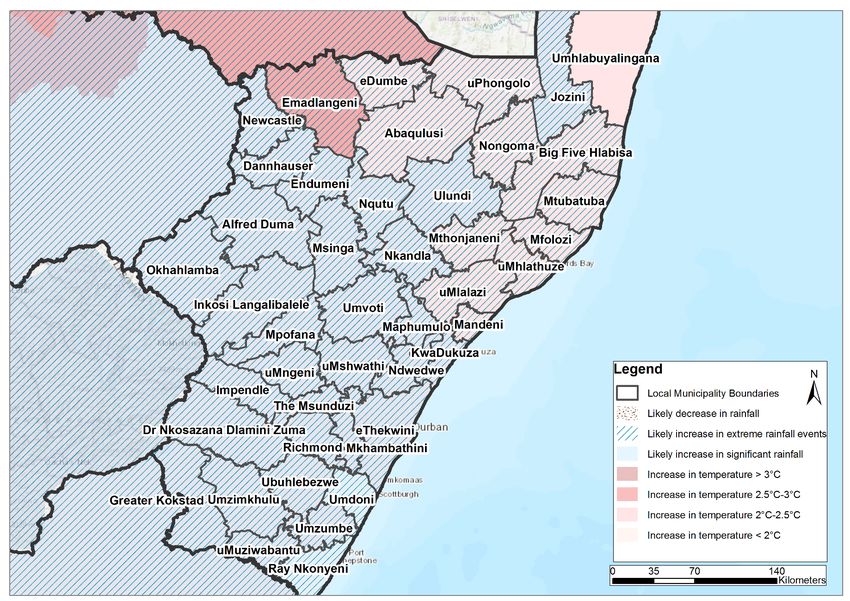
Background
•   Strong evidence that extreme weather events are becoming more frequent and intense
    with climate change expected to amplify these trends, particularly heat waves, floods,
    droughts, wildfires and storm surges
•   Strong evidence to support that Urbanisation will continue & that this will place even
    more pressure on infrastructure and service delivery
•   More frequent and intense events combined with a growing and urbanising population,
    poor land use practices, growing informal sector = likely exacerbate the vulnerabilities
    of communities and place more people at risk of climate induced disasters
•   Growth can be a catalyst for economic growth but effective planning and policy
    interventions are needed
•   Spatial planning will be vital to planning for peoples sustainable livelihoods

5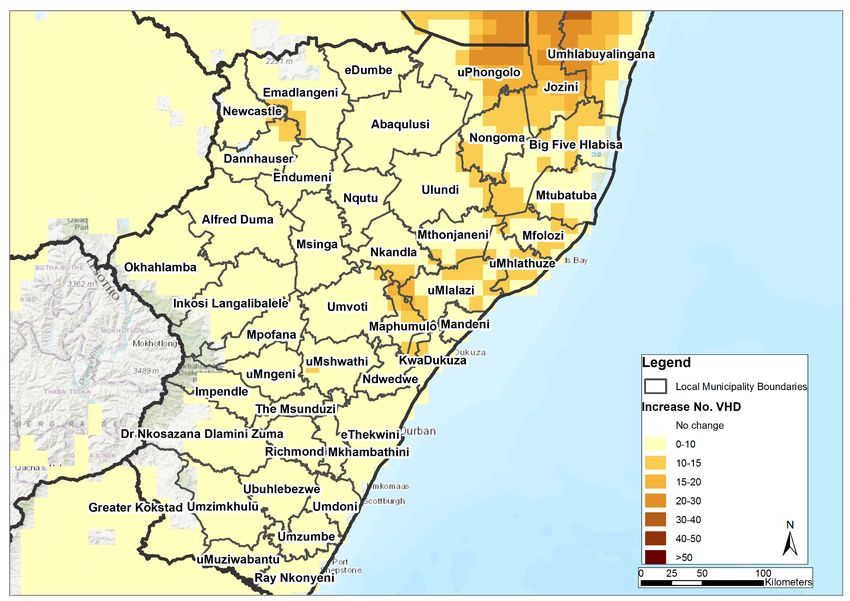
Rationale for the Green Book

        Knowing  what change to adapt for and how to adapt for this
           change is of critical importance to decision makers

             involved in the planning and design of human
                                    settlements.

          The Green Book was commissioned with the aim of supporting
        municipal planning on the development of climate-resilient cities and
                settlements through research in climate adaptation.

6
South Africa’s urban future
                              SA is expected to follow the worldwide trend
                              - experiencing high population growth and
                              urbanisation. Current projections indicate
                              and additional 19-24 million people to be
                              added to the country in the next three
                              decades. Vast majority of growth to be
                              confined to cities and towns

7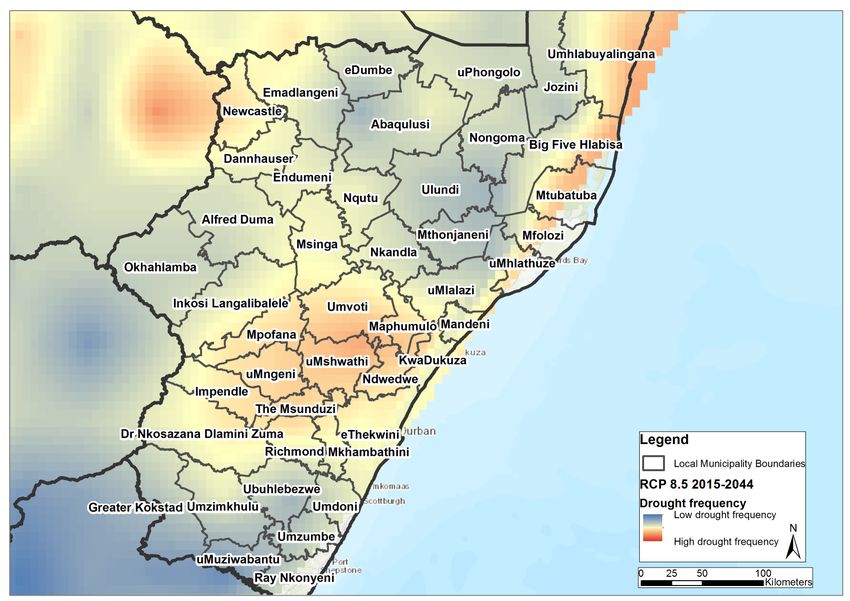
KwaZulu-Natal’s population estimates 2050

                     KwaZulu-Natal
                       4 596 071

     KwaZulu-Natal’s population is projected to reach
8
           14.7 – 15.7 million people by 2050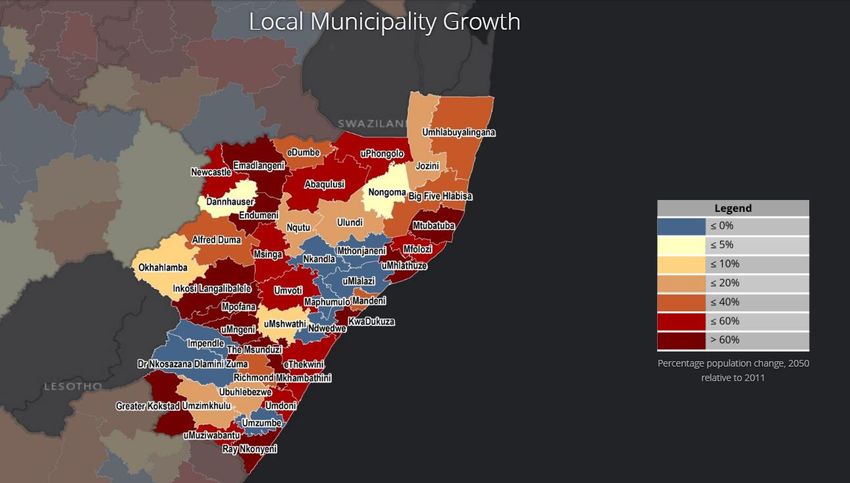
KwaZulu-Natal’s population estimates

9

KwaZulu-Natal’s population estimates

10
KwaZulu-Natal’s population estimates

                                      Pietermaritzburg, Richards Bay and
                                          New Castle are expected to
                                              grow significantly.

                                      Population decline in Service Towns
                                      between Stanger and Richards Bay

                                      46% of the province's total growth is
                                      projected to occur in the eThekwini
                                               City Region Area

11                                     Significant Growth along the coast
KwaZulu-Natal’s LM vulnerabilities
• Socio-economic: Households vulnerabilities (household composition, income
composition, education, health, access to basic services, safety & security)
• Economic vulnerability: Economy of the LM (diversification, size of economy, labour
force, GDP growth/decline pressure, inequality)
• Physical vulnerability: Access & infrastructure (road infrastructure, housing types,
density, accessibility within the LM)
• Environmental vulnerability: Air quality, environmental governance, competition
between ecology & urban encroachment)
12KwaZulu-Natal’s Local Municipalities vulnerabilities
MUNICIPALITY SEV Trend EVI Trend PV Trend EV Trend
eThekwini 3.67 ↘ 4.02 ↗ 6.35 ↘ 6.26 No Trend
Umdoni 6.66 ↗ 6.76 ↗ 5.70 ↗ 2.65 No Trend
Umzumbe 8.58 ↗ 5.05 ↘ 6.16 ↗ 3.60 No Trend
uMuziwabantu 7.70 ↘ 3.45 ↘ 5.79 ↗ 5.86 No Trend
Ray Nkonyeni 5.26 ↘ 5.56 ↗ 6.00 ↗ 3.01 No Trend
uMshwathi 6.92 ↘ 4.83 ↘ 5.32 ↗ 4.81 No Trend
1. High % violent crimes uMngeni 3.63 ↘ 6.17 ↗ 5.02 ↘ 7.10 No Trend
2. High child mortality Mpofana 5.75 ↘ 4.55 ↗ 4.22 ↘ 6.76 No Trend
rates 4.38 4.83 9.44
Impendle 7.60 ↗ ↘ ↘ No Trend
3. Low literacy rate
The Msunduzi 3.87 ↘ 6.28 ↗ 4.90 ↘ 6.97 No Trend
Mkhambathini 9.38 ↘ 4.68 ↘ 4.35 ↗ 3.17 No Trend
Richmond 6.79 ↘ 4.47 ↘ 5.18 ↘ 3.70 No Trend
Okhahlamba 7.89 ↗ 3.33 ↘ 5.74 ↘ 6.49 No Trend
1. Low GDP growth
Inkosi Langalibalele 7.31 ↗ 4.88 ↘ 5.17 ↘ 7.04 2.NoLow
TrendGDP production &
Alfred Duma 6.34 ↘ 5.59 ↗ 7.33 ↘ 4.99 NoLow
TrendGDP per Capita
1. High % of households live
under minimum living level Endumeni 4.11 ↘ 5.24 ↘ 4.83 ↘ 5.21 No Trend
2. High child mortality rate Nqutu 8.33 ↘ 2.71 ↘ 6.16 ↗ 4.56 No Trend
3. High % of population with 3.65 7.36 4.48
Msinga 9.94 ↗ ↘ ↗ No Trend
lack of access to services
Umvoti 7.65 ↗ 4.56 ↘ 6.43 ↗ 3.97 No Trend
13 Newcastle 4.94 ↗ 7.06 ↗ 4.76 ↘ 4.34 No Trend
4.02 3.87 ↗ 6.12 No TrendNewcastle 4.94 ↗ 7.06 ↗ 4.76 ↘ 4.34 No Trend
Emadlangeni 7.80 ↗ 4.02 ↘ 3.87 ↗ 6.12 No Trend
Dannhauser 7.15 ↗ 7.05 ↘ 4.98 ↗ 4.90 No Trend
eDumbe 7.58 ↘ 6.15 ↘ 4.75 ↘ 6.61 No Trend
uPhongolo 7.43 ↘ 6.13 ↘ 5.96 ↘ 2.68 No Trend
Abaqulusi 6.43 ↘ 5.25 ↘ 4.77 ↘ 3.77 No Trend
Nongoma 8.56 ↘ 2.56 ↘ 6.74 ↘ 2.75 No Trend
Ulundi 7.61 ↘ 4.67 ↘ 6.37 ↗ 4.67 No Trend
Umhlabuyalingana 8.69 ↘ 4.88 ↘ 10.00 ↘ 6.98 No Trend
Jozini 8.47 ↘ 4.66 ↘ 8.22 ↘ 4.76 No Trend
Mtubatuba 7.05 ↘ 3.59 ↘ 5.62 ↗ 5.60 No Trend
Big Five Hlabisa 7.99 ↘ 4.12 ↘ 6.74 ↘ 7.19 No1.Trend
Low GDP growth
2.No
Low GDP production &
Mfolozi 6.89 ↘ 4.68 ↘ 5.40 ↗ 3.66 Trend
Low GDP per Capita
uMhlathuze 3.92 ↘ 5.60 ↗ 6.23 ↘ 4.44 No Trend
uMlalazi 8.04 ↗ 5.64 ↘ 7.14 ↗ 4.53 No Trend
Mthonjaneni 8.26 ↘ 5.09 ↘ 6.25 ↗ 5.10 No Trend
Nkandla 8.89 ↗ 3.13 ↘ 7.16 ↗ 3.56 No Trend
Mandeni 5.76 ↘ 4.31 ↘ 5.35 ↘ 5.29 No Trend
KwaDukuza 4.65 ↘ 7.03 ↗ 4.14 ↘ 2.61 No Trend
1. High % violent crimes
2. High child mortality Ndwedwe 8.80 ↗ 5.77 ↘ 5.77 ↗ 3.86 No Trend
rates Maphumulo 9.03 ↗ 3.44 ↘ 5.66 ↗ 5.54 No Trend
3. Low literacy rate
Greater Kokstad 4.42 ↘ 5.44 ↗ 6.52 ↘ 4.39 No Trend
Ubuhlebezwe 7.81 ↘ 5.43 ↘ 7.07 ↗ 3.28 No Trend
Umzimkhulu 7.95 ↗ 4.34 ↘ 6.58 ↘ 6.12 No Trend
14 Dr Nkosazana Dlamini Zuma 7.78 ↗ 2.94 ↘ 6.27 ↗ 9.34 No TrendKwaZulu-Natal’s Local Municipalities vulnerabilities
MUNICIPALITY SEV Trend EVI Trend PV Trend EV Trend
eThekwini 3.67 ↘ 4.02 ↗ 6.35 ↘ 6.26 No Trend
Umdoni 6.66 ↗ 6.76 ↗ 5.70 ↗ 2.65 No Trend
Umzumbe 8.58 ↗ 5.05 ↘ 6.16 ↗ 3.60 No Trend
uMuziwabantu 7.70 ↘ 3.45 ↘ 5.79 ↗ 5.86 No Trend
Ray Nkonyeni 5.26 ↘ 5.56 ↗ 6.00 ↗ 3.01 No Trend
uMshwathi 6.92 ↘ 4.83 ↘ 5.32 ↗ 4.81 No Trend
uMngeni 3.63 ↘ 6.17 ↗ 5.02 ↘ 7.10 No Trend
Mpofana 5.75 ↘ 4.55 ↗ 4.22 ↘ 6.76 No Trend
Impendle 7.60 ↗ 4.38 ↘ 4.83 ↘ 9.44 No Trend
The Msunduzi 3.87 ↘ 6.28 ↗ 4.90 ↘ 6.97 No Trend
4.68 4.35 3.17 1. Road infrastructure
Mkhambathini 9.38 ↘ ↘ ↗ No Trend
(Low road density)
Richmond 6.79 ↘ 4.47 ↘ 5.18 ↘ 3.70 No Trend
2. High traditional
Okhahlamba 7.89 ↗ 3.33 ↘ 5.74 ↘ 6.49 No Trend population covering
Inkosi Langalibalele 7.31 ↗ 4.88 ↘ 5.17 ↘ 7.04 No Trend large area
Alfred Duma 6.34 ↘ 5.59 ↗ 7.33 ↘ 4.99 No Trend
Endumeni 4.11 ↘ 5.24 ↘ 4.83 ↘ 5.21 No Trend
Nqutu 8.33 ↘ 2.71 ↘ 6.16 ↗ 4.56 No Trend
Msinga 9.94 ↗ 3.65 ↘ 7.36 ↗ 4.48 No Trend
Umvoti 7.65 ↗ 4.56 ↘ 6.43 ↗ 3.97 No Trend
15 Newcastle 4.94 ↗ 7.06 ↗ 4.76 ↘ 4.34 No Trend
4.02 3.87 ↗ 6.12 No TrendNewcastle 4.94 ↗ 7.06 ↗ 4.76 ↘ 4.34 No Trend
Emadlangeni 7.80 ↗ 4.02 ↘ 3.87 ↗ 6.12 No Trend
Dannhauser 7.15 ↗ 7.05 ↘ 4.98 ↗ 4.90 No Trend
eDumbe 7.58 ↘ 6.15 ↘ 4.75 ↘ 6.61 No Trend
uPhongolo 1.7.43 ↘
Road infrastructure 6.13
(Low ↘ 5.96 ↘ 2.68 No Trend
Abaqulusi ↘ density) 5.25
6.43 road ↘ 4.77 ↘ 3.77 No Trend
2. Low accessibility within
Nongoma 8.56 ↘ 2.56 ↘ 6.74 ↘ 2.75 No Trend
municipality
Ulundi ↘ traditional4.67
7.613. High ↘ 6.37 ↗ 4.67 No Trend
Umhlabuyalingana 8.69 ↘ covering 4.88
population large ↘ 10.00 ↘ 6.98 No Trend
area
Jozini 8.47 ↘ 4.66 ↘ 8.22 ↘ 4.76 No Trend
3.59 5.62 5.60 1. Ecological infrastructure
Mtubatuba 7.05 ↘ ↘ ↗ No Trend
(High amounts of conservation
Big Five Hlabisa 7.99 ↘ 4.12 ↘ 6.74 ↘ 7.19 No Trend
& protected areas)
Mfolozi 6.89 ↘ 4.68 ↘ 5.40 ↗ 3.66 No Trend 2. Water resources
5.60 6.23 4.44 3. Environmental governance
uMhlathuze 3.92 ↘ ↗ ↘ No Trend
(Encroachment on protected
uMlalazi 8.04 ↗ 5.64 ↘ 7.14 ↗ 4.53 No Trend
areas & stressed catchments
Mthonjaneni 8.26 ↘ 5.09 ↘ 6.25 ↗ 5.10 No Trend
Nkandla 8.89 ↗ 3.13 ↘ 7.16 ↗ 3.56 No Trend
Mandeni 5.76 ↘ 4.31 ↘ 5.35 ↘ 5.29 No Trend
KwaDukuza 4.65 ↘ 7.03 ↗ 4.14 ↘ 2.61 No Trend
1. Environmental
Ndwedwe 8.80 ↗ 5.77 ↘ 5.77 ↗ 3.86 No Trend governance
Maphumulo 9.03 ↗ 3.44 ↘ 5.66 ↗ 5.54 No Trend (Encroachment on
protected areas &
Greater Kokstad 4.42 ↘ 5.44 ↗ 6.52 ↘ 4.39 No Trend
stressed catchments
Ubuhlebezwe 7.81 ↘ 5.43 ↘ 7.07 ↗ 3.28 No Trend 2. Water resources
Umzimkhulu 7.95 ↗ 4.34 ↘ 6.58 ↘ 6.12 No Trend
16 Dr Nkosazana Dlamini Zuma 7.78 ↗ 2.94 ↘ 6.27 ↗ 9.34 No TrendKwaZulu-Natal’s Local Municipalities vulnerabilities
Top 4 most
vulnerable LM’s
• Ndwedwe
• Dannhauser
• Mkhambathini
• eDumbe
172050 Projected changes in climate
Low mitigation (RCP 8.5)
2050 Temp: 1.9°C – 3.1°C increase in min and max temp
Projected changes Very Hot Days (vhd)
in climate • More vhd projected for the north (up to 34 vhd more)
Extreme Rainfall Events
• Mix signal of increase and decrease over the province
• Increases up to 6 extreme rainfall events more
annually projected for the south of KZN
• Decreases of up to 3 extreme rainfall events less
projected for area bordering Lesotho
High mitigation (RCP 4.5)
Temp: 1.4°C – 2.7°C increase in both min and max temp
Very Hot Days
• More vhd projected for the north (up to 20 vhd more)
Extreme Rainfall Events
• Increase of up to 6 extreme rainfall events more
annually projected for southern and central KZN
• Decreases of up to 5 extreme rainfall events less
projected for area bordering Lesotho and along the
northern coastline of KZN.
18Changes in heat stress
Increase no. Very
Hot Days
Low Mitigation
Scenario
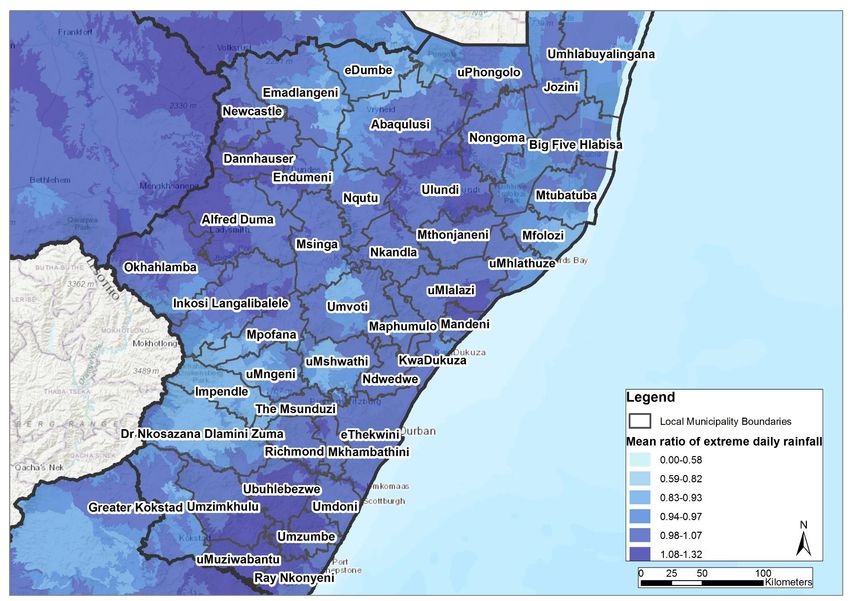
19Flooding
The mean ratio of the
near-future (2021-2050)
and current (1961-1990)
extreme daily rainfall
(95th percentiles) for
each quinary
catchment.
20Changes in drought
Drought Index (SPI)
21Impact of Climate change on agriculture (RCP8.5)
2050
Impact of CC on
agriculture
Warmer and wetter with more
extreme rainfall events.
#1 Sugar-cane
Potential increase in sugarcane yield.
However, increased exposure to pests
such as eldana and chilo.
Hotter and wetter
#1 Milk and cream
Hot and moist conditions cause
increased spread of disease and
parasites. Potential increase in heat
stress which could negatively affect
conception rates, milk yield and milk
quality.
22Impact of Climate change on agriculture (RCP8.5)
2050
Impact of CC on
agriculture Warmer and wetter with more
extreme rainfall events.
#2 Beef cattle
Increased water availability. Hot and
moist conditions cause increased
spread of disease and parasites.
Reduced growth & reproduction
performance due to heat stress.
Hotter and wetter
#2 Potatoes
Increase in tuber yield due to
increased concentration of CO2. Root
crop plants benefit from elevated
carbon dioxide levels due to higher
rates of photosynthesis.
23Impact of Climate change on agriculture (RCP8.5)
2050
Impact of CC on
agriculture
5.42%
Loss in Agriculture GDP
4.17%
Loss in Agriculture GDP
24Coastal flooding exposure
Coastal flooding
index 131 580 buildings
are located in the coastal risk zone
12 buildings
are located in the Very high and High
risk areas
650 402 people
are located in the coastal risk zone
73 people
are located in the Very high and High
risk classes
25Implications for KwaZulu-Natal
• The significant population growth projected (4.5 million by 2050 for KZN) if not
managed and planned for effectively, will place an enormous amount of pressure
on bulk infrastructure delivery and will have critical implications for peoples
exposure to natural hazards
• The growth projected for the coastal strip needs to be particularly well managed
• Increase demand for critical resources
• Very high economic vulnerability in LM’s and worsening signals for 11 LM’s & high
socio-economic vulnerabilities (households) for 16 of the LM’s will make adaptation
more difficult
• Heat stress on ecology towards the north east of the province (less severe than rest
of country)
• Hot and moist conditions can cause increased spread of disease and parasites
• Warmer climate projections will have relevance for energy demand (increase
26 demand for cooling in summer due to maximum temperature increase) Data management
The Key issues were as follows: Gini coefficient
Key issues
Efficiency in our financial spending
After discussion in groups thirteen Key issues towards solving our problems
were identified by workshop participants and
placed on a prepared matrix with categories Monitoring tool tokens in water usage
which derived from human settlements scoping
Priority interventions
Water loss/distribution
diagram posted below.
Water recycling innovation technology
Sanitation; transport; water pollution and
Electricity data management were shortlisted as
(Appropriate) Design of housing priority issues for Science Technology
typologies and Innovation for Sustainable Human
Settlements for MP by casting votes.
Water scarcity
Extreme terrain (construction
solutions) Priority interventions were identified for
the Key issues above were then further
Sanitation developed in groups with the aid of the
Transport Visualising chart, below.
Water pollution and lack of clean
drinking waterCode: Why are we Products, Capabilities and 0 – 2 yrs 2 – 5 yrs 5 – 10 yrs Negatives?
ISSUE not there yet? technologies and partnerships
services
Group
nominated Hint – Fill this
Hint – Fill this column in
INTERVENTION
column in first Fill these columns in last
second…
#1*
SABS 100% of Greywater/
GREYWATER Skills & Knowledge Identification, Portfolio rainwater
Officials are not aware of valuation and Agrement officials
RECYCLING of in new
and available technologies NHBRC “trained” homes were
RAINWATER
accreditation accredited Procurement
appropriate
HARVESTING process Maintenance & products artisans
service capacity
Group Hint – use the QUALITY CHECK #2
nominated cheat sheet Will the interventions Rapid report
INTERVENTION • overcome conservatism?
back
• stimulate investment?
#3* • Provide decision support? 6 mins per
Group work
60 minutes Visualising chart groupInterventions identified for sanitation: Differentiated waste water treatment process Selection of the most appropriate sanitation facility with communities Crowd sourcing information on failures of sanitation infrastructure Community ablutions blocks Improved design Off-grid sanitation Decentralised systems
Workshop inputs populated in the Visualising chart are tabulated below:
 Sanitation
Interventions (s)         Code: Why are we not         Products,            Capabilities &     0 - 2 years       2 - 5 years    5 - 10 years
                          there yet?                   technologies &       partnerships
                                                       services
Communication             Lack of resources,           Web based            Cellphone          Status quo.       Pilots         Joint ownership
monitoring for design     capacity, lack of            platforms,           companies,         Community                        community/gov.
and maintenance for       partnership, dependency smartphone apps, insurance                   engagement
social uptake             syndrome, lack of access wifi city                companies, NGO's
                          to communication                                  and CBO's, UKZN
                          channels
Alternative sanitation    Legislation, financial, lack Online training, new WRC, DWS, UKZN     Testing solutions Development Alternative
treatment and             of skills, disconnect        treatment                               (Gates foundation) of guidelines sanitation as a
infrastructure design     between legislation and processes                                                       for AS        standardised
                          practice                                                                                              solution for new
                                                                                                                                developments

Alternative business      Lack of                   Accessible multi- GCF (International       Creating the      One/two        Successful small
models e.g. Recycling,    entrepreneurship,         functional platform funding), DWS, All     environment of    successes      business using
composting, urban         conservative approach,    including sanitation, departments XXX,     alternative                      waste as
forming, public/private   lack of knowledge track   waste management, UKZN                     thinking                         resource. Much
partnership, community    record, risk aversion     urban agriculture,                                                          reduction of
entrepreneurs.                                      etc.                                                                        water
                                                                                                                                consumption
Water pollution
Interventions (s) Code: Why are we not Products, Capabilities & 0 - 2 years 2 - 5 years 5 - 10 years
there yet? technologies & partnerships
services
Waste recycling: Lack of skills, but incentive Open source Local Policy buy-in. Pilot projects Zero waste.
composting, gold recovery is not there to be technology communities, Approval of Importing waste
from PC's, plastic encouraged enough to technology business plans. to be recycled.
recycling. Regulate waste venture into the necessary innovation
management. Reduction fields. Policy makers, they agency, CSIR,
of agricultural pesticide do not have the technical Universities
and herbicide skills. Production factors.
Infrastructure Investment factors. Social Adhere to existing Civil society Increase skills Some success Get the standard
development: Piping, factors: History and the legislation with groups and capabilities should be visible of water
treatment fecility re- refusal to change. regards to quality for treatment cleanliness back
design. Lack of clean plants - looking at to where it was
drinking water: Rainwater smaller towns. pre 2013
harvesting, Drinking and
localised/household water waste water
treatment. Smaller water treatment plants
treatment plants could be need to be
seen as alternatives. looked at.
Cheaper to build and
maintain.Sanitation
Interventions (s) Code: Why are we not Products, Capabilities & 0 - 2 years 2 - 5 years 5 - 10 years
there yet? technologies & partnerships
services
Water conservation and Policy and regulatory Leakage Water Replace ageing 15% non-
demand management. framework. Lack of management. research infrastructure. revenue water
Low flush sanitation understanding in decision Pressure commission, Pressure target. Policies
systems. making. management. DWAF management. published,
Replacement of Implement low implemented
aging infrastructure. flush sanitation and informed
Low flush sanitation options.
systems. Recycle
and reuse of grey
water.Interventions identified for data management: Quality management systems Spatially linked data Integrated data systems that talk to each other Integrated information sharing tools/systems Community generated data Sharing of data Standardized archival systems Cloud based storage Standard duty management format Link from data to decision making
Data Management

Interventions (s) Code: Why are we not   Products, technologies & Capabilities &          0 - 2 years      2 - 5 years     5 - 10 years
                  there yet?             services                 partnerships

Human           Skills and resources     Technical studies, socio-   Technical experts,   Get support/buy- Secure          Secure
settlement data scarcity                 economic surveys,           community            in               resources and   resources and
updating and                             GIS/SPSS etc., quality                                            build skills    build skills
verification                             control, set tolerance
                                         levels
Intergrated     Competition, distrust,   Data platform,           Government              Support/buy-in   Access       Accessible data
sharing         financing/profit,        agremeements between     departments                              resources,   warehousing
tools/systems   complexity               partners                 academia civil                           SLA/MOA/MOU, (integrated)
                                                                  society community                        IT solutions
                                                                  individuals private
                                                                  sector
Analysis and     Social and cultural     User-friendly reporting, Decision makers:        Identify network Established     Evidence based
dissemination of perceptions currently   knowledge disruption     Top officials,          of decision-     network and     decisions
info to inform informing decision                                 politicians, IT         makers, testing system
decision making making                                            solutions               data formats for
                                                                                          useability
Intervention priorities identified for transport: Transport to places of employment Costs, mode (taxi, bus, train), Times Safety (road) Transport inefficiency
Transport
Interventions (s)    Code: Why are we Products, technologies & Capabilities &               0 - 2 years     2 - 5 years    5 - 10 years
                     not there yet?   services                 partnerships

Transport planning. Outdated transport      Magnetic lavitation          Engineering council Research and   Planning,      Introduction of
Integration and      technology.            speed trains (bullet         of SA. SANTACO.     development.   budgeting and high speed rail
connectedness        Outdated legislative   trains) energy saving.       SANRAL. PRASA.      (policy)       implementation transport
(MR57). Reduction of framework.             White paper and green                                                          between
cost of                                     paper on transport                                                             Pietermaritzburg
transport/import.                           legislation                                                                    and Durban and
Travel time                                                                                                                DBN.
reduction.
Reduced travel time Unformalised taxi       Revisit and formalise taxi                                                     Increased safety
directly propotional industry. Outdated     industry. Revitalise taxi                                                      and functionality
to reduced exposure and unmaintained        recap programme.                                                               in transport
to road accident.    transportation                                                                                        modes e.g. ICT:
                     network                                                                                               wifi and reduced
                                                                                                                           travel times.
Energy harvesting    Zero GDP growth Energy harvesting road                                                                Energy efficiency
innovation           owing to poor          pads. Training for                                                             and recycle by
                     infrastructure. Skills personel.                                                                      using transport
                     shortage to adress                                                                                    roots to generate
                     the infrastructure                                                                                    energy
                     upkeep.
Preliminary analysis
Data (servers and PC's). and sharing infrastructure (systems and
processes) as well as social cohesion.
Data ELT No negatives were identified for
interventions for water pollution. High For transport-related interventions, the
As recorded above, the following data
points were captured from the likelihood of success is estimated for likelihood of success is considered to be
workshop: waste beneficiation interventions as dependent on political will and should
Key issues n = 13 they are low tech, and require low skills be founded upon a gap analysis.
Prioritised Key issues n = 4 which are easily trainable. For Negatives were identified as follows:
Priority interventions n = 12 infrastructure related intervention lack of political will and wisdom,
critical success factors are enforcement shrinking GDP leading to less spending
of regulations, and revised occupancy on infrastructure, introduction of a
Likelihood of success and
standards for RDP houses (especially speed train will compromise the taxi
negatives with neighbourhood and service industry.
Workshop participants recorded that capacity design for densification).
there are no negatives associated with
sanitation interventions proposed. Cost was negatively associated with
Success was considered possible, upgrading data for human settlements.
subject to development of new skills, Updating data is resource – intensive.
infrastructure, policy, new funding Critical success factors identified for
sources, legislation and equipment data management were data collectionPreliminary analysis
Key issues
Thirteen Key issues were identified by
Key issues Sum of
workshop participants, similar issues
Count votes
were clustered thematically and then
Efficiency in our financial spending
prioritised by vote as follows: towards solving our problems 1
Monitoring tool tokens in water usage 1
Water loss/distribution 1
Water recycling innovation technology 1 6
Electricity 1 2
Gini coefficient 1 1
(Appropriate) Design of housing
typologies 1 2
Water scarcity 1 2
Extreme terrain (construction solutions) 1 2
Transport 2 12
Water pollution and lack of clean drinking
water 2 6
Data management 1 4Barriers
Barriers to uptake of STI 4 SHS for
selected interventions as identified in
the Visualising chart were distributed as
follows:
Count
Other
Policy and regulatory framework
Undesirable social and/or environmental effects
Infrastructure and maintenance factors
Investment factors
Production factors
Skills and knowledge
Cultural and perception factors
Demand
Technological factors
0 1 2 3 4 5 6 7 8 9Clusters, profiles and priorities
Way forward Gap analysis
CONSULTATIVE WORKSHOPS AND INTERVIEWS Opportunities and benefits analysis
WEBSITE AND ELECTRONIC SURVEY
Selection framework
Demand-side needs
DESKTOP RESEARCH Targets
-STI programmes
-projects Investment pipeline
Supply-side Innovation trends
-strategies barriers -international Costing
-initiatives -local Implementation plan
Barriers Monitoring and evaluation plan
• Steering • Roadmap • Out-of-the- • Exhibition • Incubation • STI 4 SHS Forum
Committee advisory Box • Innovations forum • Electronic surveys 1 & 2
• Planning panel Conference register • Investors • National workshop
Committee • Specialist • Academia • Black-box Roundtable
• Project Interviews, and NSI session
team as Advisory • Case book
identified
ALL
PROJECT ADVISORY ACADEMIA INDUSTRY INVESTORS
Various inputs consolidatedOpportunities to be appraised
Interventions identified in the desktop reviews, and in provincial consultative
workshops will be sorted according to opportunity clusters and prioritised in
• Prioritised accordance with “key issues” identified in the workshop engagement. The three
interventions obtaining the most votes per workshop will be validated.
The validation process will systematically evaluate costs, and benefits, per intervention
• Validated taking both demand and supply into consideration. These are to be compared to
existing capabilities in consultation with expert advisors. Overall likelihood of success
will be estimated, based on consolidation of validation criteria. Quick wins will be
identified.
Alignment with vulnerabilities and goals selected from the NUA, NDP, SDGs and IUDF
• Impact will be assessed, to determine the potential impact of each intervention. The impacts
will be consolidated to cluster level.
Based on the prioritisation, validation, and impact assessments, the interventions will
be ranked according to their strategic alignment, value, likelihood of success and
• Shortlisted impact. This is the draft investment portfolio. Collaborators and partners will be
identified for the most promising technologies, and a draft implementation plan will be
co-created.Draft roadmap The advanced Draft STI 4 SHS Roadmap is currently scheduled for June 2019. It will set out a 10 year plan for a coordinated investment and collaboration plan between key stakeholders. Following various targeted engagements, including the Provincial Consultative Workshop series, a Draft STI 4 SHS Roadmap Framework will be presented which will summarise the status quo, opportunities, define an investment portfolio and provide a detailed implementation plan. To stay abreast of project progress and opportunities to participate, register as a STI 4 SHS Forum member at www.sti4shs.co.za.
References
Le Roux, A. 2018. The Green Book: Risk trajectories of South African settlements – Free State initial findings.

Gibberd, J. 2018. Mega-challenges and trends in human settlements. STI 4 SHS Provincial Consultative Workshop: FREE STATE
http://www.sti4shs.co.za/sites/default/files/2018-09/GP%20HumanSettlementsTrends.pdf

Napier, M., Sebake, N., Crankshaw, B. 2018. Science Technology and Innovation for Human Settlements Roadmap Desktop Review Trends
Report: STI 4 SHS – DRAFT FOR DISCUSSION (23 October 2018).

This document is part of the STI 4 SHS Provincial Consultative Workshop Report series, which can be accessed at www.sti4shs.co.za
(Events - past events)
Acknowledgements
Workshop hosts CSIR, Durban

Project made possible by Department of Science and Technology (project sponsor), Technology Innovation Agency (project management)
National coordinators
            Mapula Letshweni                                              SALGA
            Tenda Rasikhanya                                              Department of Water and Sanitation
            Ngube Thokwana; Hlengiwa Koopa and Matsimbi Mokondo           Human Settlements
Engagement preparation
            Alize le Roux, Coralie Van Reenen, Jeremy Gibberd, Mapule Letshweni, Beth Crankshaw, Peta De Jager, Jennifer Mirembe, Lorato
            Motsatsi, Mark Napier, Francois Prinsloo, Tshepang Mosiea, Hlengiwe Koopa, Matsimbi Mokondo, Sizo Sebake, Linda Godfrey, Tiyani
            Ngoveni, Ashaal Roopchan and Anitha Ramsuran
Workshop facilitator and anchors
            Sheldon Bole; Peta de Jager                       CSIR
Administration, logistics and electronic proceedings
            Letta Chale, CSIR
Appendix A - Roadmap definition process
Preparation Visioning Roadmap development Implement & refine
Establish Planning Steering Committee E-survey + 9x National Quarterly Expert
Committee; identify vision to frame long- stakeholder workshop and Committee meetings
Expert Common purpose, term goals and draft publish for for 10-year
workshops to
judgement scope, terms of objectives identify projects, comment implementation
and references and gaps, opportunities, period to invest &
consensus method barriers & priorities steer
40 key stakeholders 20 decision-makers 300 stakeholders + Public participation 20 decision-makers
Conduct a status Future scenarios for Define an Monitor & evaluate
Data & quo trend analysis sustainable human Cost - investment portfolio implementation and
and investigate STI 4 settlements, STI benefit of Roadmap update plan
analysis
SHS opportunities, activities and
capabilities, projects
potential, maturity
and industry
readiness Focused technical input via interview Investment partners
Months 1 - 4 Months 1 - 6 Months 1 - 18 Years 1 - 12
After Tam, 2012, p10
Extract from Roadmap Review report of the STI 4 SHS Draft Status Quo Report.Appendix B - Targeted engagements strategy at a glance
Private sector NGOs and
NSI Academia Investor Regulator Government
& business NPOs
Project Provincial Academic Off-the-Wall Investor STI4SHS
Ad hoc
structures workshops advisory Showcase Roundtable Forum
• Steering • Interviews, • Roadmap • Out-of-the- • Exhibition • Incubation • Website
Committee as advisory Box • Innovations forum portal
• Planning identified panel Conference register • Cost • Electronic
Committee • Scientific & • Black-box models surveys 1 &
• Project review session 2
team Committee • Case book • National
• Academia workshop
and NSI
meeting
For further information refer to the Stakeholder Engagement Strategy in the STI 4 SHS Draft Status Quo Report.You can also read