Provisional Regional PBR values for Scottish seals in 2021
←
→
Page content transcription
If your browser does not render page correctly, please read the page content below
SCOS –BP 20/07                                 Not to be cited without prior permission from the authors

           Provisional Regional PBR values for Scottish seals in 2021

Chris Morris, Dave Thompson and Callan Duck
Sea Mammal Research Unit, Scottish Oceans Institute, University of St Andrews, St Andrews, KY 16 8LB

Abstract
This document estimates PBR values for the grey and harbour seal “populations” that haul out in
each of the seven Seal Management Areas in Scotland. Sets of possible values are tabulated for each
area using the equation in Wade (1998) with different values of that equation’s recovery factor. A
value is suggested for this parameter in each population, the resulting PBR is highlighted, and a
rationale is provided for each suggestion. The PBR values are calculated using the latest confirmed
counts in each management area.

Changes since last year:
• Recovery factors have been held constant for both species in all management regions.
• The latest harbour seal survey counts for the North coast and Orkney and for the Moray Firth
  management regions were similar to previous counts and there has been no change in the PBR
  estimates for those management units.
• The grey seal counts for the North coast and Orkney and the Shetland management regions were
  approximately 12% and 35% respectively lower than previous estimates. The Moray Firth count
  was 115% higher than the previous count. These changes result in pro-rata changes in PBRs for
  grey seals in those management regions.

Introduction
Potential Biological Removal is a widely used way of calculating whether current levels of
anthropogenic mortality are consistent with reaching or exceeding a specific target population,
chosen to be the Optimum Sustainable Population. It is explicitly given, in an amendment to the US
Marine Mammal Protection Act, as the method to be used for assessing anthropogenic impacts in
the waters around that country. The method has been supported by simulations demonstrating its
performance under certain assumptions (Wade 1998). The formulation of the equation allows for
small anthropogenic takes from any population, however much it is depleted or fast it is declining.
Scottish Government uses PBR to estimate permissible anthropogenic takes for each of the ten seal
management regions and uses this information to assess licence applications for seal control and for
other licensable marine activities.

Materials and Methods

The PBR calculation:

                   PBR = Nmin.(Rmax/2).FR
       where:
       PBR is a number of animals considered safely removable from the population.
       Nmin is a minimum population estimate (usually the 20th percentile of a distribution.
       Rmax is the population growth rate at low densities (by default set 0.12 for pinnipeds), this is
       halved to give an estimate of the growth rate at higher populations. This estimate should be
       conservative for most populations at their OSP.

                                                                                                           1
SCOS –BP 20/07 Not to be cited without prior permission from the authors
FR is a recovery factor, usually in the range 0.1 to 1. Low recovery factors give some protection
from stochastic effects and overestimation of the other parameters. They also increase the
expected equilibrium population size under the PBR.
The approach and calculation is discussed in detail in Wade (1998).
Data used in these calculations:
Nmin values used in these calculations are from the most recent summer surveys of each area, for
both species:
• Harbour seals: The surveys took place during the harbour seal moult, when the majority of
this species will be hauled out, so the counts are used directly as values for Nmin. (An
alternative approach, closer to that suggested by Wade (1998), would be to rescale these
counts into abundance estimates and take the 20th centile of the resulting distributions.
Results of a recent telemetry study in Orkney (Lonergan et al., 2012) suggest that would
increase the PBRs by between 8%, if the populations are predominantly female, and 37%, if
most of the animals are male.)
• Grey seals: Analysis of telemetry data from 107 grey seals tagged by SMRU between 1998
and 2016 shows that around 23.9% (95% CI: 19.2 - 28.6%) were hauled out during the survey
windows (Russell et al. 2016 SCOS-BP 16/03). The 20th centile of the distribution of
multipliers from counts to abundances implied by that data is 3.86. This represents a 50%
increase over the previous estimates due to a revised estimate of the proportion of time
seals spend hauled out and available to be counted during the aerial survey window. This
estimate is substantially lower than the estimate used in calculations prior to 2017 and has
narrower confidence intervals. In combination these factors have raised the Nmin value and
hence the PBR estimate for any given grey seal count.
Rmax is set at 0.12, the default value for pinnipeds, since very little information relevant to this
parameter is available for Scottish seals. A lower value could be argued for, on the basis that the
fastest recorded growth rate for the East Anglian harbour seal population has been below 10%
(Lonergan et al. 2007), though that in the Wadden Sea has been consistently growing at slightly over
12% p.a. (Reijnders et al. 2010).
Regional pup production estimates for the UK grey seal population have also had maximum growth
rates in the range 5-10% p.a. (Lonergan et al. 2011b). However, the large grey seal population at
Sable Island in Canada has grown at nearly 13% p.a. for long periods(Bowen et al. 2003).
FR needs to be chosen from the range [0.1, 1]. Estimated PBR values for the entire range of FR values
are presented. A recommended FR value is indicated for each species in each region, together with a
justification for the recommended value.
Areas used in the calculations:
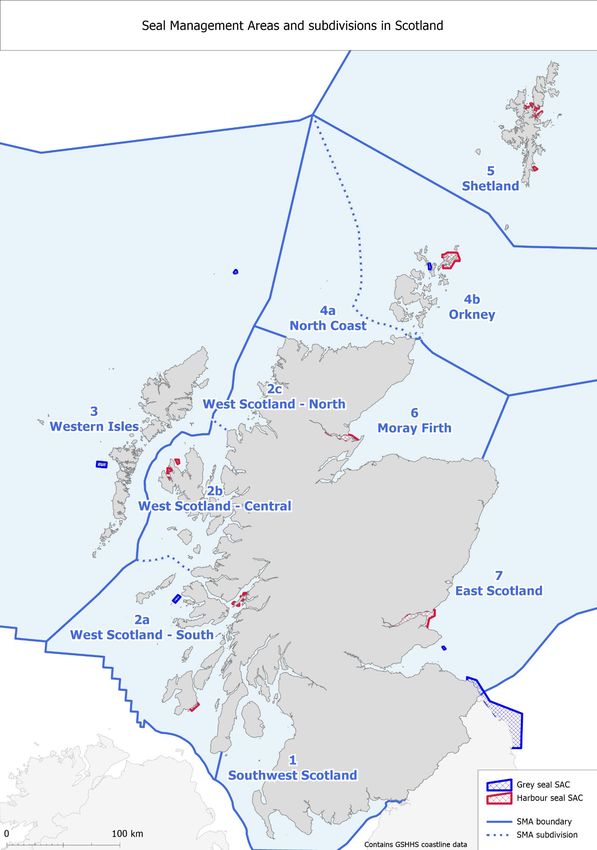
Figure 1 and Table 1 shows the boundaries of the Seal Management Areas.
Particularly for grey seals, there will probably be substantial movement of animals between these
areas. The division is a pragmatic compromise that attempts to balance current biological knowledge,
2SCOS –BP 20/07 Not to be cited without prior permission from the authors
distances between major haul-outs, environmental conditions, the spatial structure of existing data,
practical constraints on future data collection and management requirements
Rationale for the suggested recovery factors
The original PBR methodology leaves the setting of the recovery factor as a subjective choice for
managers. Factors such as the amount of information available about the population (and in
particular its maximum annual growth rate), recent trends in local abundance, and the connections
to neighbouring populations are relevant to setting this. The main factors affecting the value
suggested for each species in each area are given below:
Harbour seals
1) Shetland, Orkney + North Coast, and Eastern Scotland (FR= 0.1)
FR set to minimum because populations are experiencing prolonged declines and have not shown any
signs of recovery.
2) Western Isles (FR = 0.5)
Population was apparently undergoing a protracted but gradual decline during the 2000s, but the 2011
count was close to the pre-decline numbers and a trend analysis suggested no significant change since
1992. The population is only partly closed being close to the relatively much larger population in the
Western Scotland region, and the Rmax parameter is derived from other seal populations. The most
recent count for the Western Isles was 25% higher than the previous count. On that basis there may
be an argument for increasing the recovery factor to bring it in line with the other western Scottish
management areas. However, there is an existing conservation order in place for the management
unit and it is therefore recommended that the recovery factor is left at 0.5 and reviewed again when
a new count is available for the larger, adjacent West Scotland region.
3) West Scotland (FR = 1.0)
The population is largely closed, likely to have limited interchange with much smaller adjacent
populations. The most recent count was the highest ever recorded and the population is apparently
stable or increasing.
4) South West Scotland (FR = 0.7)
The population is apparently stable, is closed to the south and the adjacent population to the north is
apparently stable or increasing. The intrinsic population growth rate is taken from other similar
populations.
5) Moray Firth (FR= 0.1)
Counts for 2019 in the Moray Firth were similar to the previous 5 years, confirming the absence of
any overall trend over the past 15 years. The neighbouring Orkney and Tay populations are
continuing to undergo unexplained, rapid and catastrophic declines in abundance. Data available
from tracking studies suggest there is movement between these three areas. In the absence of a
sustained increase in the Moray Firth counts it is recommended that the FR should be left at its
previously recommended value of 0.1.
Grey seals
All regions (FR = 1.0)
There has been sustained growth in the numbers of pups born in all areas over the last 30 years. All
UK populations are either increasing or apparently stable at the maximum levels ever recorded and
therefore assumed to be at or close to their carrying capacities (Lonergan et al., 2011b; Thomas et
3SCOS –BP 20/07 Not to be cited without prior permission from the authors
al., 2019; Russell et al., 2019). Available telemetry data and the differences in the regional patterns
of pup production and summer haul-out counts (Lonergan et al. 2011a) also suggest substantial long-
distance movements of individuals.
References
Bowen WD, McMillan J, Mohn R (2003) Sustained exponential population growth of grey seals at
Sable Island, Nova Scotia. ICES Journal of Marine Science 60: 1265-1274
Lonergan M, Duck CD, Thompson D, Mackey BL, Cunningham L, Boyd IL (2007) Using sparse survey
data to investigate the declining abundance of British harbour seals. Journal of Zoology 271: 261-269
Lonergan M, Duck CD, Thompson D, Moss S, McConnell B (2011a) British grey seal (Halichoerus
grypus) abundance in 2008: an assessment based on aerial counts and satellite telemetry. ICES
Journal of Marine Science: Journal du Conseil 68: 2201-2209
Lonergan M, Thompson D, Thomas L, Duck C (2011b) An Approximate Bayesian Method Applied to
Estimating the Trajectories of Four British Grey Seal (Halichoerus grypus) Populations from Pup
Counts. Journal of Marine Biology 2011, 7p.
Lonergan M, Duck C, Moss S, Morris C, Thompson D (2012) Rescaling of aerial survey data with
information from small numbers of telemetry tags to estimate the size of a declining harbour seal
population. Aquatic Conservation: Marine and Freshwater Ecosystems 23:135-144
Reijnders, P.J.H., Brasseur, S.M.J.M., Tougaard, S., Siebert, U., Borchardt, T. and Stede, M. (2010).
Population development and status of harbour seals (Phoca vitulina) in the Wadden Sea. NAMMCO
Scientific Publications 8: 95-106
Russell, D.J.F., Duck, C.D., Morris, C.D. & Thompson, D. 2016 Independent estimates of grey seal
population size: 2008 and 2014. SCOS Briefing Paper 2016/03. Available at: http://www.smru.st-
andrews.ac.uk/files/2017/04/SCOS-2016.pdf.
Russell, D.J.F., Morris, C.D., Duck, C.D., Thompson, D., & Hiby, L. 2019. Monitoring long‐term changes
in UK grey seal pup production. Aquatic Conservation: Marine Freshwater Ecosystems, 29(S1): 24–39.
https://doi.org/10.1002/aqc.3100
Thomas, L., Russell, D.J.F., Duck, C.D., Morris, C.D., Lonergan, M., Empacher, F., Thompson, D., &
Harwood, J. 2019. Modelling the population size and dynamics of the British grey seal. Aquatic
Conservation: Marine Freshwater Ecosystems, 29(S1): 6–23. https://doi.org/10.1002/aqc.3134
Wade PR (1998) Calculating limits to the allowable human-caused mortality of cetaceans and
pinnipeds. Marine Mammal Science 14(1):1:37
4SCOS –BP 20/07 Not to be cited without prior permission from the authors
Table 1: Boundaries of the Seal Management Areas in Scotland.
Seal Management Area Area Covered
1 Southwest Scotland English border to Mull of Kintyre
2 West Scotland Mull of Kintyre to Cape Wrath
3 Western Isles Western Isles incl. Flannan Isles, North Rona
4 North Coast & Orkney North mainland coast & Orkney
5 Shetland Shetland incl. Foula & Fair Isle
6 Moray Firth Duncansby Head to Fraserburgh
7 East Scotland Fraserburgh to English border
.
5SCOS –BP 20/07 Not to be cited without prior permission from the authors
Results
PBR values for grey and harbour seals for each Seal Management Area for with the full range of FR values from 0.1 to 1.0 are given in table 1 for harbour
seals and table 2 for grey seals. In each table the value corresponding to the recommended FR is highlighted
Table 1. Potential Biological Removal (PBR) values for harbour seals in Scotland by Seal Management Unit for the year 2021. Recommended FR values are
highlighted in grey cells.
2016-2019 PBRs based on recovery factors FR ranging from 0.1 to 1.0 selected
Seal Management Area count Nmin 0.1 0.2 0.3 0.4 0.5 0.6 0.7 0.8 0.9 1.0 FR PBR
1 Southwest Scotland 1709 1709 10 20 30 41 51 61 71 82 92 102 0.7 71
2 West Scotland 15600 15600 93 187 280 374 468 561 655 748 842 936 1.0 936
3 Western Isles 3532 3532 21 42 63 84 105 127 148 169 190 211 0.5 105
4 North Coast & Orkney 1405 1405 8 16 25 33 42 50 59 67 75 84 0.1 8
5 Shetland 3180 3180 19 38 57 76 95 114 133 152 171 190 0.1 19
6 Moray Firth 1077 1077 6 12 19 25 32 38 45 51 58 64 0.1 6
7 East Scotland 343 343 2 4 6 8 10 12 14 16 18 20 0.1 2
SCOTLAND TOTAL 26846 26846 159 319 480 641 803 963 1125 1285 1446 1607 1147
6SCOS –BP 20/07 Not to be cited without prior permission from the authors
Table 2. Potential Biological Removal (PBR) values for grey seals in Scotland by Seal Management Unit for the year 2021. Recommended FR values are
highlighted in grey cells.
2016-2019 PBRs based on recovery factors FR ranging from 0.1 to 1.0 selected
Seal Management Area count Nmin 0.1 0.2 0.3 0.4 0.5 0.6 0.7 0.8 0.9 1.0 FR PBR
1 Southwest Scotland 517 1995 11 23 35 47 59 71 83 95 107 119 1.0 119
2 West Scotland 4174 16111 96 193 289 386 483 579 676 773 869 966 1.0 966
3 Western Isles 5773 22283 133 267 401 534 668 802 935 1069 1203 1336 1.0 1336
4 North Coast & Orkney 8599 33192 199 398 597 796 995 1194 1394 1593 1792 1991 1.0 1991
5 Shetland 1009 3894 23 46 70 93 116 140 163 186 210 233 1.0 233
6 Moray Firth 1657 6396 38 76 115 153 191 230 268 307 345 383 1.0 383
7 East Scotland 3683 14216 85 170 255 341 426 511 597 682 767 852 1.0 852
SCOTLAND TOTAL 25412 98087 585 1173 1762 2350 2938 3527 4116 4705 5293 5880 5880
7SCOS –BP 20/07 Not to be cited without prior permission from the authors
Figure 1. .Seal management areas in Scotland. For purposes of PBR calculations West Scotland is
8You can also read