Psychological Language on Twitter Predicts County-Level Heart Disease Mortality
←
→
Page content transcription
If your browser does not render page correctly, please read the page content below
557867
research-article2014
PSSXXX10.1177/0956797614557867Eichstaedt et al.Twitter and Heart Disease Mortality
Psychological Science OnlineFirst, published on January 20, 2015 as doi:10.1177/0956797614557867
Research Article
Psychological Science
Psychological Language on Twitter 1–11
© The Author(s) 2015
Reprints and permissions:
Predicts County-Level Heart Disease sagepub.com/journalsPermissions.nav
DOI: 10.1177/0956797614557867
Mortality pss.sagepub.com
Johannes C. Eichstaedt1, Hansen Andrew Schwartz1,2,
Margaret L. Kern1,3, Gregory Park1, Darwin R. Labarthe4,
Raina M. Merchant5, Sneha Jha2, Megha Agrawal2,
Lukasz A. Dziurzynski1, Maarten Sap1, Christopher Weeg1,
Emily E. Larson1, Lyle H. Ungar1,2, and Martin E. P. Seligman1
1
Department of Psychology, University of Pennsylvania; 2Department of Computer and Information
Science, University of Pennsylvania; 3Graduate School of Education, University of Melbourne; 4School of
Medicine, Northwestern University; and 5Department of Emergency Medicine, University of Pennsylvania
Abstract
Hostility and chronic stress are known risk factors for heart disease, but they are costly to assess on a large scale. We
used language expressed on Twitter to characterize community-level psychological correlates of age-adjusted mortality
from atherosclerotic heart disease (AHD). Language patterns reflecting negative social relationships, disengagement,
and negative emotions—especially anger—emerged as risk factors; positive emotions and psychological engagement
emerged as protective factors. Most correlations remained significant after controlling for income and education. A
cross-sectional regression model based only on Twitter language predicted AHD mortality significantly better than did
a model that combined 10 common demographic, socioeconomic, and health risk factors, including smoking, diabetes,
hypertension, and obesity. Capturing community psychological characteristics through social media is feasible, and
these characteristics are strong markers of cardiovascular mortality at the community level.
Keywords
heart disease, risk factors, well-being, language, big data, emotions, social media, open data, open materials
Received 3/30/14; Revision accepted 10/10/14
Heart disease is the leading cause of death worldwide In its 2020 Strategic Impact Goal Statement, the
(World Health Organization, 2011). Identifying and American Heart Association suggested that to further
addressing key risk factors, such as smoking, hyperten- reduce the risk for heart disease, “population-level strate-
sion, obesity, and physical inactivity, have significantly gies are essential to shift the entire distribution of risk”
reduced this risk (Ford & Capewell, 2011). Psychological (Lloyd-Jones et al., 2010, p. 589). Like individuals, commu-
characteristics, such as depression (Lett et al., 2004) and nities have characteristics, such as norms, social connect-
chronic stress (Menezes, Lavie, Milani, O’Keefe, & Lavie, edness, perceived safety, and environmental stress, that
2011), have similarly been shown to increase risk through
physiological effects (e.g., chronic sympathetic arousal) Corresponding Authors:
and deleterious health behaviors (e.g., drinking and Johannes C. Eichstaedt, Department of Psychology, University of
smoking). Conversely, positive psychological characteris- Pennsylvania, 3701 Market St., Ste. 220, Philadelphia, PA 19104
tics, such as optimism (Boehm & Kubzansky, 2012) and E-mail: johannes.penn@gmail.com, jeich@sas.upenn.edu
social support (Tay, Tan, Diener, & Gonzalez, 2013), Hansen Andrew Schwartz, Department of Psychology, University of
seem to decrease risk, most likely through similar Pennsylvania, 3701 Market St., Ste. 219, Philadelphia, PA 19104
pathways. E-mail: andy.schwartz@gmail.com
Downloaded from pss.sagepub.com at Univerzita J. E. Purkyne Usti nad Labem on January 20, 20152 Eichstaedt et al.
contribute to health and disease (Cohen, Farley, & Mason, language variables (e.g., the relative frequencies with
2003). One challenge to addressing community-level psy- which people expressed anger or engagement) for each
chological characteristics is the difficulty of assessment; county. We correlated these county-level language mea-
traditional approaches that use phone surveys and house- sures with county-level age-adjusted AHD mortality rates
hold visits are costly and have limited spatial and temporal obtained from the CDC. To gauge the amount of informa-
precision (Auchincloss, Gebreab, Mair, & Diez Roux, 2012; tion relevant to heart disease contained in the Twitter
Chaix, Merlo, Evans, Leal, & Havard, 2009). language, we compared the performance of prediction
Rich information about the psychological states and models that used Twitter language with the performance
behaviors of communities is now available in big social- of models that contained county-level (a) measures of
media data, offering a flexible and significantly cheaper socioeconomic status (SES; i.e., income and education),
alternative for assessing community-level psychological (b) demographics (percentages of Black, Hispanic, mar-
characteristics. Social-media-based digital epidemiology ried, and female residents), and (c) health variables (inci-
can support faster response and deeper understanding of dence of diabetes, obesity, smoking, and hypertension).
public-health threats than can traditional methods. For All procedures were approved by the University of
example, Google has used search queries to measure Pennsylvania Institutional Review Board.
trends in influenza, providing earlier indication of disease
spread than the Centers for Disease Control and
Prevention (CDC; Ginsberg et al., 2009). Other studies
Data sources
have used Twitter to track Lyme disease, H1N1 influenza, We used data from 1,347 U.S. counties for which AHD
depression, and other common ailments (Chew & mortality rates; county-level socioeconomic, demographic,
Eysenbach, 2010; De Choudhury, Counts, & Horvitz, and health variables; and at least 50,000 tweeted words
2013; de Quincey & Kostkova, 2009; Paul & Dredze, were available. More than 88% of the U.S. population lives
2011a, 2011b; Salathé, Freifeld, Mekaru, Tomasulo, & in the included counties (U.S. Census Bureau, 2010).1
Brownstein, 2013; Seifter, Schwarzwalder, Geis, & Aucott,
2010; St Louis & Zorlu, 2012). Twitter data. Tweets are brief messages (no more than
Methods for inferring psychological states through lan- 140 characters) containing information about emotions,
guage analysis have a rich history (Pennebaker, Mehl, & thoughts, behaviors, and other personally salient infor-
Niederhoffer, 2003; Stone, Dunphy, Smith, & Ogilvie, mation. In 2009 and 2010, Twitter made a 10% random
1966). Traditional approaches use dictionaries—prede- sample of tweets (the “Garden Hose”) available for
termined lists of words—associated with different con- researchers through direct access to its servers. We
structs (e.g., sad, glum, and crying are part of a obtained a sample of 826 million tweets collected
negative-emotion dictionary; Pennebaker, Chung, Ireland, between June 2009 and March 2010. Many Twitter users
Gonzales, & Booth, 2007). Open-vocabulary approaches self-reported their locations in their user profiles, and we
identify predictive words statistically and are not based used this information to map tweets to counties (for
on traditional predetermined dictionaries (Schwartz, details, see the Mapping Tweets to Counties section of
Eichstaedt, Kern, Dziurzynski, Ramones, et al., 2013), the Supplemental Method in the Supplemental Material
offering a complementary method of language analysis. available online). This resulted in 148 million county-
In this study, we analyzed social-media language to mapped tweets across 1,347 counties.
identify community-level psychological characteristics
associated with mortality from atherosclerotic heart dis- Heart disease data. Counties are the smallest socio-
ease (AHD). Working with a data set of 10s of millions of ecological level for which most CDC health variables and
Twitter messages (tweets), we used dictionary-based and U.S. Census information are available. From the Centers
open-vocabulary analyses to characterize the psychologi- for Disease Control and Prevention (2010b) we obtained
cal language correlates of AHD mortality. We also gauged county-level age-adjusted mortality rates for AHD, which
the amount of AHD-relevant information in Twitter lan- is represented by code I25.1 in the International Classifi-
guage by building and evaluating predictive models of cation of Disease, 10th edition (ICD 10; World Health
AHD mortality, and we compared the language models Organization, 1992). This code has the highest overall
with traditional models that used demographic and mortality rate in the United States (prevalence = 51.5
socioeconomic risk factors. deaths per 100,000 in 2010). We averaged AHD mortality
rates across 2009 and 2010 to match the time period of
the Twitter-language data set.
Method
We collected tweets from across the United States, deter- Demographic and health risk factors. We obtained
mined their counties of origin, and derived values for county-level median income and the percentage of
Downloaded from pss.sagepub.com at Univerzita J. E. Purkyne Usti nad Labem on January 20, 2015Twitter and Heart Disease Mortality 3
married residents from the American Community Survey brought in to break ties. Judges rated the dictionaries to
(U.S. Census Bureau, 2009). We also obtained high have accuracy levels between 55% and 89% (see Table S2
school and college graduation rates from this survey, in the Supplemental Tables).2
which we used to create an index of educational attain-
ment. We obtained percentages of female, Black, and Statistical analysis. Dictionary and topic language
Hispanic residents from the U.S. Census Bureau (2010). variables were correlated with county AHD mortality
From the Behavioral Risk Factor Surveillance System of rates using ordinary least squares linear regression. Each
the Centers for Disease Control and Prevention (2009, language variable was entered individually into the
2010a) we obtained prevalence of self-reported diabetes, regression equation and then entered simultaneously
obesity, smoking, and hypertension (common cardiovas- with education and income as controls. We tested 2,000
cular risk factors) for which county-level estimates had topics, so we applied the Bonferroni correction to the
previously been derived (see Table S1 in the Supple- significance threshold (i.e., for the correlation of 1 of
mental Tables of the Supplemental Material for detailed 2,000 topics to be significant, its p value would have to be
source information). less than .05/2,000, or .000025).
Predictive models. A predictive model of county AHD
Analytic procedure mortality rates was created using all of the Twitter lan-
Language variables from Twitter. We used an auto- guage variables. That is, we created a single model in
matic process to extract the relative frequency of words which all of the word, phrase, dictionary, and topic fre-
and phrases (sequences of two to three words) for every quencies were independent variables and the AHD mor-
county. For example, the relative frequency of the word tality rate was the dependent variable. We used regularized
hate ranged from 0.009% to 0.139% across counties (see linear regression (ridge regression) to fit the model (see
the Tokenization section of the Supplemental Method). the Predictive Models section of the Supplemental
We then derived two more types of language-use vari- Method). We also created predictive models of county
ables from counties’ relative word-usage frequencies: AHD mortality rates in which the predictors were differ-
variables based on (a) dictionaries and (b) topics. ent combinations of sets of variables: Twitter language,
Dictionary-based variables were relative frequencies of county demographics (percentages of Black, Hispanic,
psychologically related words from predetermined dic- married, and female residents), and socioeconomic
tionaries (e.g., positive-emotion words accounted for (income, education) and health (incidence of diabetes,
4.6% of all words in a county on average). Topic-based obesity, smoking, and hypertension) variables.
variables were the relative usage of 2,000 automatically We avoided distorted results (due to model overfit-
created topics, which are clusters of semantically related ting—picking up patterns simply by chance) by using a
words that can be thought of as latent factors (words can 10-fold cross-validation process that compared model
have loadings on multiple topics; see the Topic Extraction predictions with out-of-sample data. For this analysis, the
section of the Supplemental Method). counties were first randomly partitioned into 10 parts
We used preestablished dictionaries for anger, anxiety, (folds). Then, a predictive model was created by fitting the
positive and negative emotions, positive and negative independent variables to the dependent variable (AHD
social relationships, and engagement and disengagement mortality) over 9 of the 10 folds of counties (the training
(Pennebaker et al., 2007; Schwartz, Eichstaedt, Kern, set). We then evaluated how well the resulting model pre-
Dziurzynski, Lucas, et al., 2013). Topics had previously dicted the outcomes for the remaining fold (one 10th of
been automatically derived (Schwartz, Eichstaedt, Kern, the counties; the hold-out set). We evaluated the model by
Dziurzynski, Ramones, et al., 2013). comparing its predicted rates with the actual CDC-
Because words can have multiple senses, act as mul- reported mortality rates using a Pearson product-moment
tiple parts of speech, and be used in the context of irony correlation. This procedure was repeated 10 times, allow-
or negation, it is important to gauge empirically how well ing each fold to be the hold-out set. The results were
such lists of words measure what is intended (Grimmer & averaged together to determine overall prediction perfor-
Stewart, 2013). To that end, we had human raters evalu- mance across all counties for a given model.
ate the dictionaries to determine whether each accurately To compare predictive performance between two
measured the psychological concept intended. For each models (e.g., a model based only on Twitter language
of the eight dictionaries, two independent raters exam- versus a model based on income and education), we
ined 200 tweets containing dictionary words and rated conducted paired t tests comparing the sizes of the stan-
whether each dictionary word in the tweets expressed dardized residuals of county-level predictions from the
the associated dictionary concept. A third rater was models.
Downloaded from pss.sagepub.com at Univerzita J. E. Purkyne Usti nad Labem on January 20, 20154 Eichstaedt et al.
Table 1. County-Level Correlations Between Atherosclerotic each county, we calculated the relative use of each topic,
Heart Disease (AHD) Mortality and Twitter Language and we correlated topic use with AHD. Figure 1 shows
Measured by Dictionaries topic composition and correlations for 18 topics whose
Language variable Correlation with AHD mortality use was significantly correlated with AHD mortality.4 The
risk factors we observed were themes of hostility and
Risk factors aggression (shit, asshole, fucking; rs = .18, 95% CI = [.12,
Anger .17 [.11, .22]** .23], to .27, 95% CI = [.22, .32]), hate and interpersonal ten-
Negative relationships .16 [.11, .21]** sion (jealous, drama, hate; rs = .16, 95% CI = [.11, .21], to
Negative emotions .10 [.05, .16]**
.21, 95% CI = [.16, .26]), and boredom and fatigue (bored,
Disengagement .14 [.08, .19]**
tired, bed; rs = .18, 95% CI = [.12, .23], to .20, 95% CI = [.15,
Anxiety .05 [.00, .11]†
.25]). After controlling for SES, use of seven of the nine risk
Protective factors
topics remained significantly correlated with AHD mortal-
Positive relationshipsa .02 [−.04, .07]
Positive emotions −.11 [−.17, −.06]**
ity at Bonferroni-corrected levels (partial rs = .12, 95% CI =
Engagement −.16 [−.21, −.10]** [.07, .17], to .25, 95% CI = [.20, .30], p < 7 × 10⁻⁶).
Other topics were protective factors (Fig. 1, bottom
Note: The table presents Pearson rs, with 95% confidence intervals panel). Use of topics related to positive experiences
in square brackets (n = 1,347 counties). The anger and anxiety (wonderful, friends, great; rs = −.14, 95% CI = [−.19, −.08],
dictionaries come from the Linguistic Inquiry and Word Count
software (Pennebaker, Chung, Ireland, Gonzales, & Booth, 2007); to −.15, 95% CI = [−.21, −.10]) was associated with lower
the other dictionaries are our own (Schwartz, Eichstaedt, Kern, AHD mortality, a finding that mirrors the dictionary-based
Dziurzynski, Lucas, et al., 2013). Positive correlations indicate that results. Also associated with lower AHD mortality was
higher values for the language variables are associated with greater
use of topics reflecting skilled occupations (service, skills,
AHD mortality.
a
This is the correlation without love included in the dictionary. conference; rs = −.14, 95% CI = [−.20, −.09], to −.17, 95%
See note 3 at the end of the article and the discussion for more CI = [−.22, −.12]) and topics reflecting optimism (oppor-
information. tunities, goals, overcome; rs = −.12, 95% CI = [−.18, −.07],
†
p < .10. **p < .001.
to −.13, 95% CI = [−.18, −.07]), which has been found to
be robustly associated with reduced cardiovascular dis-
ease risk at the individual level (Boehm & Kubzansky,
Results 2012; Chida & Steptoe, 2008). After controlling for SES,
the correlations between protective topics and AHD mor-
Dictionaries
tality remained significant at the traditional .05 level but
Greater usage of anger, negative-relationship, negative- were no longer significant at Bonferroni-corrected
emotion, and disengagement words was significantly cor- levels.
related with greater age-adjusted AHD mortality (rs =
.10–.17; for specific results, including confidence inter-
vals, see Table 1). After controlling for SES (income and
Prediction
education), all five negative language factors (including In Figure 2, we compare the predictions of AHD mortal-
usage of anxiety words) were significant risk factors for ity from regression models with different independent
AHD mortality (partial rs = .06, 95% confidence interval, variables. Predictive performance was slightly but signifi-
or CI = [.00, .11], to .12, 95% CI = [.07, .17]). This suggests cantly better for a model combining Twitter and the 10
that Twitter language captures information not accounted traditional demographic, SES, and health predictors than
for by SES. Greater use of positive-emotion and engage- for a model that included only the 10 traditional predic-
ment words was associated with lower AHD mortality (r = tors (Twitter plus 10 traditional factors: r = .42, 95% CI =
−.11 and r = −.16, respectively). Use of engagement words [.38, .46]; 10 traditional factors only: r = .36, 95% CI = [.29,
remained significantly protective after controlling for SES .43]), t(1346) = −2.22, p = .026. This suggests that Twitter
(partial r = −.09, 95% CI = [−.14, −.04]), but use of positive- has incremental predictive validity over and above tradi-
emotion words became only marginally significant (partial tional risk factors. A predictive model using only Twitter
r = −.05, 95% CI = [−.00, −.11]). Usage of positive-relation- language (r = .42, 95% CI = [.38, .45]) performed slightly
ships words3 showed a nonsignificant association with better than a model using the 10 traditional factors,
AHD mortality (r = .02, 95% CI = [−.04, .07]; see Table 1). t(1346) = −1.97, p = .049.
To explore these associations in greater detail, we
compared the performance of prediction models contain-
Topics
ing stepwise combinations of Twitter and sets of demo-
We complemented the dictionaries with an open- graphic predictors (percentages of Black, Hispanic,
vocabulary approach, using automatically created topics married, and female residents), socioeconomic predictors
consisting of semantically coherent groups of words. For (income and education), and health predictors (incidence
Downloaded from pss.sagepub.com at Univerzita J. E. Purkyne Usti nad Labem on January 20, 2015Twitter and Heart Disease Mortality 5
Fig. 1. Twitter topics most correlated with age-adjusted mortality from atherosclerotic heart disease (AHD; signifi-
cant at a Bonferroni-corrected significance level of p < 2.5 × 10⁻⁵). The topics with positive correlations (top) and the
topics with negative correlations (bottom) have each been grouped into sets, which are labeled at the left. The size
of the word represents its prevalence relative to all words within a given topic (larger = more frequent; for details,
see the Supplemental Method).
Downloaded from pss.sagepub.com at Univerzita J. E. Purkyne Usti nad Labem on January 20, 20156 Eichstaedt et al.
Twitter and All Predictors
Only Twitter *
All Predictors Except Twitter
Income and Education
Smoking
Diabetes
Hypertension
Obesity
Black (%)
Female (%)
Married (%)
Hispanic (%)
.00 .05 .10 .15 .20 .25 .30 .35 .40 .45
Pearson r
Fig. 2. Performance of models predicting age-adjusted mortality from atherosclerotic heart disease (AHD). For each model, the graph
shows the correlation between predicted mortality and actual mortality reported by the Centers for Disease Control and Prevention. Predic-
tions were based on Twitter language, socioeconomic status, health, and demographic variables singly and in combination. Higher values
mean better prediction. The correlation values are averages obtained in a cross-validation process used to avoid distortion of accuracy due
to chance (overfitting; for details, see the text). Error bars show 95% confidence intervals. Asterisks indicate significant differences between
models (*p < .05).
of diabetes, obesity, smoking, and hypertension; see language was protective. Third, our predictive results sug-
Table S4 in the Supplemental Tables). For all combina- gest that the information contained in Twitter language
tions of sets of traditional predictors, adding Twitter fully accounts for—and adds to—the AHD-relevant infor-
language significantly improved predictive performance, mation in 10 representatively assessed demographic,
t(1346) > 3.00, p < .001. Adding traditional sets of predic- socioeconomic, and health variables. Taken together, our
tors to Twitter language did not significantly improve results suggest that language on Twitter can provide plau-
predictive performance. sible indicators of community-level psychosocial health
Taken together, these results suggest that the AHD- that may complement other methods of studying the
relevant variance in the 10 predictors overlaps with the impact of place on health used in epidemiology (cf.
AHD-relevant variance in the Twitter language features. Auchincloss et al., 2012) and that these indicators are
Twitter language may therefore be a marker for these vari- associated with risk for cardiovascular mortality.
ables and in addition may have incremental predictive Our findings point to a community-level psychological
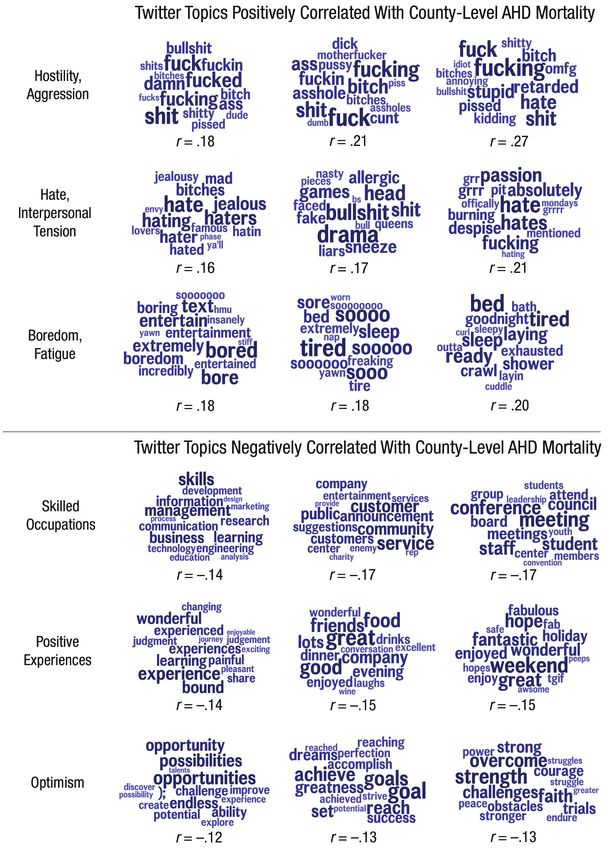
validity. Figure 3 shows CDC-reported AHD mortality aver- risk profile similar to risk profiles that have been observed
aged across 2009 and 2010 and Twitter-predicted mortality at the individual level. County-level associations between
for the densely populated counties in the northeastern AHD mortality and use of negative-emotion words (rela-
United States; a high degree of agreement is evident. tive risk,5 or RR, = 1.22), anger words (RR = 1.41), and
anxiety words (RR = 1.11) were comparable to individ-
ual-level meta-analytic effect sizes for the association
Discussion between AHD mortality and depressed mood (RR = 1.49;
Our study had three major findings. First, language Rugulies, 2002), anger (RR = 1.22; Chida & Steptoe, 2009),
expressed on Twitter revealed several community-level and anxiety (RR = 1.48; Roest, Martens, de Jonge, &
psychological characteristics that were significantly asso- Denollet, 2010).
ciated with heart-disease mortality risk. Second, use of Although less is known at the individual level about the
negative-emotion (especially anger), disengagement, and protective effects of positive psychological variables than
negative-relationship language was associated with about the risk associated with negative variables, our find-
increased risk, whereas positive-emotion and engagement ings align with a growing body of research supporting the
Downloaded from pss.sagepub.com at Univerzita J. E. Purkyne Usti nad Labem on January 20, 2015Twitter and Heart Disease Mortality 7
CDC-Reported AHD Mortality Twitter-Predicted AHD Mortality
10 20 30 40 50 60 70 80 90
AHD Mortality (Percentile)
Fig. 3. Map of counties in the northeastern United States showing age-adjusted mortality from atherosclerotic
heart disease (AHD) as reported by the Centers for Disease Control and Prevention (CDC; left) and as estimated
through the Twitter-language-only prediction model (right). The out-of-sample predictions shown were obtained
from the cross-validation process described in the text. Counties for which reliable CDC or Twitter language data
were unavailable are shown in white.
cardiovascular health benefits of psychological well- characteristics (e.g., anger or stress) associated with an
being (Boehm & Kubzansky, in press). Engagement, increased risk for AHD mortality. Data-driven analyses,
which has long been considered an important compo- such as our topic analyses, may help identify novel psy-
nent of successful aging (Rowe & Kahn, 1987), emerged chological, social, and behavioral correlates of disease.
as the strongest protective factor in our study. Use of When analyses use theory-based dictionaries, results
positive-emotion words was also protective, which is in can be driven by a few frequent but ambiguous words.
line with numerous findings that positive emotions con- For example, greater use of words in the original posi-
vey protection from illness and disease (e.g., Howell, tive-relationships dictionary (Schwartz, Eichstaedt, Kern,
Kern, & Lyubomirsky, 2007; Pressman & Cohen, 2005). Dziurzynski, Ramones, et al., 2013) was surprisingly asso-
Fredrickson, Mancuso, Branigan, and Tugade (2000) have ciated with increased risk, as was the use of its most fre-
argued that positive emotions may undo the negative car- quent word, love. Love accounted for more than a third of
diovascular aftereffects of anxiety-induced cardiovascular the total usage of the positive-relationships dictionary
reactivity. Optimism has been shown to have relatively (5.3 million occurrences of love compared with 15.0 mil-
robust association with reduced risk of cardiovascular lion occurrences of all words in the dictionary), which
events at the individual level (Boehm & Kubzansky, 2012; means that love drove the results for this dictionary.
Chida & Steptoe, 2008). We did not have a predefined Reading through a random sample of tweets containing
optimism dictionary, but our topic analyses seem to have love revealed them to be mostly statements about loving
identified this as a protective factor (as indicated by things, not people.6 Excluding love from the dictionary
results for topics containing opportunities, goals, over- reduced the correlation between use of the words in the
come; Fig. 1, bottom). This demonstrates the value of positive-relationships dictionary and AHD mortality (r =
data-driven language analyses. .08, 95% CI = [.03, .13]) to nonsignificance (r = .02, 95%
Overall, our topic findings were similar to and converged CI = [−.04, .07]).
with our theory-based dictionary results (cross-correlations These results demonstrate the pitfalls of interpreting
are given in Table S3 in the Supplemental Tables). Although dictionary-based results at face value and underscore the
theory-based analyses can be more easily tied to existing importance of interpreting such results in light of the
literature, topic analyses provide a richer portrait of spe- most frequent words contained in the dictionaries, which
cific behaviors and attitudes (e.g., cursing, frustration, can drive the overall dictionary results in unexpected
being tired) that correspond to broad psychological ways. For transparency, in Table S6 in the Supplemental
Downloaded from pss.sagepub.com at Univerzita J. E. Purkyne Usti nad Labem on January 20, 20158 Eichstaedt et al.
Tables, we have provided the correlations with AHD CDC, which draws on the underlying cause of death
mortality for the 10 most frequently used words in each recorded on death certificates; however, the coding on
of the eight dictionaries. These findings also highlight the death certificates may be inconsistent (Pierce & Denison,
value of triangulating language analyses across different 2010). Finally, associations between language and mor-
levels of analysis (words, topics, and dictionaries) for tality do not point to causality; analyses of language on
arriving at more robust interpretations. social media may complement other epidemiological
Given that the typical Twitter user is younger (median methods, but the limits of causal inferences from obser-
age = 31 years; Fox, Zickurh, & Smith, 2009) than the typi- vational studies have been repeatedly noted (e.g., Diez
cal person at risk for AHD, it is not obvious why Twitter Roux & Mair, 2010).
language should track heart-disease mortality. The people Traditional approaches for collecting psychosocial data
tweeting are not the people dying. However, the tweets from large representative samples, such as the Behavioral
of younger adults may disclose characteristics of their Risk Factor Surveillance System of the CDC and Gallup
community, reflecting a shared economic, physical, and polls, tend to be expensive, are based on only thousands
psychological environment. At the individual level, psy- of people, and are often limited to a minimal, predefined
chological variables and heart-disease risk are connected list of psychological constructs. A Twitter-based system to
through multiple pathways, including health behaviors, track psychosocial variables is relatively inexpensive and
social relationships, situation selection, and physiological can potentially generate estimates based on 10s of mil-
reactivity (Friedman & Kern, 2014). These pathways occur lions of people with much higher resolution in time and
within a broader social context that directly and indirectly space. It is comparatively easy to create dictionaries auto-
influences an individual’s life experiences. Local commu- matically for different psychological or social constructs
nities create physical and social environments that influ- so that novel hypotheses can be tested. Our approach
ence the behaviors, stress experiences, and health of their opens the door to a new generation of psychological
residents (Diez Roux & Mair, 2010; Lochner, Kawachi, informational epidemiology (Eysenbach, 2009; Labarthe,
Brennan, & Buka, 2003). Epidemiological studies have 2010) and could bring researchers closer to understanding
found that the aggregated characteristics of communities, the community-level psychological factors that are impor-
such as social cohesion and social capital, account for a tant for the cardiovascular health of communities and
significant portion of variation in health outcomes, inde- should become the focus of intervention.
pendently of individual-level characteristics (Leyland,
2005; Riva, Gauvin, & Barnett, 2007), such that the com- Author Contributions
bined psychological character of the community is more J. C. Eichstaedt led the project. J. C. Eichstaedt and H. A. Schwartz
informative for predicting risk than are the self-reports of conceived of the study. H. A. Schwartz, J. C. Eichstaedt, G. Park,
any one individual. The language of Twitter may be a S. Jha, M. Agrawal, L. A. Dziurzynski, and M. Sap handled data
window into the aggregated and powerful effects of the acquisition and processing, development of the prediction mod-
community context. els, and data analyses. J. C. Eichstaedt, M. L. Kern, H. A. Schwartz,
Our study has several limitations. Tweets constitute a and G. Park drafted the manuscript. D. R. Labarthe, R. M.
biased sample in two ways. First, they may reflect social- Merchant, L. H. Ungar, and M. E. P. Seligman provided critical
desirability biases, because people manage their online revisions. C. Weeg and E. E. Larson helped acquire, process, and
analyze county-level information. All authors approved the final
identities (Rost, Barkhuus, Cramer, & Brown, 2013).
version of the manuscript for submission. L. H. Ungar and
Second, Twitter users are not representative of the gen- M. E. P. Seligman contributed equally to this article.
eral population. The Twitter population tends to be more
urban and to have higher levels of education (Mislove,
Declaration of Conflicting Interests
Lehmann, Ahn, Onnela, & Rosenquist, 2011). In 2009, the
median age of Twitter users (Fox et al., 2009) was 5.8 The authors declared that they had no conflicts of interest with
years below the U.S. median age (U.S. Census Bureau, respect to their authorship or the publication of this article.
2010). Nonetheless, our Twitter-based prediction model
outperformed models based on classical risk factors in Funding
predicting AHD mortality; this suggests that, despite the This work was supported by the Robert Wood Johnson
biases, Twitter language captures as much unbiased Foundation’s Pioneer Portfolio, through Exploring Concepts of
AHD-relevant information about the general population Positive Health Grant 63597 (to M. E. P. Seligman), and by a
as do traditional, representatively assessed predictors. grant from the Templeton Religion Trust.
Another limitation is that our findings are cross-
sectional; future research should address the stability of Supplemental Material
psychological characteristics of counties across time. Additional supporting information can be found at http://pss
Also, we relied on AHD mortality rates reported by the .sagepub.com/content/by/supplemental-data
Downloaded from pss.sagepub.com at Univerzita J. E. Purkyne Usti nad Labem on January 20, 2015Twitter and Heart Disease Mortality 9
Open Practices about personal relationships on Twitter, which distorts the results
obtained when using the original positive-relationships dictionary.
All data and materials have been made publicly available via References
the Open Science Framework and can be accessed at https://
osf.io/rt6w2/. The complete Open Practices Disclosure for this Auchincloss, A. H., Gebreab, S. Y., Mair, C., & Diez Roux,
article can be found at http://pss.sagepub.com/content/by/ A. V. (2012). A review of spatial methods in epidemiology,
supplemental-data. This article has received badges for Open 2000–2010. Annual Review of Public Health, 33, 107–122.
Data and Open Materials. More information about the Open doi:10.1146/annurev-publhealth-031811-124655
Practices badges can be found at https://osf.io/tvyxz/wiki/ Boehm, J. K., & Kubzansky, L. D. (2012). The heart’s content:
view/ and http://pss.sagepub.com/content/25/1/3.full. The association between positive psychological well-being
and cardiovascular health. Psychological Bulletin, 138,
655–691. doi:10.1037/a0027448
Notes
Boehm, J. K., & Kubzansky, L. D. (in press). Positive psycho-
1. Analyses using the available heart disease, demographic, logical well-being and cardiovascular disease. In W. Kop,
and socioeconomic information for the excluded counties L. Katzel, & S. Waldstein (Eds.), Cardiovascular behavioral
revealed that, compared with the counties in the final sample, medicine. New York, NY: Springer.
the excluded counties had smaller populations (median county Centers for Disease Control and Prevention. (2009). Behavioral
population of 12,932 in 1,796 excluded counties vs. 78,265 in Risk Factor Surveillance System annual survey data.
included counties), higher rates of AHD (Hedges’s g = 0.48, Retrieved from http://www.cdc.gov/brfss/annual_data/
95% confidence interval, or CI = [0.38, 0.57]; n = 597 excluded annual_2009.htm
counties with data available), lower income (g = −0.42, 95% Centers for Disease Control and Prevention. (2010a). Behavioral
CI = [−0.53, −0.32]; n = 496), and lower levels of education Risk Factor Surveillance System annual survey data.
(g = −0.61, 95% CI = [−.72, −.51]; n = 496). The included and Retrieved from http://www.cdc.gov/brfss/annual_data/
excluded counties did not differ in median age (g = 0.003, 95% annual_2010.htm
CI = [−0.08, 0.08]; n = 1,004). Centers for Disease Control and Prevention. (2010b). Underlying
2. The anxiety and positive-relationships dictionaries were rated cause of death 1999-2010. CDC WONDER online database
as having the lowest accuracies (55.0% and 55.5% respectively; [Data set]. Retrieved from http://wonder.cdc.gov/ucd-
see Table S2 in the Supplemental Tables), whereas the accu- icd10.html
racy of the other dictionaries was markedly higher (average Chaix, B., Merlo, J., Evans, D., Leal, C., & Havard, S. (2009).
accuracy = 82.1%). Cross-correlations of dictionaries (see Table Neighbourhoods in eco-epidemiologic research: Delimiting
S3 in the Supplemental Tables) revealed that the frequency of personal exposure areas. A response to Riva, Gauvin,
use of the positive-relationships and anxiety dictionaries were Apparicio and Brodeur. Social Science & Medicine, 69,
unexpectedly positively correlated with the frequencies of use 1306–1310. doi:10.1016/j.socscimed.2009.07.018
of all other dictionaries. Chew, C., & Eysenbach, G. (2010). Pandemics in the age of
3. The word love was removed from the dictionary because it Twitter: Content analysis of tweets during the 2009 H1N1
accounted for more than a third of the occurrences of words outbreak. PLoS ONE, 5(11), Article e14118. Retrieved from
from this dictionary, and including it distorted the results (see http://www.plosone.org/article/info:doi/10.1371/journal
Discussion, and note 6). .pone.0014118
4. For ease of interpretation, we have grouped these topics into Chida, Y., & Steptoe, A. (2008). Positive psychological well-
seemingly related sets and added labels to summarize our sense being and mortality: A quantitative review of prospective
of the topics. These labels are open to interpretation, and we observational studies. Psychosomatic Medicine, 70, 741–
present for inspection the most prevalent words within the top- 756. doi:10.1097/PSY.0b013e31818105ba
ics. County-level topic- and dictionary-frequency data can be Chida, Y., & Steptoe, A. (2009). The association of anger
downloaded from https://osf.io/rt6w2/files/. and hostility with future coronary heart disease: A meta-
5. To compare our findings with published effect sizes, we con- analytic view of prospective evidence. Journal of the
verted correlation coefficients to relative risk values following American College of Cardiology, 53, 936–946. doi:10.1016/j
the method of Rosenthal and DiMatteo (2001). .jacc.2008.11.044
6. In addition to having this word-sense ambiguity, mentions Cohen, D. A., Farley, T. A., & Mason, K. (2003). Why is pov-
of love may signify a different kind of Twitter use in lower-SES erty unhealthy? Social and physical mediators. Social
areas. A factor analysis of the words in the positive-relation- Science & Medicine, 57, 1631–1641. doi:10.1016/S0277-
ships dictionary revealed two factors with opposing correlations 9536(03)00015-7
with SES. A general social factor (friends, agree, loved) corre- De Choudhury, M., Counts, S., & Horvitz, E. (2013). Social
lated with higher SES (r = .14), and a partnership factor (rela- media as a measurement tool of depression in popula-
tionship, boyfriend, girlfriend) correlated with lower SES tions. In WebSci ’13: Proceedings of the 5th Annual
(r = −.43), as well as higher AHD mortality (r = .18). Usage of the ACM Web Science Conference (pp. 47–56). doi:10.1145/
word love loaded much higher on this second factor than on the 2464464.2464480
first one (see Table S5 in the Supplemental Tables). This finding de Quincey, E., & Kostkova, P. (2009). Early warning and
may be an indication that in lower-SES areas, users share more outbreak detection using social networking websites:
Downloaded from pss.sagepub.com at Univerzita J. E. Purkyne Usti nad Labem on January 20, 201510 Eichstaedt et al.
The potential of Twitter. In P. Kostkova (Ed.), Electronic Lochner, K. A., Kawachi, I., Brennan, R. T., & Buka, S. L. (2003).
Healthcare: Second International ICST Conference, eHealth Social capital and neighborhood mortality rates in Chicago.
2009, Istanbul, Turkey, September 23–25, 2009 (pp. 21– Social Science & Medicine, 56, 1797–1805. doi:10.1016/
24). doi:10.1007/978-3-642-11745-9_4 S0277-9536(02)00177-6
Diez Roux, A. V., & Mair, C. (2010). Neighborhoods and health. Menezes, A. R., Lavie, C. J., Milani, R. V., O’Keefe, J., & Lavie,
Annals of the New York Academy of Sciences, 1186, 125– T. J. (2011). Psychological risk factors and cardiovascular
145. doi:10.1111/j.1749-6632.2009.05333.x disease: Is it all in your head? Postgraduate Medicine, 123,
Eysenbach, G. (2009). Infodemiology and infoveillance: 165–176. doi:10.3810/pgm.2011.09.2472
Framework for an emerging set of public health informat- Mislove, A., Lehmann, S., Ahn, Y.-Y., Onnela, J. P., & Rosenquist,
ics methods to analyze search, communication and publi- J. N. (2011). Understanding the demographics of Twitter
cation behavior on the Internet. Journal of Medical Internet users. In Proceedings of the 5th International AAAI
Research, 11(1), Article e11. Retrieved from http://www Conference on Weblogs and Social Media (pp. 554–557).
.jmir.org/2009/1/e11/. Retrieved from http://www.aaai.org/ocs/index.php/ICWSM/
Ford, E. S., & Capewell, S. (2011). Proportion of the decline ICWSM11/paper/view/2816/3234
in cardiovascular mortality disease due to prevention ver- Paul, M. J., & Dredze, M. (2011a). A model for mining public
sus treatments: Public health versus clinical care. Annual health topics from Twitter. Retrieved from the Johns Hopkins
Review of Public Health, 32, 5–22. doi:10.1146/annurev- University Web site: http://www.cs.jhu.edu/~mpaul/files/
publhealth-031210-101211 2011.tech.twitter_health.pdf
Fox, S., Zickurh, K., & Smith, A. (2009). Twitter and status Paul, M. J., & Dredze, M. (2011b). You are what you tweet:
updating, fall 2009. Retrieved from Pew Research Internet Analyzing Twitter for public health. In Proceedings
Project Web site: http://www.pewinternet.org/2009/10/21/ of the 5th International AAAI Conference on Weblogs
twitter-and-status-updating-fall-2009 and Social Media (pp. 265–272). Retrieved from http://
Fredrickson, B. L., Mancuso, R. A., Branigan, C., & Tugade, M. M. www.aaai.org/ocs/index.php/ICWSM/ICWSM11/paper/
(2000). The undoing effects of positive emotions. Motivation view/2880/3264
and Emotion, 24, 237–258. doi:10.1023/A:1010796329158 Pennebaker, J. W., Chung, C. K., Ireland, M., Gonzales, A.,
Friedman, H. S., & Kern, M. L. (2014). Personality, well-being, & Booth, R. J. (2007). The development and psychometric
and health. Annual Review of Psychology, 65, 719–742. properties of LIWC2007. Austin, TX: LIWC.net.
doi:10.1146/annurev-psych-010213-115123 Pennebaker, J. W., Mehl, M. R., & Niederhoffer, K. G. (2003).
Ginsberg, J., Mohebbi, M. H., Patel, R. S., Brammer, L., Psychological aspects of natural language use: Our words,
Smolinski, M. S., & Brilliant, L. (2009). Detecting influenza our selves. Annual Review of Psychology, 54, 547–577.
epidemics using search engine query data. Nature, 457, doi:10.1146/annurev.psych.54.101601.145041
1012–1014. doi:10.1038/nature07634 Pierce, J. R., & Denison, A. V. (2010). Accuracy of death certifi-
Grimmer, J., & Stewart, B. M. (2013). Text as data: The prom- cates and the implications for studying disease burdens. In
ise and pitfalls of automatic content analysis methods for V. R. Preedy & R. R. Watson (Eds.), Handbook of disease
political texts. Political Analysis, 21, 267–297. doi:10.1093/ burdens and quality of life measures (pp. 329–344). New
pan/mps028 York, NY: Springer.
Howell, R., Kern, M. L., & Lyubomirsky, S. (2007). Health bene- Pressman, S. D., & Cohen, S. (2005). Does positive affect
fits: Meta-analytically determining the impact of well-being influence health? Psychological Bulletin, 131, 925–971.
on objective health outcomes. Health Psychology Review, 1, doi:10.1037/0033-2909.131.6.925
83–136. doi:10.1080/17437190701492486 Riva, M., Gauvin, L., & Barnett, T. A. (2007). Toward the next
Labarthe, D. R. (2010). Epidemiology and prevention of cardio- generation of research into small area effects on health: A
vascular disease: A global challenge. Sudbury, MA: Jones synthesis of multilevel investigations published since July
& Bartlett. 1998. Journal of Epidemiology & Community Health, 61,
Lett, H. S., Blumenthal, J. A., Babyak, M. A., Sherwood, A., 853–861. doi:10.1136/jech.2006.050740
Strauman, T., Robins, C., & Newman, M. F. (2004). Depression Roest, A. M., Martens, E. J., de Jonge, P., & Denollet, J. (2010).
as a risk factor for coronary artery disease: Evidence, mech- Anxiety and risk of incident coronary heart disease: A meta-
anisms, and treatment. Psychosomatic Medicine, 66, 305– analysis. Journal of the American College of Cardiology, 56,
315. doi:10.1097/01.psy.0000126207.43307.c0 38–46. doi:10.1016/j.jacc.2010.03.034
Leyland, A. H. (2005). Socioeconomic gradients in the prevalence Rosenthal, R., & DiMatteo, M. R. (2001). Meta-analysis: Recent
of cardiovascular disease in Scotland: The roles of compo- developments in quantitative methods for literature reviews.
sition and context. Journal of Epidemiology & Community Annual Review of Psychology, 52, 59–82. doi:10.1146/
Health, 59, 799–803. doi:10.1136/jech.2005.034017 annurev.psych.52.1.59
Lloyd-Jones, D. M., Hong, Y., Labarthe, D., Mozaffarian, D., Rost, M., Barkhuus, L., Cramer, H., & Brown, B. (2013, February).
Appel, L. J., Van Horn, L., . . . Rosamond, W. D. (2010). Representation and communication: Challenges in interpret-
Defining and setting national goals for cardiovascular ing large social media datasets. Paper presented at the 16th
health promotion and disease reduction: The American ACM Conference on Computer Supported Cooperative Work
Heart Association’s strategic Impact Goal through 2020 and Social Computing (CSCW 2013), San Antonio, TX.
and beyond. Circulation, 121, 585–613. doi:10.1161/ Rowe, J. W., & Kahn, R. L. (1987). Human aging: Usual and suc-
CIRCULATIONAHA.109.192703 cessful. Science, 237, 143–149. doi:10.1126/science.3299702
Downloaded from pss.sagepub.com at Univerzita J. E. Purkyne Usti nad Labem on January 20, 2015Twitter and Heart Disease Mortality 11
Rugulies, R. (2002). Depression as a predictor for coronary Stone, P. J., Dunphy, D. C., Smith, M. S., & Ogilvie, D. M.
heart disease: A review and meta-analysis. American (1966). The general inquirer: A computer approach to con-
Journal of Preventive Medicine, 23, 51–61. doi:10.1016/ tent analysis. Cambridge, MA: MIT Press.
S0749-3797(02)00439-7 Tay, L., Tan, K., Diener, E., & Gonzalez, E. (2013). Social rela-
Salathé, M., Freifeld, C. C., Mekaru, S. R., Tomasulo, A. F., tions, health behaviors, and health outcomes: A survey and
& Brownstein, J. S. (2013). Influenza A (H7N9) and the synthesis. Applied Psychology: Health and Well-Being, 5,
importance of digital epidemiology. New England Journal 28–78.
of Medicine, 369, 401–404. doi:10.1056/NEJMp1307752 U.S. Census Bureau. (2009). Selected social characteristics in the
Schwartz, H. A., Eichstaedt, J. C., Kern, M. L., Dziurzynski, United States: 2009. American Community Survey 1-year
L., Lucas, R. E., Agrawal, M., . . . Ungar, L. H. (2013). estimates. Retrieved from http://factfinder2.census.gov/faces/
Characterizing geographic variation in well-being using tableservices/jsf/pages/productview.xhtml?pid=ACS_09_1YR_
tweets. In Proceedings of the 7th International AAAI DP2&prodType=table
Conference on Weblogs and Social Media (pp. 583–591). U.S. Census Bureau. (2010). Profile of general population
Retrieved from http://www.aaai.org/ocs/index.php/ICWSM/ and housing characteristics: 2010 demographic profile
ICWSM13/paper/view/6138/6398. data. Retrieved from http://factfinder2.census.gov/faces/
Schwartz, H. A., Eichstaedt, J. C., Kern, M. L., Dziurzynski, tableservices/jsf/pages/productview.xhtml?pid=DEC_10_
L., Ramones, S. M., Agrawal, M., . . . Ungar, L. H. (2013). DP_DPDP1&prodType=table
Personality, gender, and age in the language of social World Health Organization. (1992). Atherosclerotic heart dis-
media: The open-vocabulary approach. PLoS ONE, 8(9), ease. In International statistical classification of diseases
Article e73791. Retrieved from http://www.plosone.org/ and related health problems (10th ed.). Retrieved from
article/info:doi/10.1371/journal.pone.0073791 http://apps.who.int/classifications/icd10/browse/2010/
Seifter, A., Schwarzwalder, A., Geis, K., & Aucott, J. (2010). The en#/I25.1
utility of “Google Trends” for epidemiological research: World Health Organization. (2011). Global status report on
Lyme disease as an example. Geospatial Health, 4, 135–137. noncommunicable diseases 2010. Description of the global
St Louis, C., & Zorlu, G. (2012). Can Twitter predict disease out- burden of NCDs, their risk factors and determinants.
breaks? British Medical Journal, 344, Article e2353. Retrieved Retrieved from http://www.who.int/nmh/publications/
from http://www.bmj.com/content/344/bmj.e2353 ncd_report2010/en/
Downloaded from pss.sagepub.com at Univerzita J. E. Purkyne Usti nad Labem on January 20, 2015You can also read