Quality of Public Housing in Singapore: Spatial Properties of Dwellings and Domestic Lives
←
→
Page content transcription
If your browser does not render page correctly, please read the page content below
Article
Quality of Public Housing in Singapore: Spatial Properties of
Dwellings and Domestic Lives
Junko Tamura *,†              and Kent Fang

                                          Department of Architecture, School of Design and Environment, National University of Singapore,
                                          Singapore 117566, Singapore; kentfang7@gmail.com
                                          * Correspondence: junko@meiji.ac.jp; Tel.: +81-3-5343-8118
                                          † Current Affiliation: Organization for the Strategic Coordination of Research and Intellectual Properties,
                                            Meiji University, Tokyo 164-8525, Japan.

                                          Abstract: Singapore’s public housing policies are widely known for their success in providing
                                          housing for over 80% of the residential population, with most owning homes. Extensive housing
                                          schemes generally offer a set of fixed housing layouts; yet, at the microscale of an individual dwelling,
                                          alterations to the units can be made by rearranging the floor plans to reflect the usage patterns
                                          of the household, thus adding diversity to the fixed configuration. The aim of this paper is to
                                          identify associations among a housing unit’s spatial properties by analysing fixed configurations and
                                          altered floor plans as well as determining the spatial preferences of the inhabitants. The research
                                          methodology applied in this paper has been divided into two parts: spatial network analysis and
                                          survey analysis. In the spatial network analysis, the configurations of individual housing units
                                          and altered units were compared by translating floor plans into graphs. The survey functions as a
                                          qualitative analysis to relate the lifestyle patterns of contemporary society to housing configurations.

                                          Keywords: Singapore; public housing; HDB; design survey; network analysis


Citation: Tamura, J.; Fang, K. Quality
of Public Housing in Singapore:           1. Introduction
Spatial Properties of Dwellings and
                                               The provision of large-scale public housing represents a major aspect of the welfare
Domestic Lives. Architecture 2022, 2,
                                          system. Expansive housing development schemes have made an important contribution
18–30. https://doi.org/10.3390/
                                          towards increasing savings and homeownership rates as well as sustaining economic
architecture2010002
                                          growth through the development of the housing sector. However, when the Housing and
Academic Editor: Miguel Amado             Development Board (HDB) was established as the national housing authority in 1960, only
Received: 5 December 2021
                                          nine percent of the population enjoyed low-cost public housing [1]. Today, Singapore is
Accepted: 20 January 2022
                                          able to provide accommodations for over 80 percent of the residential population, with
Published: 25 January 2022
                                          more than 90 percent owning homes [2].
                                               Singapore’s housing policies have been labelled ‘phenomenally successful’ by other
Publisher’s Note: MDPI stays neutral
                                          countries [3] because of their ability to provide home ownership, which explains the con-
with regard to jurisdictional claims in
                                          siderable number of studies on Singapore’s public housing programme [4,5]. For example,
published maps and institutional affil-
                                          Sim, Lim, and Tay [1] present the key success factors in the strategy for full home ownership,
iations.
                                          and Chua [6] discusses the difficulties of maintaining property values when every family
                                          in the society has its own home. Furthermore, Sim, Yu, and Han [7] evaluate the success
                                          of the implemented public housing policy in dispersing ethnic enclaves and integrating
Copyright: © 2022 by the authors.
                                          the multi-ethnic population, which enables the social resilience needed by Singapore as
Licensee MDPI, Basel, Switzerland.        a multiracial nation. The literature indicates how the Singapore government has used
This article is an open access article    public housing as a policy instrument to manage and integrate the multi-ethnic population,
distributed under the terms and           whereas in the period before 1960, various ethnic groups were spatially segregated and
conditions of the Creative Commons        concentrated in certain parts of the island, thereby creating enclaves.
Attribution (CC BY) license (https://          Since achieving its main goal of providing shelter for Singapore’s increasing popu-
creativecommons.org/licenses/by/          lation, the HDB has become more concerned with the type and quality of the housing it
4.0/).                                    offers. As noted by Teo and Huang [8], this concern was in response to strong criticism that

Architecture 2022, 2, 18–30. https://doi.org/10.3390/architecture2010002                                    https://www.mdpi.com/journal/architecture
Architecture 2022, 2 19
HDB housing was uniform and monotonous; by the 1980s, Singapore came to be described
as ‘another modern metropolis’ [9], that is, international in style but homogeneous in space.
In other words, despite the success of Singapore’s housing policies that led to greater home
ownership and ethnic integration, the HDB’s efforts resulted in the mass production of
homogeneous space that lacked any sense of place [10].
Attempts to create that sense of place have been implemented at the precinct level.
Facilities such as courtyards, walkways, and pavilions are designed to enable interactions
among the residents of the area, thus creating opportunities for them to get to know one
another better. However, a study by Teo and Huang [8] of Pasir Ris, a neighbourhood in
Singapore, showed that this locale was successful in creating a distinct identity as a precinct,
although a strong sense of bonding and belonging had not been established. Another
attempt was made at the construction phase to differentiate the flats by adding variety in
the form of highly visible architectural designs. Previous designs have represented the
humble modernist style that was typical of the industrialized production of buildings, while
also contributing to the standardized appearance of public housing in Singapore [11]. As a
result, to aid in the identification of buildings, the facades of street blocks were decorated
with motifs, dormers, and colours to make each estate unique so that residents could have
a sense of identity [8].
The development of Singapore public housing over many decades has shifted from the
production of homogeneous space to heterogeneous space and from the creation of quantity
living to quality living. These developments have prompted interest in studying residents’
living experiences with a focus on the subject of liveability. Yuen, Yeh, Appold, Earl, Ting,
and Kurnianingrum Kwee [12] analysed the increasingly important question of liveability
by discussing the satisfaction and concerns of the occupants of high-rise HDB buildings;
Utsumi, Takai, and Suzuki [13] and Suzuki, Takai, and Utsumi [14] focused on common
spaces located at sky-deck level and argued the usability of shared space utilized as a
viewing gallery, whereas Teo and Kong [15] focused on quality improvements, namely, the
physical upgrading of older estates, made along four lines. The first line is the demolition of
old flats that can be used for redevelopment; second is the conversion of old one-room flats
into larger three- and four-room flats; third is the provision of additional facilities similar
to those found in the newer estates, such as a commercial complex as well as lifts and
balconies in buildings; and fourth is the liberalization of rules on alterations to individual
flats, which allows owners to make minor changes themselves. In this way, the HDB has
had a positive impact on Singapore’s public housing by using innovative, sustainable, and
effective management [15] that provides for quantity but also quality housing.
However, although studies have been performed on the qualitative aspects of public
housing in Singapore, the HDB’s focus on the design of housing floor plans, which deserves
documentation and analysis, has not yet received much attention. The extensive housing
schemes generally offer a set of fixed housing layouts, and five phases of building layout
improvements have been observed in the history of the HDB, as indicated in the annual
reports from 1960 to 2008. The five phases are summarized in Table 1, which shows that
over time, the public housing system was redesigned to cater to the changing needs of
its people. At the microscale of an individual dwelling, alterations made to the units in
accordance with one of the four upgrading schemes mentioned by Teo and Kong [15] were
carried out by rearranging the floor plans to meet the lifestyle of the household.
Focusing on individual dwellings, identifying the society of a specific location, culture,
and era represents an important factor that can be assessed using a bottom-up approach.
Thus, the modern-day spatial organization of dwellings can be used to illustrate the
current approach to living and vice versa. Therefore, this paper attempts to provide
another dimension of quality by focusing on the relationship between inhabitants and their
dwelling space, which can be accomplished by mapping the morphological changes in its
configuration. Within this framework, this paper evaluates the existing public housing
standards in Singapore using two approaches: spatial network analysis and qualitative
measures. Furthermore, this study explores possible methods of examining the relevanceArchitecture 2022, 2 20
of fixed configurations in Singapore’s public housing over various time periods, with
a focus on the microscale of an individual dwelling, which has the greatest impact on
residents’ daily lives. This study examines floor plan designs from different time periods
in chronological order and analyses spatial feedback from the survey to determine the
association between satisfaction levels and housing floor plans.
Table 1. Description of HDB Housing organised in five phases of building layout.
Phase Period Description
The basic design period. This period started in 1960 when the
Housing Development Board (HDB) of Singapore was established,
and it lasted until 1966. Since the HDB’s main objective was to
1 1960–1966 construct as much low-cost housing as possible within the shortest
time, the main consideration was to produce basic low-cost rental
housing units, which led to the one- or two-room ‘emergency’ types
and then standard one-room, two-room, and three-room flats.
The layout variation period. The standard one- and two-room and
‘emergency’ types of housing were replaced with standardized
prototype units, namely, improved one-room, two-room, and
2 1967–1976 three-room flats. In 1973, new prototypes of three-room, four-room,
and five-room flats were introduced in slab blocks known as new
generation flats (new gen). By 1977, a total of 20 different variations
were developed from the initial 5 prototype flats.
The period of holistic urban design through overall built form. In
this period, the precinct concept was introduced to create a
3 1977–1981 neighbourhood estate together with fixed flat types on the same
block, thereby mixing people from different socio-economic
backgrounds.
The intensification of land use period. This period represents the
fourth phase of the HDB’s planning and is focused on meeting
future housing demands caused by the increasing rate of
4 1982–1990
population growth. Model ‘A’ flats were initially introduced: three-,
four-, and five-room flats. In 1984, three- and four-room simplified
flats were introduced.
The period of diversification through privatisation. During this
period, various public housing schemes were introduced based on
different income brackets: Build-to-Order (BTO) flats, Design, Build
and Sell Scheme (DBSS), and Executive Condominiums (EC). In
short, the BTO is a system in which the project begins construction
only after the demand is met. Thus, this scheme helps to alleviate
5 1991–Present
the problem of excess unsold units. DBSS and EC are similar in
their development and sale by private developers, and their aim is
to enhance the diversity of housing designs. With respect to EC,
these units are targeted towards applicants who do not qualify for
the purchase of BTO flats (due to their higher income bracket) and
cannot afford private property, i.e., ‘sandwiched’ homebuyers.
2. Research Methods
The quality of living involves the characteristics of users and the developed physical
environment, while the quality of space can be evaluated based on residents’ satisfaction
with their housing environment [16]. Tibesigwa, Hao, and Karumuna [17] examine this
distinction through resident characteristics, space characteristics, and performance require-
ments. Employing this conceptual framework, the research methodology of this paper
is divided into two parts: a spatial approach using a network analysis and a qualitative
approach using survey data. Spatial network analysis applies the social logic of space [18]
and translates building layouts into graphs for comparison purposes according to social
position. Under the qualitative approach, case studies are conducted on flats from theArchitecture 2022, 2 21
different phases in the development of public housing to gather information on the basic
characteristics of the residents and their spatial satisfaction level.
2.1. Survey Approach
The survey approach applied in this research attempts to relate contemporary space
usage habits (considering both the original and altered plans) to how residents evaluate
their dwellings. The interviews were structured to capture two aspects of housing. The
first aspect involves the quantitative data collection of residents’ information by classifying
the household type in terms of the number of inhabitants, ownership, units with tenants
and any alterations to the home. The second aspect involves a more in-depth qualitative
approach to understanding how residents rate their satisfaction with their dwelling.
2.1.1. Survey Area
As a case study, this paper focuses on one neighbourhood in Singapore: Woodlands.
Woodlands is a mature neighbourhood in which villages were founded as early as the
1920s, when the Singapore Causeway that connects the country with Johor, Malaysia was
opened. The first HDB flats were constructed starting in 1972, although the development of
the area truly began in 1981. Due to its important position as an interchange with Malaysia,
Woodlands will continue to grow and represent the Northern Gateway to Singapore because
of the future cross-border rail link. In this neighbourhood, we find various housing types
of different phases from old to new in relatively close proximity of one another in an area
with a diameter of 1 km.
2.1.2. Survey Size
Housing units with seven different types of floor plans from various time periods
were selected to obtain information on the residents’ spatial usage pattern via alterations
and their satisfaction with their rooms based on different indicators. Shown in Table 2, the
flats were designated by housing type I to VII, and altered floor plans were indicated with
an apostrophe (e.g., Type I’ in Table 3) to differentiate them from the originals. A total of
210 flats and 30 occupants from each of the 7 types of floor plans were surveyed.
2.1.3. Survey Methods
The different types of households and their satisfaction with their dwelling space were
examined by considering the following pieces of information: (1) floor plan, which included
the design phase (classified in Table 1), flat size, and number of rooms; (2) occupants, which
included the household type, first owner, years of occupancy, number of occupants, and
any tenants; (3) alterations to the house; and (4) households’ evaluations of different
room attributes.
To facilitate the study of the varying types of households in different housing types,
five different household categories were used: single, couple, single with children, couple
with children, and multiple adult (tenants/grandparents). The multiple adult category
covers households of two or more adults who are not married, such as multiple tenants
sharing a housing unit, which is why a question about tenants is included. The multiple
adult category could also apply to a multi-generational family with grandparents or even
households with several adult relatives living together. The categories of single adult
with children and couple with children include situations where elderly parents live with
their children.
With respect to the evaluations of different room attributes, some of the quality
indicators for the unit and design details related to the size and space organization/layout,
as summarized by Tibesigwa, Hao, and Karumuna [17], were used. For this paper, quality
is evaluated through satisfaction and dissatisfaction with the space in three aspects: privacy,
location, and size. The survey for occupants includes more than two possible alternatives,
as well as not answering all the questions. Therefore, one can be satisfied with the privacy
while dissatisfied with the size. The different aspects were carefully explained to ensure aArchitecture 2022, 2 22
clear understanding of the options. The notion of privacy varies in relation to the bedroom,
living room, and kitchen and can be relative to neighbours and/or occupants of other
rooms. The location of rooms focuses on the positioning of a room in relation to another,
such as the location of the bedroom adjacent to the kitchen or the bathroom or too far from
the kitchen, which may lead to dissatisfaction. The size of the rooms can be understood as
satisfied when the room is large enough and dissatisfied when the room is too small.
Table 2. Summary of Survey.
I II III IV V VI VII
House Type
% % % % % % %
Floor Plan
Design Phase 2 2 4 5 5 5 5
Apartment Size in sqm 67 91 105 127 146 123 174
Number of Rooms 1 3 4 4 5 6 5 5
Occupants
Household Type
Single 0 0 0 0 0 0 0 0 0 0 0 0 0 0
Couple 3 10.0 0 0 4 13.3 0 0 1 3.3 0 0 0 0
Single with Children 7 23.3 0 0 2 6.7 0 0 0 0 1 3.3 0 0
Couple with Children 20 66.7 16 53.3 10 33.3 18 60.0 19 63.3 18 60.0 18 60.0
Several Adults 0 0 14 46.7 14 46.7 12 40.0 10 33.3 11 36.7 12 40.0
First Owners 4 13.3 22 73.3 13 43.3 7 23.3 12 40.0 13 43.3 8 26.7
Avg. Years of Occupancy 11.5 22.5 10.9 11.0 8.8 8.9 10.2
Avg. Number of Occupants 3.4 4.7 4.8 5.1 5.3 4.9 5.7
Any Tenants 1 3.3 10 33.3 10 33.3 9 30.0 5 16.7 6 20.0 9 30.0
Avg. sqm per person 19.9 19.4 22.0 25.1 27.5 25.1 30.7
Alterations
Living Room 0 0 4 13.3 5 16.7 15 50.0 14 46.7 19 63.3 4 13.3
Study 0 0 0 0 0 0 3 10.0 5 16.7 0 0 0 0
Bedroom 0 0 0 0 0 0 0 0 3 10.0 2 6.7 1 3.3
Kitchen 4 13.3 3 10.0 6 20.0 4 13.3 3 10.0 2 6.7 6 20.0
Toilet 0 0 0 0.0 3 10.0 0 0 4 13.3 0 0 3 10.0
No Alterations 26 86.7 23 76.7 19 63.3 12 40.0 10 33.3 11 36.7 22 73.3
Satisfaction/Dissatisfaction
Living Room
Satisfied: Privacy 0 0 2 6.7 10 33.3 13 43.3 11 36.7 2 6.7 6 20.0
Satisfied: Location 0 0 2 6.7 4 13.3 11 36.7 10 33.3 2 6.7 8 26.7
Satisfied: Size 24 80.0 24 80.0 24 80.0 24 80.0 25 83.3 19 63.3 19 63.3
Dissatisfied: Privacy 5 16.7 4 13.3 6 20.0 9 30.0 2 6.7 0 0 2 6.7
Dissatisfied: Location 0 0 0 0.0 1 3.3 0 0 0 0 0 0 0 0
Dissatisfied: Size 4 13.3 0 0.0 1 3.3 2 6.7 0 0 2 6.7 2 6.7
Kitchen
Satisfied: Privacy 0 0 3 10.0 5 16.7 10 33.3 0 0 2 6.7 6 20.0
Satisfied: Location 0 0 4 13.3 5 16.7 9 30.0 9 30.0 0 0 6 20.0
Satisfied: Size 25 83.3 25 83.3 21 70.0 20 66.7 9 30.0 10 33.3 6 20.0
Dissatisfied: Privacy 0 0 0 0 0 0 3 10.0 5 16.7 0 0 0 0
Dissatisfied: Location 0 0 0 0 1 3.3 0 0 4 13.3 0 0 0 0
Dissatisfied: Size 2 6.7 0 0 1 3.3 5 16.7 9 30.0 13 43.3 4 13.3
Bedroom
Satisfied: Privacy 0 0 3 10.0 7 23.3 12 40.0 18 60.0 15 50.0 8 26.7
Satisfied: Location 0 0 2 6.7 4 13.3 14 46.7 5 16.7 1 3.3 6 20.0
Satisfied: Size 20 66.7 12 40.0 18 60.0 23 76.7 11 36.7 13 43.3 11 36.7
Dissatisfied: Privacy 0 0 0 0 3 10.0 3 10.0 1 3.3 0 0 2 6.7
Dissatisfied: Location 0 0 0 0 0 0 0 0 0 0 0 0 1 3.3
Dissatisfied: Size 5 16.7 6 20.0 4 13.3 2 6.7 5 16.7 4 13.3 2 6.7
Others (Toilets/Balcony)
Satisfied: Privacy 0 0 1 3.3 5 16.7 10 33.3 2 6.7 6 20.0 3 10.0
Satisfied: Location 0 0 1 3.3 4 13.3 9 30.0 2 6.7 0 0 2 6.7
Satisfied: Size 10 33.3 15 50.0 15 50.0 20 66.7 2 6.7 14 46.7 4 13.3
Dissatisfied: Privacy 0 0 1 3.3 0 0 3 10.0 6 20.0 3 10.0 1 3.3
Dissatisfied: Location 0 0 0 0 0 0 0 0 5 16.7 0 0 1 3.3
Dissatisfied: Size 12 40.0 6 20.0 2 6.7 0 0 11 36.7 0 0 4 13.3
1 Method of counting room types: the number of rooms includes the living-dining room and bedrooms. The
kitchen and bathrooms are excluded from the count. For example, a three-room flat includes a living-dining room,
kitchen, bathrooms, and two bedrooms.Architecture 2022, 2 23
2.2. Spatial Approach
2.2.1. Morphological Analysis of the Housing Units
In recent years, the HDB’s emphasis has mostly been on improving public housing
through a more macro approach, such as precinct planning and policy changes. However,
limited research and analyses have been performed at a micro level. The social logic of
space—space syntax—is a method of analysis focusing on the micro-level scale, and it
represents an alternative approach to describing the spatial configuration of buildings.
This approach was introduced as a theory of space that translates building plans into
networks that can be used for studying the notion of its social position. However, due
to the complex nature of the raw network data, the social logic of space is effective as a
method of comparing various types of buildings with different historical timelines and
contexts. Therefore, after translating building plans into graphs, this paper first attempts to
identify the structural characteristics of the network by measuring the sum, mean depth,
and degree centralization, and then the closeness centrality is determined. These methods
have been employed to analyse the relationship between the social aspect of inhabitants and
the spatial patterns of housing plans [19,20]. Hence, this paper focuses on public housing
development and the spontaneous alterations made to individual units to understand the
spatial characteristics in relation to the characteristics of the residents according to their
expressed level of satisfaction.
2.2.2. Network Analysis Using Translated Housing Plans
Housing plans from different generations and alterations were translated into graphs.
Rooms were conceptualized as vertices represented by circles with relations of permeability
represented by lines showing connectivity with other vertices or spaces. The space that
connects the outside or the entrances was also reflected as a vertex and represented by
a circle with a cross [18]. By translating the floor plans of each unit into graphs, each
unit can be studied as a network, thereby allowing for cross comparisons despite the
diversity of designs in both qualitative and quantitative methods. Therefore, the mean
depth, sum, degree centralization, and closeness centrality of each network were measured
to understand the structural attributes of the network.
2.2.3. Mean Depth, Sum, Degree Centralization, and Closeness Centrality of a Network
The mean depth, sum, and degree centralization can be useful in identifying social
activities defined by space. Mean depth is measured by obtaining the shortest route
between all pairs of nodes, summing them, and then dividing the value by the total amount
of pairs. This process helps to identify the average number of steps from one node to
another. Sum is the aggregate of existing connections and represents the size of a network.
Degree centralization shows how unequal the distribution of centrality is in a network. In
other words, centrality, which in this case means a focal point that will specify important
structural characteristics of communication networks [21] and the degree centralization
of a network can be used as an index for accessing the potential communal interactions
in the network. Closeness centrality emphasizes the distance of a node to all others in
the network, and although it measures position globally, it is a characteristic of a node’s
position in a network. Therefore, every node is measured at the micro level so that a greater
proximity of one node to others in the network indicates greater centrality of the node’s
position globally.
3. Results
3.1. Survey Results
3.1.1. Resident Information
Table 2 provides a summary of the survey results with the average for each housing
type. The results show that in general, few first-time owners occupy these flats, which
implies that HDB occupants tend to move frequently from one place to another. The
interview results show that only housing type II has a high percentage of owners at 73%,Architecture 2022, 2 24
whereas the other types show ownership at below 50%. Furthermore, the average year of
occupancy for housing type II is 22.5 years, whereas the other types fall in the range of 8 to
12 years. This indicates that most homeowners do not intend to live in their units for life,
and a possible factor could be due to the changes in household structure and increasing
or decreasing size over time. The average household for each housing type is also shown
in Table 2. Although the average household size in Singapore is 3.3 [2], the survey results
show a rather high average size ranging from 4.7 to 5.7 in housing types II to VII. The
number of occupants in certain individual units is as high as eight or nine, such as in units
with multiple adult residents, which may refer to a multi-generational family of adults
living together or cases in which unrelated tenants live in the same household. We found
tenants in 50 units, which is almost a quarter (24%) of the total units. No single households
were included in the 210 households surveyed, which may be related to the eligibility
conditions for the purchase of HDB flats stipulating that only families can purchase [22].
3.1.2. Alterations to Housing
The number and percentage of homes that have not altered their configuration, or
have kept the original plan, is shown in Table 2. The results show that 41% of the total
households (87 out of 210) made alterations to their units by changing the configuration.
Housing types I, II, and VII had a high proportion of non-altered units. Thus, housing I and
II, which are two of the oldest buildings, did not have many alterations, while housing IV to
VI, which are relatively new, had more configuration changes. In terms of the relationship
between household type and alterations, couples with children (48 units or 55.2%) and
multiple adults (34 units or 39.1%) accounted for the majority of total households altered.
Of the households with tenants, 24 units (27.6%) were altered. However, when looking at
all the surveyed households, the correlation between housing alteration and household
type is very low overall with couple: 0.03; single with children: 0.14; couple with children:
0.03; and several adults: 0.08 (a value between 0 and 0.1 is none or very weak, 0.1 and 0.3 is
weak, 0.3 and 0.5 is moderate, and 0.5 and 1.0 is strong). These findings indicate that no
clear pattern can be found in alterations according to the housing population, which also
suggests that the association with satisfaction can be very little.
3.1.3. Room Satisfaction
With respect to satisfaction with the living room, kitchen, and bedroom size, the
feedback was generally good. In particular, the living room in housing types I to V received
high satisfaction ratings of above 80%. The low alteration rate of living rooms for housing
types I to III implies that the original size was sufficient. A similar conclusion was reached
for the kitchen size in housing types I and II. On the other hand, the privacy and location
of these housing types received rather low satisfaction ratings of below 30%. However,
certain households did show slight satisfaction with privacy and location, although not to a
great extent. For example, the rating for the bedroom location in housing type V was above
60%. Greater satisfaction with the privacy and location of various rooms was observed for
housing type IV, where ratings ranged between 30% and 50%. In terms of dissatisfaction,
no situations stood out. However, the occupants of housing types I, V, and VI showed
dissatisfaction with the size of the kitchen and/or other rooms at a rate over 30%.
3.2. Network Analysis Results
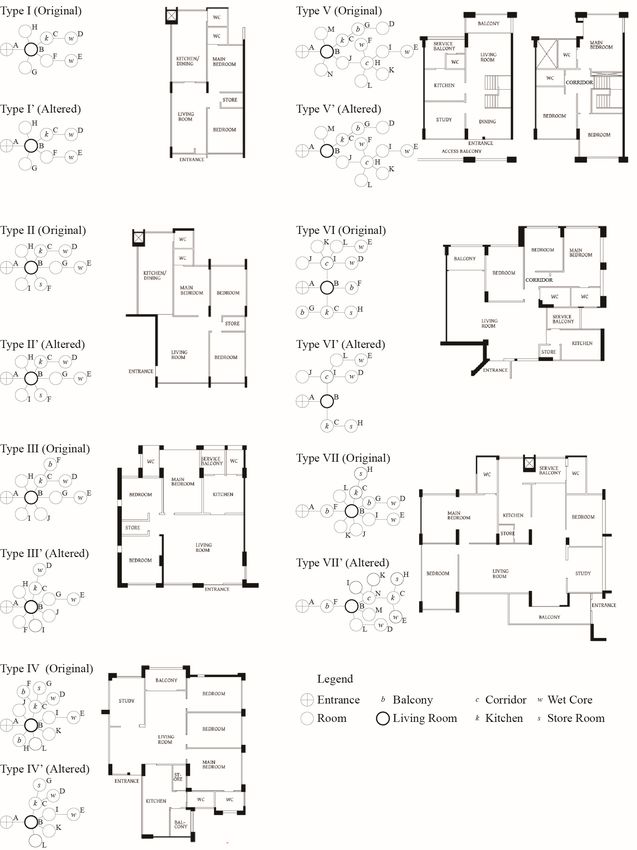
Figure 1 shows the original housing plans of different eras and graphs of the original
and the altered plans. Information collected on alterations of individual units was compiled
to model the altered layout. The typical alterations (either the removal or addition of
walls) were accumulated and recorded for the altered network configuration. The units
were evaluated by comparing the original and altered configurations. An analysis was
performed of the network attributes of mean depth, sum, network centralization, and
closeness centrality of the original and altered layouts, and the results are summarized inFigure 1 shows the original housing plans of different eras and graphs of the origina
and the altered plans. Information collected on alterations of individual units was com
piled to model the altered layout. The typical alterations (either the removal or additio
of walls) were accumulated and recorded for the altered network configuration. The unit
Architecture 2022, 2 were evaluated by comparing the original and altered configurations. An analysis 25 wa
performed of the network attributes of mean depth, sum, network centralization, an
closeness centrality of the original and altered layouts, and the results are summarized i
Table3. 3.
Table These
These attributes
attributes allow
allow us tous to understand
understand the different
the different social connections
social connections between betwee
various
various units.
units.
Figure 1. The original housing plans and graphs of the original and the altered plans.
3.2.1. Mean Depth
Table 3 indicates that different units have an average mean depth of 1.8 to 2.0. This
small range demonstrates consistency in HDB planning, and each room can be accessed
within two nodes from the other rooms. The altered units also have a mean depth that falls
within the same range as the original unit plans, showing that changes to the configuration
do not alter the average mean depth.
3.2.2. Sum
The sum shown in Table 3 represents the aggregate value of different connections
in a given unit type and signifies the network size. When comparing two networks
with the same number of nodes, the sum can be used to differentiate and assess the
interconnectedness. Networks with a higher sum can be assumed to be more connected.Architecture 2022, 2 26
However, when comparing the sum between original and altered configurations, the
original configuration usually has more nodes and, therefore, offers more ties within the
network. The original configurations have a sum ranging from 14 to 26, whereas the
altered configurations have lower values ranging from 14 to 22. This difference could
be due to the simplification of the network because altered units usually involve the
removal of intermediate nodes; however, this lower sum value does not imply that altered
configurations are less connected than the original ones.
Table 3. Results of network analysis 1 .
DC 3,4 Closeness Centrality
Type MD 2 Sum
% nCloseness and (Node)
77.8 53.8 53.8 46.7 46.7 46.7 36.8 36.8
I 1.8 14.0 61.9
(B) (C) (F) (A) (G) (H) (E) (D)
77.8 53.8 53.8 46.7 46.7 46.7 36.8 36.8
I’ 1.8 14.0 61.9
(B) (C) (F) (A) (G) (H) (E) (D)
80.0 53.3 53.3 47.1 47.1 47.1 47.1 36.4 36.4
II 1.8 16.0 67.9
(B) (C) (G) (H) (A) (F) (I) (D) (E)
80.0 53.3 53.3 47.1 47.1 47.1 47.1 36.4 36.4
II’ 1.8 16.0 67.9
(B) (C) (G) (H) (A) (F) (I) (D) (E)
72.7 57.1 50.0 44.4 44.4 44.4 38.1 38.1 34.8
III 1.8 16.0 51.8
(B) (C) (G) (H) (A) (I) (F) (D) (E)
81.8 52.9 52.9 47.4 47.4 47.4 47.4 47.4 36.0 36.0
III’ 1.8 18.0 72.2
(B) (C) (G) (I) (A) (F) (J) (H) (D) (E)
73.3 57.9 47.8 44.0 44.0 44.0 44.0 44.0 37.9 37.9 37.9 33.3
IV 1.8 22.0 56.4
(B) (C) (I) (A) (J) (K) (H) (L) (G) (D) (F) (E)
72.7 57.1 50.0 44.4 44.4 44.4 38.1 38.1 34.8
IV’ 1.8 16.0 51.8
(B) (C) (I) (K) (A) (L) (G) (D) (E)
46.4 46.4 43.3 36.1 32.5 32.5 32.5 32.5 31.0 31.0 31.0 28.3 25.0 22.4
V 1.9 26.0 28.2
(B) (J) (H) (C) (A) (M) (N) (I) (L) (K) (F) (G) (E) (D)
50.0 50.0 45.8 36.7 34.4 34.4 34.4 34.4 32.4 32.4 27.5 26.2
V’ 1.8 22.0 34.6
(H) (J) (B) (I) (K) (F) (L) (C) (A) (M) (E) (D)
57.9 57.9 44.0 40.7 37.9 37.9 37.9 37.9 37.9 31.4 31.4 29.7
VI 1.8 22.0 34.6
(B) (I) (C) (L) (A) (D) (K) (J) (F) (H) (G) (E)
61.5 57.1 44.4 42.1 40.0 40.0 38.1 32.0 30.8
VI’ 1.8 16.0 35.7
(I) (B) (L) (C) (D) (J) (A) (E) (H)
73.3 52.4 52.4 47.8 47.8 44.0 44.0 44.0 35.5 35.5 33.3 33.3
VII 2.0 24.0 54.6
(B) (G) (C) (F) (I) (J) (K) (L) (D) (H) (A) (E)
55.0 55.0 42.3 39.3 39.3 36.7 36.7 36.7 30.6 30.6 28.9 28.9
VII’ 1.8 22.0 23.6
(B) (N) (C) (L) (F) (M) (I) (K) (H) (E) (A) (D)
1 Network measures were computed in Ucinet version 6.0 [23]. 2 Mean Depth. 3 Degree Centralization.
4.A network with 100% centralization will be a star-shaped network and represents when one node in the
centre is the only one tied to the rest. The opposite network is a wheel-shaped linear network and has a de-
gree centralization of 0%, where all nodes are equally connected to each other and, thus, a central area is not
observed [24].
3.2.3. Degree Centralization
Degree centralization measures the level of centralization in a network, with network
centralization demonstrating the efficiency of conveying information from one node to
another. Essential social attributes within network structures can then be easily identified
using network centralization. A higher value indicates a more centralized network and,
thus, signifies greater interconnectedness between the nodes. As shown in Table 3, degree
centralization is the same for housing types I and II and increases for housing types III, V,
and VI after configuration alterations. The values for housing types I to IV for both the
original and altered configurations are high at above 50%, suggesting that this enhanced
network supports greater opportunities for communication.Architecture 2022, 2 27
3.2.4. Closeness Centrality
Closeness centrality can be considered an index of the expected time-until-arrival
for items flowing through the network with optimal paths. Therefore, a larger value
corresponds to a node that is closer to the centre of a network. For a more comprehensive
analysis, the rooms in Table 3 are arranged in the order of closeness centrality. Table 3
clearly shows that node B, which is a living room, is always ranked the highest amongst
all other rooms in the original housing plan. For housing types I to IV, the living room is
followed in rank by node C, which is the kitchen. The kitchen in housing types V to VII is
ranked either third or fourth. For nodes D and E, which are bathrooms, one will always be
ranked last and the other will be ranked relatively close to last, except in the case of housing
type VI. This finding is because node D in housing type VI is an independent bathroom
that can be accessed directly from common spaces, and it is located adjacent to node I, a
corridor, which creates a high closeness centrality within the unit. Limited differences are
observed with the altered versions of housing types I to IV and VII. For housing types V
and VI, the alterations show a decline in the closeness centrality value for node B, the living
room, and node C, the kitchen. Node H of housing type V and node I of housing type VI,
which are both corridors, present the highest closeness centrality.
3.3. Summary of Satisfaction and Dissatisfaction by Housing Type
Housing types I and II generally show rather high satisfaction ratings for all rooms,
despite having fewer square metres per person (20 m2 per person) than the other housing
types. However, the bathroom size, especially for type I, is dissatisfactory. Housing types
II and III have the highest number of tenants. However, both types are consistent in the
satisfaction level for all rooms. The survey of all interviewed households also shows that
the influence of room satisfaction by the tenants is very little. Dissatisfaction with privacy
for the living room has less impact with the presence of the tenants, which suggests that
privacy is affected by the spatial relationship between the living room and the exterior
rather than its location in the interior plan. A possible explanation for this privacy issue
is the location of the living room window, which typically faces the communal corridor
outside. This can be seen from the type IV housing plan shown in Figure 1. For housing
types I to IV, the degree centralization values of both original and altered plans are relatively
high at above 50%. Moreover, the same results were obtained for closeness centrality, with
the living room and the kitchen presenting the highest values and the two bathrooms
presenting the lowest value. This finding indicates that the central areas of the household
are the living room and the kitchen.
Housing type V, which is a maisonette, has one of the largest square metres per person
(28 m2 per person). However, satisfaction with the size of this type is not significant, and
it has a relatively higher rate of dissatisfaction compared with other housing types with
respect to the privacy, location, and size of the kitchen and other spaces, plus it presents
a high alteration rate. Both housing types VI and VII do not register strong satisfaction
or dissatisfaction. Although the square metres per person in these two housing types is
significant (25 m2 per person for type VI and 31 m2 per person for type VII), even the level
of satisfaction with the living room size is below 70%, which is relatively low compared
with that of the other housing types, which are above 80%. One commonality of housing
types V to VII is that the degree centralization is low compared with that of types I to IV
(although the degree centralization for the original plan of type VII is above 50%). Moreover,
for housing types V and VI, the closeness centrality of the living room is not the highest
among the altered plans, and the kitchen and living room are not located next to each other
in the original and altered plans. A review of the closeness centrality of the altered plans
indicates that the most central place within the household becomes the corridor space.
4. Discussion and Conclusions
The aim of this study is to provide insights into the existing housing configurations and
the spatial preferences of the inhabitants. Other issues can also affect housing selections,Architecture 2022, 2 28
such as the property value, the type of flat, the amenities nearby, and the travel time
from home to work, school, or another daily commute. In-depth studies of both the
circumstances of specific families and the social status of residents may provide additional
insights into dwelling preferences. However, this study focused on the design of HDB
housing floor plans, which previously had not received much attention, in an attempt to
provide another dimension of quality through the relationship between inhabitants and
their dwelling space. To determine the relevance of this relationship, the study examined
210 flats with 30 occupants from the 7 types of floor plans using a two-pronged research
methodology: spatial network analysis and qualitative measures.
The survey found that 59% of households had not altered their homes, and among the
41% that altered, almost no association was observed between the alteration and changes
in the family situation, such as an increase or decrease in household size or a change in
household type. Thus, alterations and satisfaction may not be associated. The reason for the
low rate of alterations might be certain limitations that increase the difficulty of performing
such changes. HDB homeowners who wish to modify their unit are often hindered by
restrictive regulations imposed by the housing authorities. For example, the main structural
elements in the layout of the housing unit itself cannot be modified drastically, thereby
reducing the ability of residents to reorganize their interior spaces. In addition, the Housing
and Development (Renovation Control) Rules 2006 require flat owners to select renovation
contractors who have been registered with the HDB to conduct any renovations in the flat.
Surprisingly, 24% of households share their flat with tenants, and not much influence
can be observed between the privacy of rooms and the presence of tenants in these units,
which might be related to the relatively large households. However, this finding does
not mean that a larger flat size leads to greater satisfaction. The size aspect has a greater
relationship with other factors. Our survey shows that certain associations occurred
between satisfaction with size and the positioning of the rooms. We observed a higher
percentage of satisfaction in units where the living room and kitchen were the most central
areas of the home. This result is clearly observed in the flats with the older designs, which
suggests that these housing plan designs are more suited in terms of spatial relationship to
the lifestyle of Singaporeans.
Moreover, alterations to housing do not necessarily increase spatial satisfaction, which
is further illustrated by the finding that only 38% of surveyed occupants were the first
owners of their units. An inference can be made that most homeowners do not intend
to live in their units for life and will move to another place when their households un-
dergo changes in structure and size over time. Nevertheless, the ability to make minor
alterations to a housing plan and renovation rules that allow for individual preferences are
always desirable.
In addition, because households may include tenants, which was observed in 24%
of the surveyed occupants, current housing plans may not adequately cater to diversified
occupant configurations. The survey of households in the studied housing configurations
reveals that certain households are restricted to specific unit types, and this information
was further substantiated when comparing the types of alterations performed. Units with a
smaller household indicated a decreased need for extra space, such as multiple bathrooms
and balconies. Hence, such households could be restricted to smaller living spaces and
units. Larger households, on the other hand, could also be restricted to living in units with
a limited number of rooms. Therefore, because of the expectation of Singaporeans that
they will not live long in the same flat, as well as the diversity of family structures and the
possibility of households with tenants, more options must be provided for differentiated
fixed configurations that consider the spatial relationship between dwellings and the
domestic lives of their residents. Moreover, a spatial system that allows occupants to
make minor alterations is required, and all of these features can be easily accomplished.
The appropriation of space such as the placement of furniture may also provide effective
impact on creating ephemeral alterations that can lead to increasing spatial satisfaction.
Offering differentiated housing plans will not only expand the selection of housing unitsArchitecture 2022, 2 29
for potential homeowners but will also be beneficial for architectural development and
built space at any scale.
In conclusion, the network analysis performed here has helped in the evaluation
of the relevance and applicability of today’s housing configurations. In addition, by
highlighting the associations between a housing unit’s spatial properties and the spatial
preferences and satisfaction level of its inhabitants, this paper supports and provides
information that is relevant for housing design practice in the future. However, it can
be deepened by questioning more social backgrounds of the inhabitants to explain in
detail why homeowners do not intend to live in their units for life, their interactions with
tenants, and identifying what alterations can lead to better spatial satisfaction, which
may lead to new HDB plans. In all, this research demonstrates that an examination of
dwellings through the network analysis approach is not simply a matter of incorporating
theoretical concepts; it also offers a model that highlights attributes that are significant for
contemporary domestic life.
Author Contributions: Conceptualization, J.T. and K.F.; methodology, J.T.; software, J.T.; validation,
J.T. and K.F.; formal analysis, J.T.; investigation, K.F.; resources, J.T. and K.F.; data curation, J.T.;
writing—original draft preparation, J.T. and K.F.; writing—review and editing, J.T.; visualization, J.T.
and K.F. All authors have read and agreed to the published version of the manuscript.
Funding: This research received no external funding.
Institutional Review Board Statement: Not applicable.
Informed Consent Statement: Informed consent was obtained from all subjects involved in the study.
Data Availability Statement: Not applicable.
Conflicts of Interest: The authors declare no conflict of interest.
References
1. Sim, L.L.; Lim, L.Y.; Tay, K.P. Shelter for all: Singapore’s strategy for full home ownership by the year 2000. Habitat Int. 1993,
17, 85–102. [CrossRef]
2. Department of Statistics. Yearbook of Statistics Singapore; National government publication: Singapore, 2017.
3. Ramesh, M. One and a half cheers for provident funds in Malaysia and Singapore. In Transforming the Developmental Welfare State
in East Asia; Palgrave Macmillan: London, UK, 2005; pp. 191–208.
4. Chua, B.H. Political Legitimacy and Housing: Stakeholding in Singapore; Routledge: London, UK, 1997.
5. Wong, A.K.; Yeh, S.H. (Eds.) Housing a Nation: 25 Years of Public Housing in Singapore; Housing Development Board:
Singapore, 1985.
6. Chua, B.H. Maintaining housing values under the condition of universal home ownership. Hous. Stud. 2003, 18, 765–780.
7. Sim, L.L.; Yu, S.M.; Han, S.S. Public housing and ethnic integration in Singapore. Habitat Int. 2003, 27, 293–307. [CrossRef]
8. Teo, P.; Huang, S. A sense of place in public housing: A case study of Pasir Ris, Singapore. Habitat Int. 1996, 20, 307–325.
[CrossRef]
9. Khoo, C.L. Conservation Moves into Top Gear. Mirror 1989, 25, 10.
10. Keys, P. Conservation as an integral part of urban renewal. Planews J. Singap. Inst. Plan. 1981, 8, 39–49.
11. Wang, J. The developmental state in the global hegemony of neoliberalism: A new strategy for public housing in Singapore. Cities
2012, 29, 369–378. [CrossRef]
12. Yuen, B.; Yeh, A.; Appold, S.J.; Earl, G.; Ting, J.; Kurnianingrum Kwee, L. High-rise living in Singapore public housing. Urban
Stud. 2006, 43, 583–600. [CrossRef]
13. Utsumi, S.; Takai, H.; Suzuki, M. Habitability Evaluation of Residents in Super High-rise Apartments by HDB. In Summaries of
Technical Papers of Annual Convention; Architectural Institute of Japan: Tokyo, Japan, 2017; pp. 1019–1020.
14. Suzuki, M.; Takai, H.; Utsumi, S. The Usage and Evaluation of the Common Space & Facilities in Super High-rise Apartment by
HDB. In Summaries of Technical Papers of Annual Convention; Architectural Institute of Japan: Tokyo, Japan, 2017; pp. 1021–1022.
15. Teo, S.E.; Kong, L. Public housing in Singapore: Interpreting ‘quality’ in the 1990s. Urban Stud. 1997, 34, 441–452.
16. Ozsoy, A.; Altas, N.E.; Ok, V.; Pulat, G. Quality assessment model for housing: A case study on outdoor spaces in Istanbul. Habitat
Int. 1996, 20, 163–173. [CrossRef]
17. Tibesigwa, B.M.; Hao, L.; Karumuna, B.V. The concept of spatial quality and its challenges on exercised affordable housing design
typology in Dar es Salaam–Tanzania. Habitat Int. 2017, 59, 44–59. [CrossRef]
18. Hillier, B.; Hansen, J. The Social Logic of Space; Cambridge University Press: Cambridge, UK, 1984.Architecture 2022, 2 30
19. Hanazato, T.; Hirano, Y.; Sasaki, M. Syntactic analysis of large-size condominium units supplied in the Tokyo Metropolitan Area.
J. Archit. Plan. Trans. AIJ 2005, 591, 9–16. [CrossRef]
20. Tamura, J. Spatial Patterns in Incremental Process of Low-Income Population—The Case of Lusaka Sites and Services Project. J.
Archit. Plan. 2014, 79, 1995–2002. [CrossRef]
21. Freeman, L.C. Centrality in social networks conceptual clarification. Soc. Netw. 1978, 1, 215–239. [CrossRef]
22. Sin, C.H. Segregation and marginalisation within public housing: The disadvantaged in Bedok New Town, Singapore. Hous.
Stud. 2002, 17, 267–288. [CrossRef]
23. Borgatti, S.P.; Everett, M.G.; Freeman, L.C. Ucinet 6.0 for Windows: Software for Social Network Analysis; Analytic Technologies:
Harvard, IL, USA, 2002.
24. Beauchamp, M.A. An improved index of centrality. Behav. Sci. 1965, 10, 161–163. [CrossRef] [PubMed]You can also read