Radars and Rainfall Extremes
←
→
Page content transcription
If your browser does not render page correctly, please read the page content below
Radars and Rainfall Extremes
How can we make use of long-term radar observations
and modelling to better characterize and understand
rainfall extremes in Australia ?

 Alain Protat
 Australian Bureau of Meteorology

 Joshua Soderholm, Valentin Louf,
 Sugata Narsey, Rob Warren, Christian Jakob
 Monash University
Measuring Rainfall …
• Point measurement : rain gauge, disdrometers. Typical resolution 1 to 10 minutes,
  generally aggregated to 1 hour or 1 day
 – Pro : accurate (but not perfect !) measurement
 – Con : cannot capture spatial variability of rainfall (unless you are very rich)

• Convective scale and mesoscale (300*300 km) : weather radars. Typical resolution
  of radar products ~ 1 km (horizontal) x 0.5 km (vertical) , 1 obs every 5-10 minutes
  at each point. New opportunistic observations : microwave links from phone
  companies (not exploited yet in Australia)
 – Pro : spatial coverage, large range of rainfall values (light to extreme)
 – Con : accuracy → geometry, beam blocking, rain/hail mixture, clutter, insects,
    birds, fire, chaff, UFOs, …

• Regional (1000s kms) and global scale : polar-orbiting and geostationary satellites
  using a combination of microwave, vis, IR, and radar sensors. To some extent,
  denser parts of operational radar networks for some regions.
 – Pro : only way to get rainfall at those scales
 – Con : accuracy (esp. land), temporal resolution (at least 3h)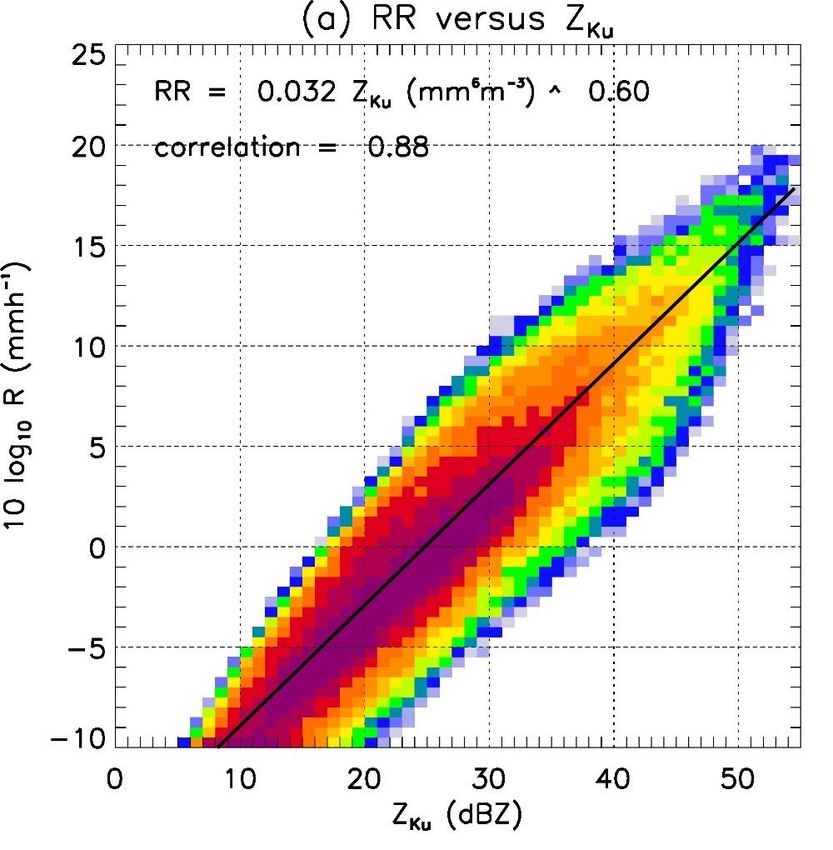
Characterizing Rainfall Extremes with Radar!
• General consensus for city-scale / small region studies of rainfall extremes:

    Radars assisted with rain gauge data. Mesoscale coverage + time resolution
    needed for process studies
    Microwave link retrievals should one day be added to that list.
    Bureau solution (single-pol radars): Rainfields (blended radar – rain gauge)

• Reasons :

    Regions where people live in Australia are well covered by decent radars
    Dual-polarization radars are coming (but no historical data)
    Dense rain gauge networks where people live (+ a lot of microwave links)
    → Accuracy of radar-derived rainfall estimations is at its highest

    WCRP Core indices for sub-daily precipitation and longer time scales
    can all be estimated using radar reflectivities converted to rainfall rate.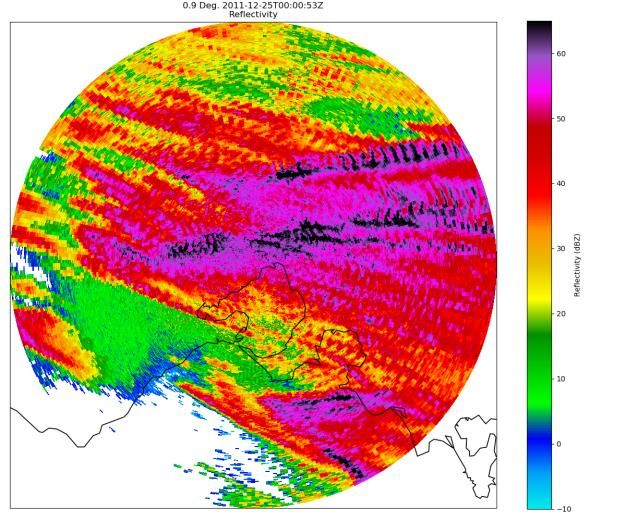
Weather Radars

• Radars provide quantitative information on convective clouds in a ~ 300 km x 300
  km and over the whole troposphere. The same point is measured every 5-10 mins

• Volumetric sampling : azimuthal scans for about 15 elevation angles
• Typical resolution of radar products ~ 1 km (horizontal) x 0.5 km (vertical)

• Primary measurement is reflectivity, which relates to the intensity of convection
  (rainfall rate close to the ground, ice water content aloft) and important
  convection properties (CTH, CAF, etc …)

• Doppler radars provide additional information on convective dynamics (3D winds,
  mesocyclone detection) inside convection and also clear-air at close range (
The bread and butter : the Z – R relationship
Latitudinal variability
of Z – R relationship
10 mm/h
4 mm/h
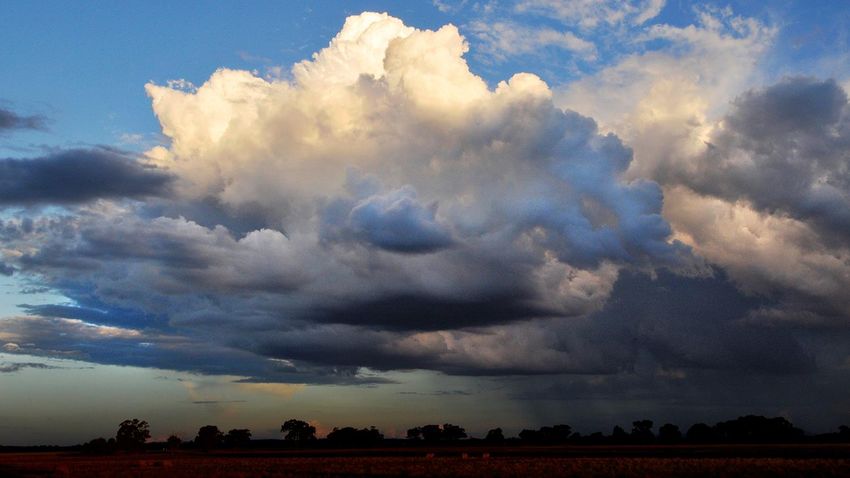
Weather Radars
… Are … NOT … perfect ?
Protat et al. 2019, in prep.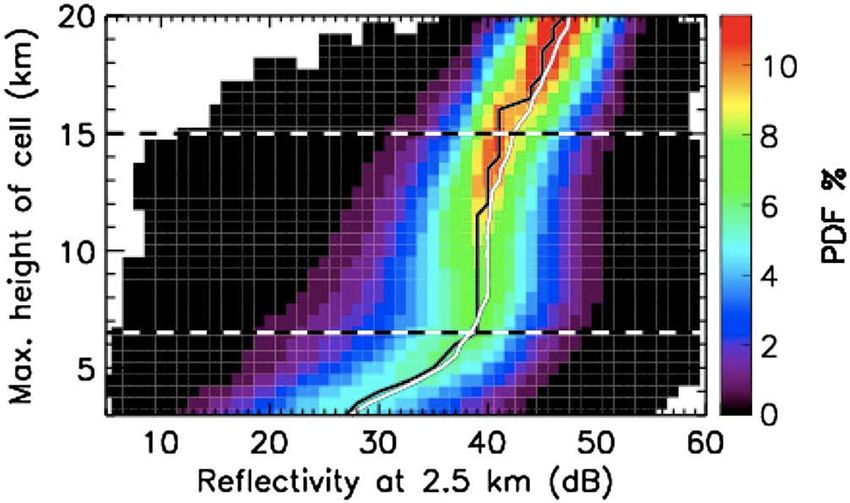
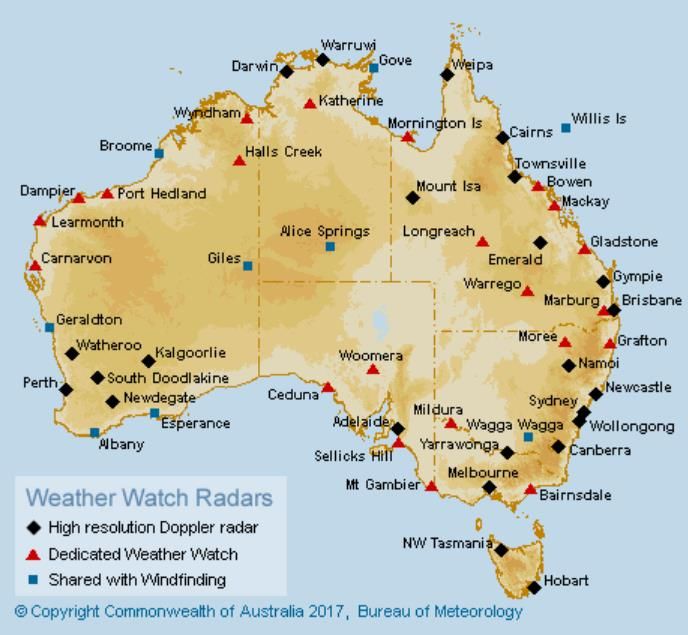
The Australian Operational Radar Network

• Four capital city operational radars upgraded to dual-pol (yay !)

                                          Dual-pol Upgrade
                                          May – September 2017

                                          •   Buckland Park (Adelaide)
                                          •   Mt Stapylton (Brisbane)
                                          •   Terrey Hills (Sydney)
                                          •   Laverton (Melbourne)

                                          Next ones ordered (FY18-19):

                                          • Esperance, Albany, Geraldton (WA)
                                          • Tindal (NT)

• New 10 yr + radar contract signed (new radars = dual-pol !)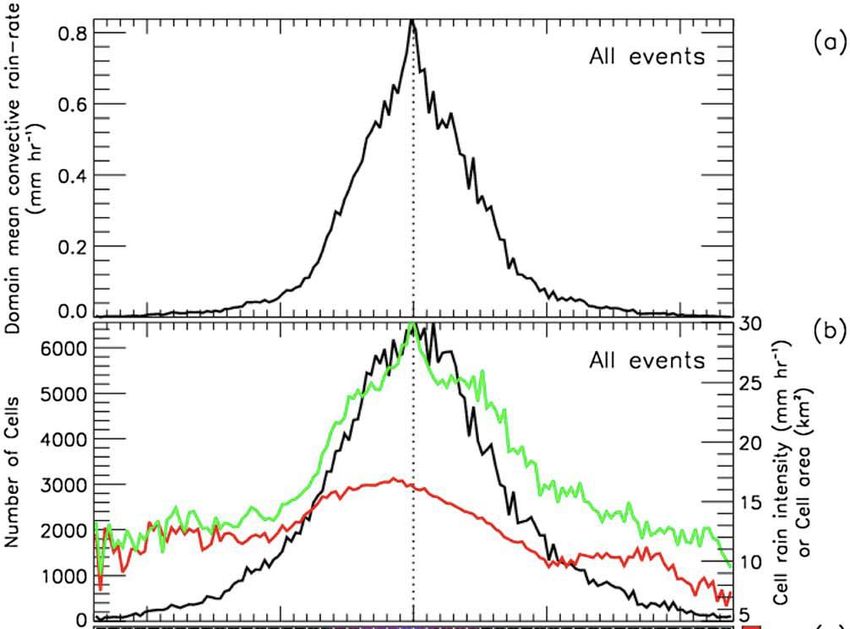
Building a National Operational Radar Archive
            (Joshua Soderholm)

Status :
Completed for all radars: Collation (from 4 archives, daily files, naming
convention), Recovery (15-20% corrupted, repaired), Conversion (HDF5
Odim + daily image of max ref), Calibration (TRMM/GPM+clutter)

Prototype gridded rainfall, hail size and azimuthal shear available for
the Brisbane, Melbourne and Sydney radars (18-20 yrs)

Next steps : CTH, clutter, attenuation, better rainfall, other radars, training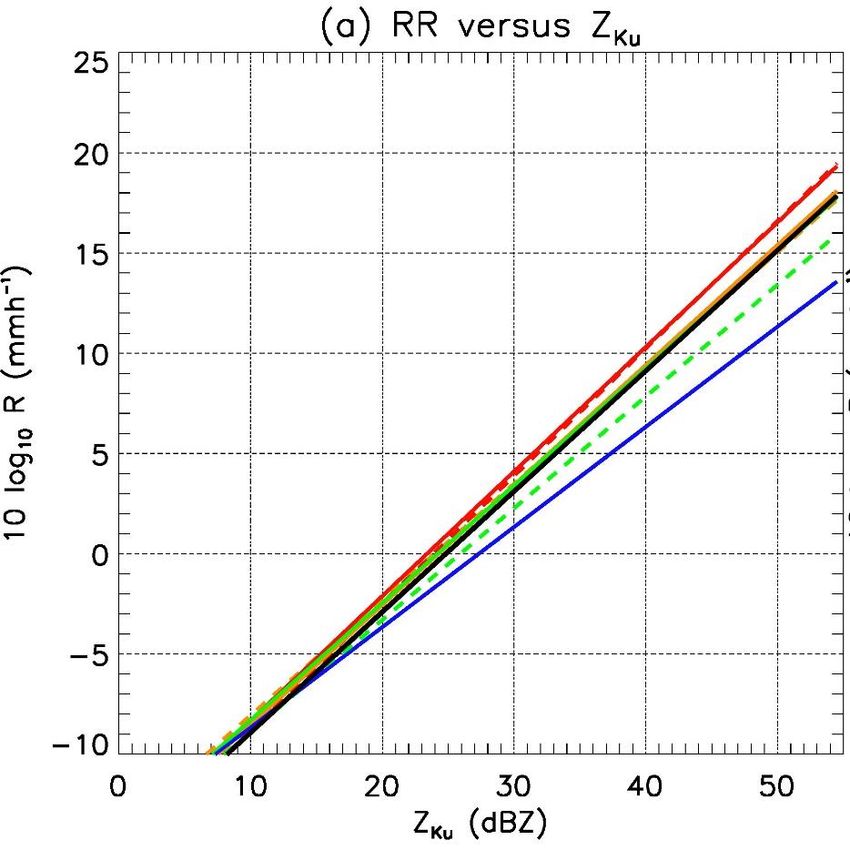
Building a National Operational Radar Archive:
   Radar data quality control underpins everything !

Fantastic work from R. Warren, V. Louf, M. Whimpey, J. Soderholm
Radar sources of uncertainties for rainfall

• Removal of non-meteorological echoes : major problem is ground clutter. High
  reflectivity = artificially high rain rates near ground !
   ▪ Mitigation for the Open Radar Archive: additional corrections, looking for
      permanent echoes with high reflectivities / low Doppler.

• Regional variability of the Z – R relationship
   ▪ Mitigation for the Open Radar Archive: local relationships are derived from
     ~matched rainfall from gauges and radar reflectivity above rain gauge
   ▪ Convective and stratiform relationships will be derived and used.

• Partial or complete beam blocking in orographic areas = artificially low rain rates
   ▪ Mitigation for the Open Radar Archive: identify + correct cases that can be

• Rain / hail mixture = artificially high rain rates
  ▪ Mitigation for the Open Radar Archive: not much we can do about that for
     single-pol radars. Some threshold on Z will be applied (~55 dBZ). This could
     have effects for extremes (to be investigated, probably with dual-pol data)
Characterizing Rainfall Extremes …
• A heavy rainfall case will be labelled "extreme" because of its impact.
– Should we study different types of extremes : producing flash floods, floods due
to high accumulation, high total rainfall regionally producing basin-scale issues,
longer timescale accumulations of rain ?
– If we have to, should the indice(s) used to characterize extremes be tailored to
the actual type of extreme: high percentile of rainfall PDF, threshold on
instantaneous rainfall rate, on accumulated rainfall rate, etc …
– If this is a proper framework, next we need to characterize :
▪ The morphology of heavy rainfall cases : what do they look like ?
▪ The large-scale "conditions" or "forcing" or "environment" conducive to each
type of extremes, using these tailored indices
• Is the same sort of discussion also relevant to heat extremes ?
Should we discuss the use of collaborative tools ? (LS forcing ?)Characterizing Rainfall Extremes with Radar • With a high-quality database of radar rainfall extreme cases, we need to study: – The morphology of extreme cases and associated processes: their internal structure, mesoscale organization, distribution of convective properties, the relative importance of warm versus cold rain processes, presence of hail, mesocyclones, etc … – The composite analysis of these cases to understand physical processes: group all cases to investigate their life cycle, their diurnal cycle, statistically. – The large-scale environment conducive to these extremes : either using reanalyses (maybe OK for the midlatitudes ?) or the so-called variational analysis (recommended for the sub-tropics and tropics) • High-resolution model evaluation / improvement → simulations can then be used to extend the radar process studies with what radars can't measure • Global models' cumulus parameterization improved using statistical radar analyses → how will rainfall extremes change in a changing climate?
Mesoscale convective systems (MCSs)
Schumacher and Johnson (2006):
● Of all extreme (50-yr) 24-h rain events in
the eastern CONUS during 1999–2003,
over 66 % were associated with MCSs
● Of these, >33 % were training line /
adjoining stratiform (TL/AS) systems and
~20 % were back-building (BB) systems
Stevenson and Schumacher (2014):
● Of all extreme (100-yr) 24-h rain events
in the eastern CONUS during 2002–
2011, over 63 % were associated with
MCSs
● Two of the top ten events were
associated with TL/AS MCSs (the rest
were synoptic or tropical systems)
Schumacher and Johnson (2005)
Stolen from Rob Warren ☺
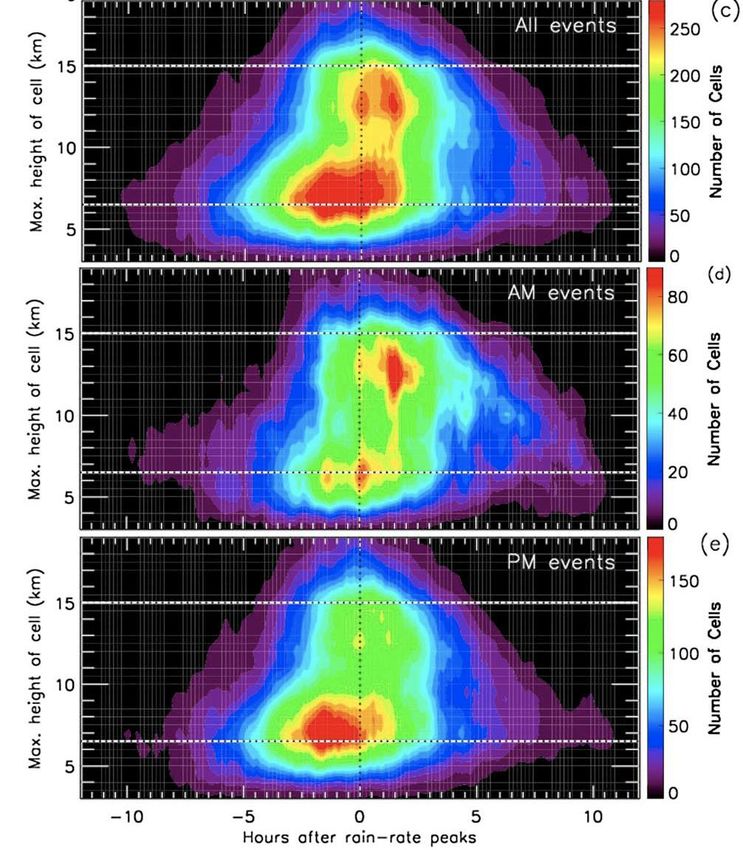
AMOS Workshop on High Impact Weather Predictability and ProcessesComposite life cycle of 144 heavy tropical rain cases
• The composite time evolution confirms dominant role of area fraction.
Gradual growth of cloud depth from congestus to deep, but they also
coexist.
Rain intensity
Convective area
Cell number
Kumar et al., 2013, JGRWhat drives convective area fraction ?
• Convective area fraction is strongly related to convergence (vertical
motion, moisture), not to CAPE – most parameterizations use CAPE
Convergence
Davies et al., 2013, JGR
CAPE
Convective area fraction Rainfall intensityConvective types and associated rain
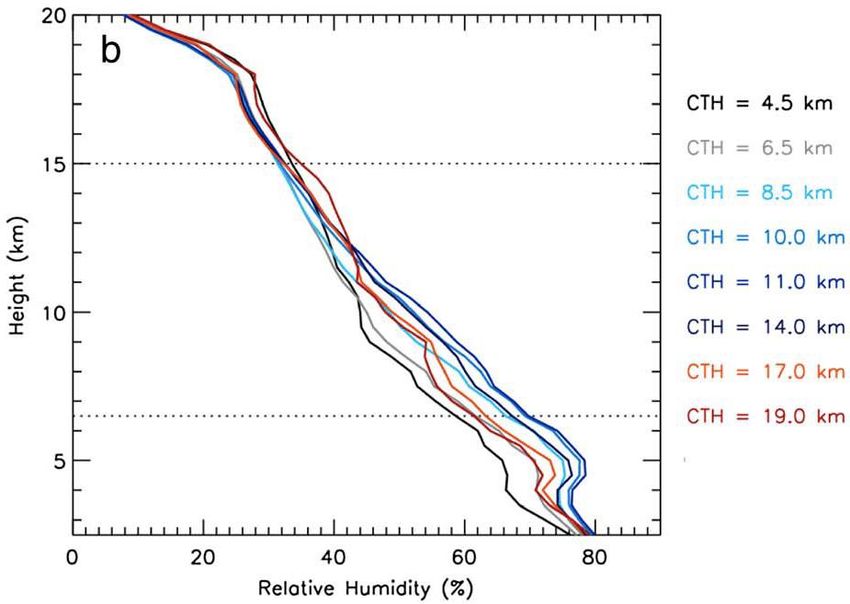
• Using CPOL radar echo top height, we identify 3 types of precipitating
convection (not including shallow convection). The most extreme rainfall
(at 10-mn timescale) originates in overshooting convection, which itself
occurs in a relatively dry environment.
CPOL 2.5 km Z as a function of ETH
Kumar et al., 2013, JGRLarge-scale controls of convection
• Moisture strongly affects area fraction and velocity in opposing ways,
CAPE mostly affects velocity and CIN and w500 control the existence of
convection.
Moisture
CAPE
CIN
w500
Kumar et al., 2015, JASContribution of convective populations
to total convective mass flux
• The three convection types contribute to total mass flux in unique ways,
with different vertical distribution.
Kumar et al., 2015, JASConclusions
• Radars are awesome but not perfect !
• Radars can be used to understand the mesoscale organization of extremes
• The National Open Radar Archive will be an invaluable resource
• Radars and a description of the largescale environment can be used to
understand what large-scale conditions are conducive to extremes
• Radars can be used to evaluate and improve high-resolution models and global
model parameterization of convection
• Big questions :
– What are the spatial and temporal distributions of storms producing rainfall
extremes in Australia?
– What are the large-scale and mesoscale processes involved in Australia?
– What are the primary organisational modes of convection?
– How predictable are Australian storms producing rainfall extremes given
current and soon-to-be operational forecast systems?
– How is climate change likely to influence storms producing rainfall extremes in
Australia?Thanks
Alain Protat : alain.protat@bom.gov.au
Tel: +61 3 9669 8128You can also read