Recovery and Renewal - an economic strategy for the Causeway Coast and Glens - Causeway Coast & Glens Borough Council
←
→
Page content transcription
If your browser does not render page correctly, please read the page content below
Recovery and Renewal –
an economic strategy for
the Causeway Coast and
Glens
Causeway Coast & Glens Borough Council
July 2020
Contents
1. A new economic reality                                                 1
2. Causeway Coast and Glen’s economy                                      4
3. Identifying growth opportunity sectors                                 39
4. Framing our borough’s challenges                                       56
5. Recovery and Renewal – an economic plan for Causeway Coast and Glens   65
6. Answering our call to action                                           73
7. Resourcing our strategy                                                77
1 A new economic reality

[Type here]
1. A new economic reality
1.1 Introduction
The economic strategy and action plan for the Causeway Coast and Glens council area was envisaged
in a vastly different context, one where the global and local economies were in relatively positive growth
territory, albeit with a range of long standing and emerging challenges in play. These challenges
included the prospect of trade wars between China and the USA and the unknown terms of trade for
the UK following the European Union Exit threatening to derail the global economy and long standing
issues such as high levels of deprivation and economic activity etc. holding back the local economy.
While many of our economic challenges hold, Covid-19 changed everything. While the economic
challenges will always rightly pale in significance against the human tragedy of the global pandemic, it
is appropriate to acknowledge the long-standing challenges our economy faces, take the economic
lessons from the Covid-19 crisis and strive to meet them head on.
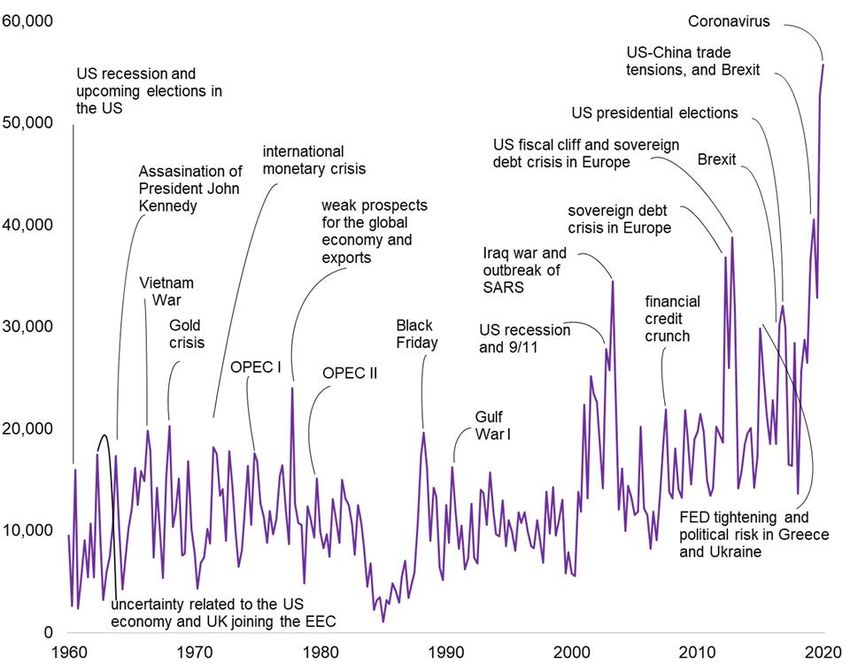
1.2 An uncertain path
The future path for the economy deeply uncertain. At the time of writing (July 2020), close to 20 years’
worth of economic growth have been lost in little over three months. HM Treasury’s collation of
independent forecasts suggests the average of approximately 20 independent forecasts is for the UK
economy to contract by just over 9% in 2020 before posting growth of 6.6% in 2021. There is no
consensus around these rates of growth and they range from -12% to -6.6% this year and 1.5% to
10.3% next year. Locally, Danske Bank have taken a view that the economy here will contract by
11% this year and grow by 7% in 2021.
Estimating the impact of Covid-19 is obviously extremely difficult. A body of work from Ulster University’s
Economic Policy Centre (UUEPC) is tracking potential impacts and offering insights into the future path
for the economy. Current thinking is that the economy will take between two and four years to recover
lost ground.
Unpicking the impact of Covid-19, and indeed finding opportunity within it, will be influenced by the
extent to which the rapid changes and disruptions to our working and leisure practices take hold. For
example. The rapid adoption of home working could benefit our borough by attracting new residents
craving an exceptional quality of life. Global supply chain disruptions might also prompt businesses to
seek a more localised supply chain, offering our borough an opportunity to build our industry.
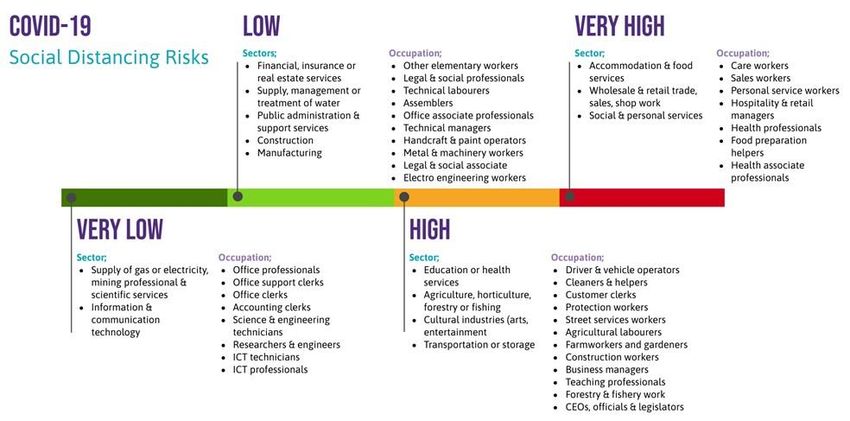
Higher risks across sectors
The economic impacts of Covid-19 will affect sectors and occupations differently due to shifts in demand
and reductions in capacity due to social distancing. The risk profile of sectors and occupations is below.
1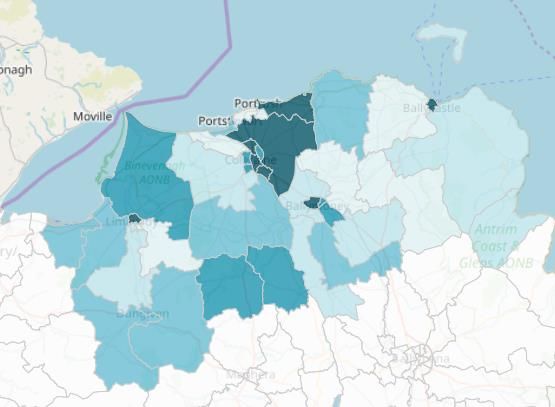
Given our employment structure, where just over two fifths (41.2%) of our employees are employed
within high risk sectors (Retail – 20.4%, Manufacturing – 10.7%, Accommodation and Hospitality –
10.1%) our council area may be impacted harder than most.

1.3 A great challenge, and opportunity
It is within this new operating context that this economic strategy for the Causeway Coast and Glens
area has been developed. This Strategy sets out to understand and evaluate the economic position of
the Causeway Coast & Glens area and give recommendations for the council with a horizon of 2035.
This strategy and action plan will be used by the Council to lead the borough in achieving its full potential
in order to deliver inclusive and sustainable wealth and well-being for its citizens.

Aiding that drive towards the Borough achieving its full potential is the multi-million pounds’ growth deal
that the NI Executive and UK Government have agreed for the borough. This growth deal capital fund
will support a suite of capital projects that allow the borough to raise the level of ambition for the
economy.

The Covid-19 pandemic has highlighted the importance of being able to react at pace to new context.
While this economic strategy and action plan provides a framework for action, and has been developed
through rigorous data analysis and through conversations across the borough, it cannot afford to be
rigid. The Borough’s Economic Advisory Group, made up of a broad range of participants with a role
in the economic life of the borough, will play a crucial role in maintaining the relevance of the actions
taken to support the economic wellbeing of the borough.

                                                                                                           2
2 Causeway Coast and
Glen’s economy

                       3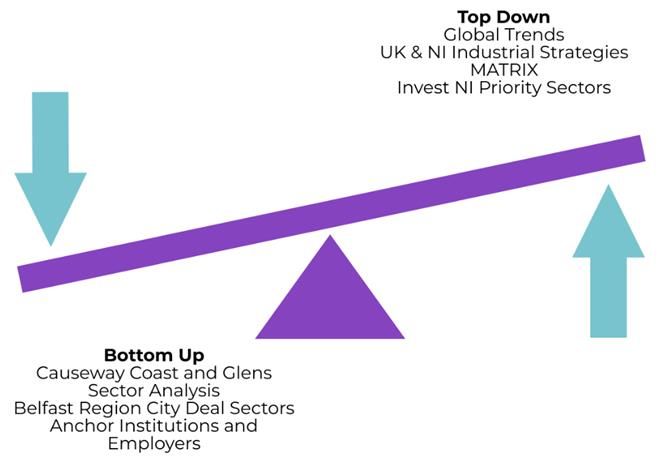
2. Causeway Coast and
   Glen’s economy
2.1 Introduction
Prior to the Covid-19 pandemic, the global economy was posting consistent growth, albeit in the context
of an increasingly uncertain environment. Trade wars and Brexit were looming large as economic
headwinds. There were also fears that consumers, who had driven much of our global economic
performance, were running out of steam.

Closer to home, indicators emphasised a mixed picture. Job creation was continuing to post strong
results and unemployment levels were at historic lows. However, business and consumer sentiment
surveys were showing that the uncertainty around Brexit was weighing on confidence. Although the
Covid-19 pandemic has fundamentally changed our economic perspectives, it is still important to
undertake an assessment of where the economy was so that underlying trends and issues are
recognised in developing actions to support growth.

2.2 Northern Ireland Context
A strong labour market
NI has a current population of approximately 1.9 million, 62.7% of people between the working-age of
16-64. Since the start of the century, NI has seen significant growth within the labour market with
approximately 158,000 net new jobs. The private sector has been the main driver of job creation
accounting for 76.8% of all job growth (119,000 jobs).

The health and social sector, as well as the administrative services sector have seen the largest job
growth, creating 42,000 and 32,800 jobs respectively. The largest decline had come in manufacturing,
which is one of NI biggest private sector employers (10.6% of total employment). This sector suffered
a net loss of 16,900 jobs since 2000. There is a myriad of reasons for this decline, including competition
from cheaper locations and greater adoption of automated processes.

Figure 2.1: Total employment change by sector, NI, Q1 2000-20

Source: Nomis – Workforce Jobs

                                                                                                        4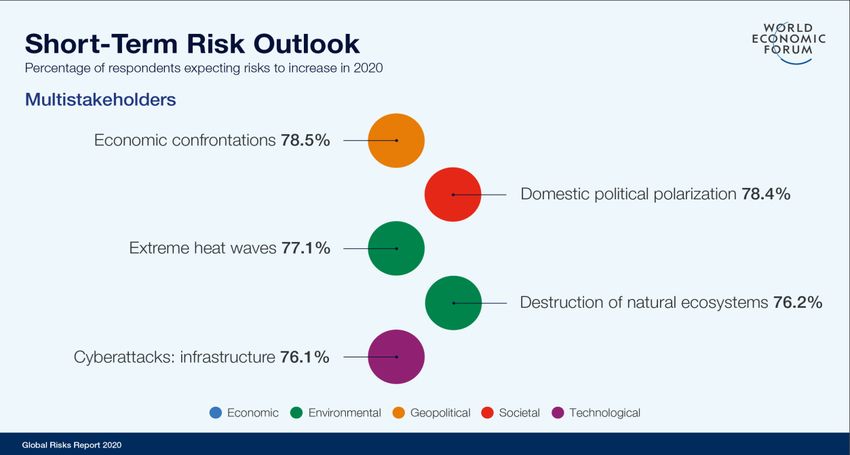
Economic Output Trends
While Northern Ireland’s labour market has been posting strong levels of growth, economic output
growth has been more benign. GVA growth prior to the financial crisis period (2000-08) was averaging
2.1% per annum. The recovery period since 2011 has seen average annual growth of 1.7% per year.

Figure 2.2: Real GVA growth, NI, 2001-18

Source: ONS – Regional Accounts

The official statistics suggest the NI economy was in decline (in real terms) in 2018, which is the latest
available official data. The relatively insipid growth in output, married to the strong growth in
employment serves to highlight an economic challenge that has troubled policy makers across the UK
– the productivity puzzle. There is not a definitive view on why productivity growth has fallen away but
one view suggests that in the context of Brexit uncertainty, it has been easier to invest in recruitment
rather than invest in expensive capital equipment, which would boost productivity.

2.3           The Causeway Coast and Glens Economy
Causeway Coast and Glens Borough Council (CCGBC) covers 760sq miles from Rathlin Island in the
north to the Sperrin Mountains in the south. Its eastern boundary is with Ballymena, while to the west it
borders with Derry~Londonderry. Whilst largely a rural borough, there are a number of established
settlements within the CCGBC area including Coleraine, Ballymoney and Limavady. There are also a
number of popular tourist destinations including Portrush, Portstewart and Bushmills.

                                                                                                        5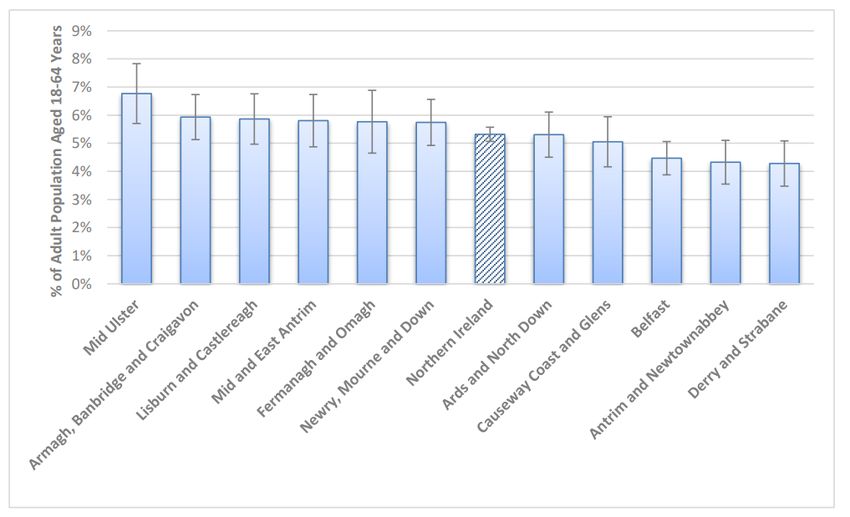
Figure 2.3: Causeway Coast and Glens Borough Council Area

Source: Causeway Coast & Glens Borough Council

This report summarises the socio-economic profile of the area, to include: Demographic Profile;
Health; Social and Environmental Deprivation; Crime; People Environment; Economy and Business
Environment; and Tourism. A benchmarking section is also included, which compares the CCGBC
area performance across a range of key indicators with the other 10 Northern Ireland Councils.

2.3.1         Population Change
Mid-year population estimates for 2019 from the NI Statistics and Research Agency (NISRA) note
CCGBC’s total population as 144,838, 7.6% of Northern Ireland’s population. Between 2001 and 2019,
the population of CCGBC has increased by 13,464 persons, a growth rate of 10.2% which is below the
NI average of 12.1%. Figure 2.4 does however note a slowdown in population growth around 2009,
linked to a marked change in net migration.

Figure 2.4: Population, Causeway Coast & Glens (2001 - 2019)

Source: NISRA Mid-Year Estimates

                                                                                                  6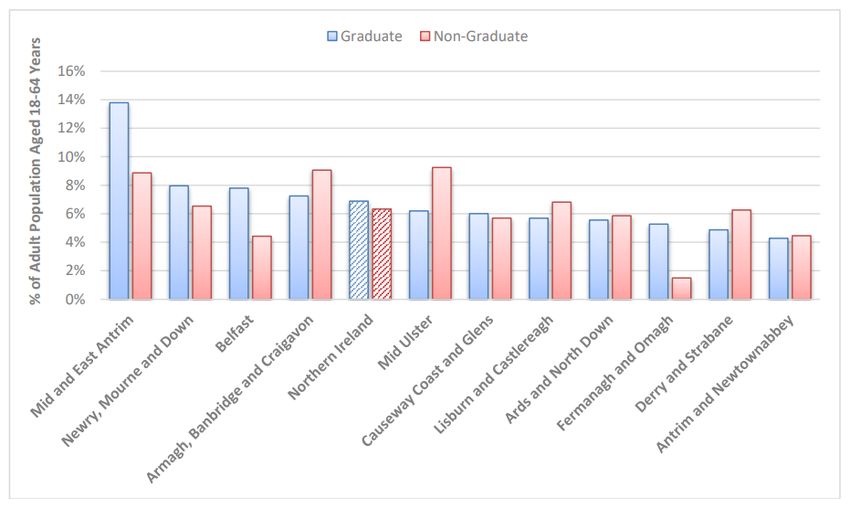
The table below provides a breakdown of the population by age, with 19.6% children, 61.9%
representing the majority of the working age population (16-64) and 18.4% aged 65 years and over.

Table 2.1: Population Estimates by broad age bands, 2019

Age band                                   CCGBC         %              NI             %

Children (0-15 years)                      28,411        19.6%          395,925        20.9%

Young Working Age (16-39 years)            41,778        28.8%          578,542        30.6%

Older Working Age (40-64 years)            47,995        33.1%          604,476        31.9%

Older (65 years+)                          26,654        18.4%          314,724        16.6%
Source: NISRA Mid Year Estimates

Since 2001, there has been a noticeable shift in the local demographic trends. The most noticeable
increase is in the number of 65 plus, with a 55.4% increase versus a 40.4% across Northern Ireland. In
addition, the proportion of those aged 16-39 has decreased by 7.7% compared to 1.1% at a Northern
Ireland wide level. These trends impact on a range of issues including the availability of labour and
consumption patterns within the CCGBC area.

Figure 2.5: Indexed Demography Shifts (2001 - 2019)

Causeway Coast & Glens                                 Northern Ireland

Source: NISRA Mid Year estimates

The slow-down in population growth since the economic downturn corresponds to a marked change in
net-migration. Prior to the recession and downturn in 2009 and 2010, CCGBC benefited from a net
positive inward migration in excess of 270 people per annum in 2007. During and since the recession
this shifted to become a net negative figure, with more people leaving the Borough than becoming
residents.

The decline reached a trough in 2010 with net out migration of c.309. More recently, in 2015 net
migration was positive, however has decreased to a net negative figure below 200 people per annum
between 2016 and 2018, before rising again to c.221 in 2019.

                                                                                                    7
Figure 2.6: Migration flows, Causeway Coast & Glens, 2001 – 2019
Source: NISRA Mid Year estimates
Population forecasts
Insight into future population numbers are a crucial element of service delivery planning. CCGBC’s
projected growth is expected to be stable and relatively benign compared to Northern Ireland as a
whole, with the population in the Borough reaching a peak in 2025 before decreasing. It is estimated
that the CCGBC area’s population will decrease by approximately 2.7% by 2043, to 140,314. Northern
Ireland is forecast to add 5.7% to total population over the same period, reaching approximately
1,989,195.
Table 2.2: Population forecasts (2018 based population projections)
Year CCGBC NI
2020 144,914 1,901,856
2025 145,554 1,937,636
2030 144,983 1,958,990
2035 143,543 1,972,163
2043 140,314 1,989,195
Source: NISRA – 2018 Bases Population Projections
With the general population expected to decrease by 2.7%, the core message is one of a sharply aging
demographic profile. All age cohorts are projected to decline except those in the age 65+ band. This
cohort is projected to increase by 58.1%. When compared to Northern Ireland trends, there will be a
larger fall in the proportion of children and those of working age, likely increasing the average age within
the Borough.
By 2043, the number of children will make up 14.8% of the CCGBC population compared to 29.4% of
the population aged 65 years and over. As a result, the working age population (16-64 years) is
projected to decrease by 29.4% or 13,002 persons from 2018 to 2043.
8These trends will continue to impact the function of the local economy in terms of availability of labour
and consumption patterns.
Table 2.3: Population Change (2018 - 2043)
CCGBC NI
Population change Difference % Diff Difference % Diff
0-15 years -6,085 -21.4% -42,569 -10.8%
16-39 years -7,303 -17.5% -21,814 -3.8%
40-64 years -5,699 -11.9% -1,246 -0.2%
65 years+ 15,155 58.1% 173,183 56.2%
Total Population -3,932 -2.7% 107,554 5.7%
Source: NISRA
2.3.2 Health
The area is served by both the Northern and Western Health and Social Care Trusts, with the key
facilities in the CCGBC area including Causeway Hospital, Roe Valley Hospital and Dalriada Hospital.
According to the health inequalities 2020 report the life expectancy at birth for both females and males
within the CC&G area are above the NI average at 83.1 and 79.3 respectively. The standard of life
within the CC&G area can be seen as relatively high, with all standardised death rates and causes
below the NI average. However, although CC&G as a whole can be seen as an area with a high
standard of life, the inequalities between the overall areas average and those areas within the borough
deemed as deprived is stark.
Admission rates for those who self-harm within the CC&G area was 119 per 100,000 populations,
however when looking at the bottom 20% those areas within the borough, this figure more than doubles
(239). Similarly, the level of suicides within the area per 100,000 of the population during the 2014-18
period was 12.1, which is 24.3% below that of the NI rate, however its Deprivation Gap was 93.5%
above.
While health statistics in the CC&G area are in good health compared to the NI average, there is still a
need for improvements to be made within the most deprived areas which are significantly lower than
that of council average. For example, while health is a key indicator for understanding the current profile
of the population. Another key indicator for overall standards of living is that of wellbeing which indicates
an individual’s response on overall life satisfaction, worthwhileness, happiness and anxiety levels.
2.3.3 Wellbeing
Causeway coast and Glens borough council as a whole can be deemed as a place with a relatively high
standard of living when looking at its wellbeing statistics. On average the council ranks above the NI
average in all indicators, ranking second highest in life satisfaction of all 11 Local Government Districts
(LGDs). It’s resident’s levels of worthwhileness and happiness also pose a high ranking (4 th), while the
councils levels of anxiety (although still relatively low) however rank quite high in 8th. These results
generate an interesting question in terms of how residents can be seen to have high levels of life
satisfaction, worthwhileness and happiness, however yet still anxious and the possible reasons as to
why will be further analyses throughout this report.
Table 2.4: Wellbeing Statistics, LGDs, 2018/19
Life
Satisfaction Worthwhileness Happiness Anxiety levels
9Antrim and Newtownabbey 7.7 8.0 7.6 2.8
Ards and North Down 7.9 8.1 7.7 2.6
Armagh City, Banbridge and
Craigavon 8.0 8.2 7.7 2.7
Belfast 7.6 7.6 7.3 3.3
Causeway Coast and Glens 8.1 8.3 7.8 2.8
Derry City and Strabane 7.7 8.0 7.7 3.4
Fermanagh and Omagh 8.2 8.3 8.2 2.3
Lisburn and Castlereagh 8.0 8.1 7.9 2.6
Mid and East Antrim 8.0 8.4 7.8 2.6
Mid Ulster 8.0 8.1 7.8 2.7
Newry, Mourne and Down 8.1 8.3 7.9 2.7
Northern Ireland 7.9 8.1 7.7 2.8
Source: ONS – Wellbeing indicators
Note: Questions asked – Overall, how satisfied are you with your life nowadays? Where 0 is ‘not at all satisfied’ and 10 is
‘completely satisfied’ ~ Overall, to what extent do you feel the things you do in your life are worthwhile? Where 0 is ‘not at all
worthwhile’ and 10 is ‘completely worthwhile’ ~ Overall, how happy did you feel yesterday? Where 0 is ‘not happy at all’ and 10
is ‘completely happy’ ~ Overall, how anxious did you feel yesterday? Where 0 is ‘not at all anxious’ and 10 is ‘completely
anxious’
2.3.4 Social and Environmental Deprivation
Northern Ireland is split into 890 spatial areas known as Super Output Areas (SOAs), with an average
population of around 2,100 people. There are 72 SOAs in CCGBC, representing 8% of the total SOAs
in NI. These 72 SOAs range in population size from 1,121 to 2,930 people with an average size of 1,994
persons (according to the mid-2016 estimates).
The Northern Ireland Multiple Deprivation Measure (NIMDM) 2017 provides information on 7 types of
deprivation and an overall measure of multiple deprivation (MDM), where each of the SOA are ranked,
from 1 (most deprived) to 890 (least deprived).
Only the Ballysally_1 ward in Coleraine and the Coolessan ward in Limavady fall within the top 10% of
the most deprived wards in Northern Ireland, reflecting its neighbourhood renewal area status. In terms
of other specific areas of deprivation across the Borough, there are pockets of income and proximity to
services deprivation with:
• 12 of the 72 SOA’s have been identified as deprived in terms of income; and 2 mainly rural
SOA’s are identified as being deprived in relation to access to services.
10Table 2.5: Deprivation Summary
Year - 2017 Rank of most Number of wards Wards in 10% most
deprived ward in within 10% most deprived
CCGBC deprived
Multiple deprivation 31 2 Ballysally_1; Coolessan
Income deprivation 6 12 Armoy and Moss-Side and
Moyarget; Ballylough and
Bushmills; Ballysally_1;
Carnmoon and
Dunseverick; Central;
Coolessan; Dungiven;
Feeny; Garvagh;
Glentaisie and Kinbane;
Royal Portrush; The
Highlands
Employment deprivation 23 2 Ballysally_1; Coolessan
Health Deprivation and 48 1 Coolessan
Disability deprivation
Education, Skills and Training 67 1 Coolessan
deprivation
Access to Services 12 12 Aghanloo_2; Armoy and
deprivation Moss-Side and Moyarget;
Ballyhoe and Corkey;
Carnmoon and
Dunseverick; Dunloy;
Glack; Glenaan and
Glendun; Knockaholet;
Magilligan; Ringsend; The
Highlands; The Vow
Living Environment 62 2 Dundooan_1; Knockaholet
deprivation
Crime and Disorder 18 7 Atlantic; Central;
deprivation Coolessan; Greystone;
Portstewart; Roeside;
Royal Portrush
Source: Multiple Deprivation Index 2017
Note: Ranking of 1 being most deprived; 890 least deprived
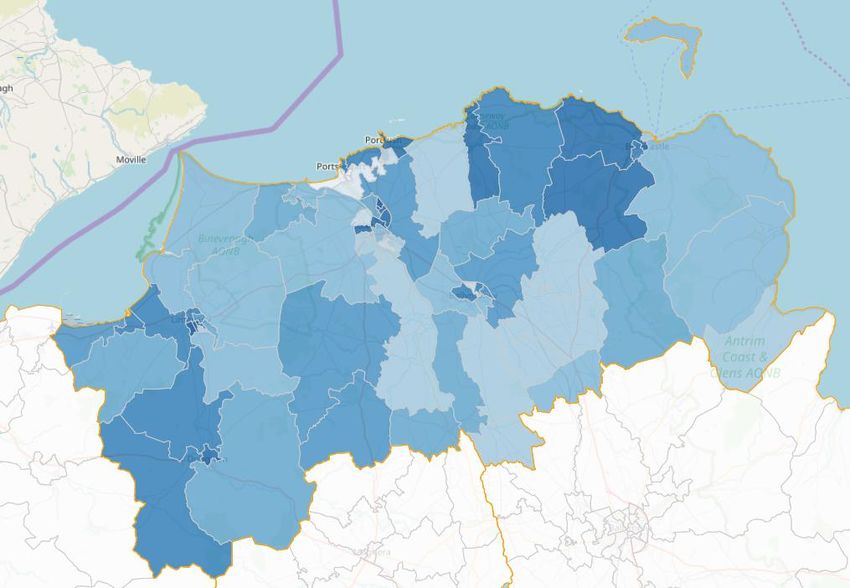
Figure 2.7 below shows the location of the deprived wards across the Borough. The most deprived
wards are primarily concentrated around the main settlements of Coleraine, Limavady and the area
around Ballycastle.
11Figure 2.7: Concentration of Deprivation in Causeway Coast & Glens, 2017
Source: NINIS
2.3.5 Crime
In 2018/19, a total of 6,098 criminal offences were recorded in the CCGBC area, equating to an overall
recorded crime rate of 42 per 1,000 persons. This was lower than the overall Northern Ireland rate of
54 per 1,000 persons.
Anti-social behaviour accounts for the largest proportion of crime in the CCGBC – a rate of 24 per 1,000
persons.
Figure 2.8: Crimes per 1,000 people, 2018/19
Source: PSNI
122.3.6 GVA, productivity and exports
In 2018, the CCGBC area contributed nearly £2.1bn to the Northern Ireland economy, representing
5.2% of the NI’s Gross Value Added (GVA) of £40.1bn. Prior to 2007, the economy in CCGBC tracked
in line with NI’s, with GVA increasing by 14.0% between 2000 and 2006. Since 2007, there has been a
divergence between the NI economy and the CCGBC area. Between 2008 and 2012 during the
recession, the CCGBC economy grew by 1.7% while the NI economy shrunk by 1.9%. Post the
recession, CCGBC’s growth of 5.8% has tracked behind NI’s growth of 9.3% between 2013 and 2018.
However, the NI economy began to reach pre- recession output levels in 2015, while the CCGBC only
reached 2007 levels in 2017.
Figure 2.9: Indexed Real GVA growth CCGBC v NI
Source: Office for National Statistics
In terms of productivity, CCGBC is below the Northern Ireland average. In 2018, GVA per employee
was lower than the NI average (£41,600 v £45,500) and lower in terms of GDP per capita (£14,500 v
£21,300). Since 2001 per employee at a CCGBC, level has largely tracked behind NI, despite some
convergence and re-divergence during the period (Figure 4.3). In relation to GVA per capita, a key
indicator of prosperity, CCGBC has consistently under performed in comparison to NI.
Figure 2.10: Real Productivity, Causeway Coast & Glens v Northern Ireland, 2018
Source: ONS & BRES
13Figure 2.11: Productivity trends 2001-2018 Causeway Coast & Glens v Northern Ireland
Source: ONS & BRES
The NI Economic Strategy notes that export led growth is a key driver, citing a need to both grow exports
and diversify into new markets. Reflecting this, Invest NI have been opening a range of new international
offices in locations such as Toronto, Santiago, Singapore, Hong Kong, Qatar, Madrid, Australia and
South Africa aimed at developing new trade links.
Latest statistics suggest that Northern Ireland companies sell £24bn of goods and services, of which
CCGBC contributed £1bn, outside Northern Ireland (inc. to the rest of the United Kingdom). Having
posted growth in exports in 2012 and 2013, exports declined between 2013 and 2015. Since 2015,
exports in Northern Ireland have increased by 18%. The value of exports in CCGBC increased by 95%
in the period between 2015 and 2018 to £600m.
The major markets that Northern Ireland exports serve are presented in Table 4.1. Key markets for
Northern Ireland’s exports are the Republic of Ireland (33%), US & Canada (19%), Asia (9%) and
Germany (5%). It is not possible to source detailed trade statistics for the value of exports to each
country at local Council level, however for those that statistics are available CCGBC exported £256m
to the Republic of Ireland, £242m to the rest of the EU and £105m to the rest of the World.
14Table 2.6: Key Northern Ireland export markets 2018
Country Share of total exports 2018
Republic of Ireland 37%
North America 19%
Asia 9%
Germany 5%
Netherlands 4%
Middle East 4%
France 3%
Belgium 3%
Australia 2%
Switzerland 2%
Other markets 12%
Source: Department of the Economy – Northern Ireland Broad Economy Sales & Exports Data
152.3.7 Registered companies
In 2020 there were a total of 6,015 registered companies in the CCGBC area, an increase of 4.4% from
2017 (5,760 registered companies). CCGBC ranks in the middle (7th) of NI’s Councils for the number of
VAT and PAYE registered businesses, accounting for 7.9% of NI total. Table 4.2 shows that Causeway
Coast & Glens ranks above the NI average in terms of number of businesses per capita. Conversely
CCGBC ranks 8th in terms of average business size, with 5.9 employees per businesses. This
compares to 7.7 across Northern Ireland.
Table 2.7: Number of VAT and/or PAYE registered businesses operating in NI by LGD, 2020,
ranked by businesses per capita
Number of
No. of businesses per
District Council Area
registered Avg business 1,000
companies % size population
Fermanagh and Omagh 8,175 10.7% 4.5 69.6
Mid Ulster 9,035 11.9% 6.0 60.8
Newry, Mourne and Down 8,865 11.7% 6.1 48.9
Causeway Coast and Glens 6,015 7.9% 6.1 41.5
Armagh City, Banbridge and
Craigavon 8,725 11.5% 6.8 40.4
Northern Ireland 76,090 100.0% 7.8 40.4
Mid and East Antrim 4,955 6.5% 6.4 35.6
Derry City and Strabane 5,320 7.0% 7.5 35.2
Lisburn and Castlereagh 5,010 6.6% 8.8 34.3
Belfast 11,065 14.5% 14.5 32.2
Antrim and Newtownabbey 4,190 5.5% 9.3 29.2
Ards and North Down 4,740 6.2% 7.4 29.3
Source: Inter Departmental Business Register
162.3.8 Business size
The CCGBC area has a similar business demographic to the rest of NI. It is a SME driven economy,
with 91.5% of businesses under 10 employees in 2019, but has a higher proportion of SME’s than the
Northern Ireland average. CCGBC has 35 firms with over 100 employees, representing 0.6% of total
firms in the Borough, compared to 1.1% across Northern Ireland.
Table 2.8: Business demography – Companies by size (employees), 2020
CCGBC NI
Companies by size (employees) Number % %
0 2,340 38.9% 31.5%
1-9 3,160 52.5% 57.8%
10-19 265 4.4% 5.3%
20-49 155 2.6% 3.2%
50-99 55 0.9% 1.1%
100-199 20 0.3% 0.5%
200-249 5 0.1% 0.1%
250+ 15 0.2% 0.4%
Total 6,015 - -
Source: Inter Departmental Business Register
In respect of company size by turnover, the demographic profile of companies in CCGBC is similar to
that overall in NI. The percentage of companies with turnover less than £50,000 in CCGBC is marginally
higher (2 percentage points) than the NI average. Conversely the percentage of companies with
turnover greater than £500,000 is 3 percentage points lower than the NI average.
17Table 2.9: Business demography – Companies by size (turnover), 2020
CCGBC NI
Turnover Size Band (£ thousands) Number % %
0 - 49 1,565 26% 25%
50 - 99 1,070 18% 18%
100 - 249 1,615 27% 26%
250 - 499 785 13% 12%
500 - 999 475 8% 8%
1,000 - 4,999 395 7% 8%
5,000 + 110 2% 3%
Total 6,015 - -
Source: Inter Departmental Business Register
2.3.9 Invest NI client companies
Invest NI provides support to help businesses across Causeway Coast & Glens create jobs, innovate
and grow exports. The sectoral mix of supported companies is presented in Figure 4.4 and shows a
significant weighting towards manufacturing (53% of the total).
Figure 2.12: Invest NI Supported Companies in CCGBC, 2019
Source: Invest NI / Open Data NI
Over the past 5 years Invest NI has allocated £14.9m to businesses in the CCGBC area, representing
only 2.8% of Invest NI total investment across NI. The biggest investors over this time have been
McAuley Precision Limited, J. F. & H. Dowds Limited, LacPatrick Dairies (NI) Limited, Woodland
Kitchens (N.I.) Limited and WD Meats. Almost half of the support offered by Invest NI has been
allocated to jobs.
18Figure 2.13: Invest NI, type of assistance offered, CCGBC, 2018/19
Source: Invest NI / Open Data NI
To provide context to the Invest NI support the total support offered has been calculated on a ‘per
business’ basis. While this measure does not take account of nuances in the concentrated of
SME/micro businesses or location of larger businesses (which are more likely to be Invest NI clients),
it does provide a useful benchmark. At just over £2,000 support on a per company basis, CCGBC area
ranks 10th out of the 11 NI Councils for the amount received and considerably below the NI average of
£7,000.
Figure 2.14: Assistance offered by Invest NI by Council area and per business (£)
Source: Invest NI / Open Data NI
2.3.10 Total Early-Stage Entrepreneurial Activity
The preceding analysis on business demography points towards a Borough that is more entrepreneurial
than other Council areas (i.e. a higher concentration of SME’s). The most widely accepted indicator for
Entrepreneurship is the Global Entrepreneurship Monitor’s Total Early-Stage Entrepreneurial Activity
(TEA), which assess the percentage of working age population both about to start a business or venture
and that have started one within the last three and a half years.
Figure 6.1 below plots the average TEA by Council area from 2003 to 2018, the purpose of which is to
average out any random annual fluctuations. TEA in Northern Ireland falls significantly behind UK levels
and CCGBC ranked 4th lowest of all the Northern Ireland councils for TEA over the period from 2003 to
192018, with a figure of c. 5% and below the Northern Ireland average. This suggests there is a relatively
low appetite for entrepreneurship in the Borough.
Figure 2.15: TEA in Northern Ireland in 2003-2018 by Council Area, with 95% confidence intervals
Source: Global Entrepreneurship Monitor Northern Ireland Report 2018
When considering graduate and non-graduate performance, CCGBC ranks in the middle (i.e. 6th) of all
the Northern Ireland Council areas. This is driven by Graduate levels of circa 6.0%, ranking 6th out of
the 11 Council areas. Non-Graduate performance comparable to the other Councils ranks 8th out of the
11 Council areas, however unlike other Councils there is not a significant variance between the
percentage of TEA by graduates and non-graduates.
Figure 2.16: TEA in Northern Ireland by Graduate Status and Council Area, combined over 2016-
2018
Source: Global Entrepreneurship Monitor Northern Ireland Report 2018
202.3.11 Economic activity
In 2018, 70.7% of those aged 16-64 living in CCGBC were economically active and 29.3% were
economically inactive. This compares with 72.8% economically active and 27.2% economically inactive
for NI.
The long tail of the recession impacted economic activity levels in CCGBC between 2011 and 2013,
with economic activity decreasing from 71.1% to 65.4%, while NI wide levels remained fairly constant.
However, since 2013, activity has increased by five percentage points, compared to a 0.3% increase
across NI.
Figure 2.17: Economic activity (% of working age population), 2011 – 2018
Source: NISRA
2.3.12 Claimant count
The average number of people aged 16-64 in CCGBC claiming Job Seekers Allowance (JSA) in 2019
was 2,695 representing a claimant count annual average rate of 3.0%. This compares with a claimant
count rate for NI of 2.5% in 2019.
The youth claimant count rate (aged 18-24) in 2018 was 4.4% in CCGBC and is higher than that of NI
overall (3.7%). The proportion of total claimants who were long term unemployed in 2017 is also higher
in CCGBC at 41.3% when compared to that of NI overall (32.8%).
CCGBC follows the same general trend line as NI (Figure 7.2), albeit at a marginally higher level. The
impact of recession from 2009 can be seen in the increasing levels of unemployment and claimant
count, reaching a peak of 5.6% in 2012 and 2013 (NI: 5.4%). Since 2013, the claimant count steadily
decreased to its minimum position in 2017 of 2.8% (NI: 2.6%). The minimum claimant count in NI in the
same period was 2.4% in 2018. Claimant count has begun to increase in recent years to its current
level of 3.0%, compared to 2.5% in NI overall.
21Figure 2.18: Total claimants (as % of working age population), 2009-2019
Source: NISRA
2.3.13 Employment rates
In 2018, the 16-64 employment rate in CCGBC was 66.8%. This is lower than the overall 16-64
employment rate for Northern Ireland which was 70.0%. The employment rate in 2018 in both CCGBC
and NI is the peak for the period reviewed. Employment rates in the Borough have fluctuated each year;
whilst in NI overall there has been a general trend of growth in the employment rate.
Figure 2.19: Employment rate (% of working age population), 2011 – 2018
Source: NISRA
In terms of numbers of residents employed, this reached 57,000 in 2018, which is still down on the peak
of 65,000 in 2011. Causeway Coast & Glens under performs in Northern Ireland in terms of employment
and showed less resilience during the long tail of the recession, which began, to impact between 2011
and 2015. In 2018 employment levels in the Borough are nearly seven percentage points lower than
the Northern Ireland average.
222.3.14 Earnings profile
At April 2019, the gross full-time median weekly wage in Causeway Coast & Glens was £448 compared
with £535 for NI, 19% lower.
Table 2.10: Median weekly wage by place of work, April 2019
Year CCGBC (£) NI (£) % difference
All 377 429 -14%
Full-time 448 535 -19%
Part-time 188 196 -4%
Source: NISRA
Since 2013, real median wages have been increasing across Northern Ireland and CCGBC. Despite
this growth in wages, CCGBC still lags behind the overall average in Northern Ireland in 2019 by 14
percentage points.
Figure 2.20: Median real gross weekly wage trends 2013 to 2019, CCGBC v NI (2019 prices)
Source: NISRA
With gross weekly wages currently close to £377, CCGBC ranks as the second lowest Borough in terms
of the highest average wages of all NI council areas. Only Ards and North Down ranks lower.
Figure 2.21: Average gross weekly wage by Local Council, 2019
Source: NISRA
232.3.15 Employment profile
The number of employee jobs in the Borough in 2018 is c.1,750 above the level of 40,000 jobs in 2012.
This is in line with the growth in employment rate in the Borough from 2012 to 2018 set out at Figure
2.22. Encouragingly, the downturn in employee jobs in the long-tail of the recession has reversed with
growth now well established.
Figure 2.22: Employee jobs in CCGBC, 2012 – 2018
Source: NISRA
The pace of employee job growth between 2016 and 2018 in Causeway Coast & Glens is one of the
highest in Northern Ireland at 6.3% with only Mid Ulster having faster growth. In the same period,
Northern Ireland’s employee growth was 4.3%.
Table 2.11: Employee jobs 2016-2018, ranked by percentage change 2016-2018
Local Government District 2016 2017 2018 % change
2016-2018
Mid Ulster 52,372 54,256 56,963 8.8%
Causeway Coast and Glens 39,250 40,556 41,733 6.3%
Derry City and Strabane 54,986 55,821 58,196 5.8%
Lisburn and Castlereagh 54,734 56,027 57,888 5.8%
Newry, Mourne and Down 54,668 56,084 57,618 5.4%
Armagh City, Banbridge and 72,866 73,868 76,684 5.2%
Craigavon
Fermanagh and Omagh 39,837 41,764 41,860 5.1%
Northern Ireland 728,116 744,456 759,359 4.3%
Ards and North Down 37,898 38,746 39,294 3.7%
Belfast 218,478 224,098 226,045 3.5%
Mid and East Antrim 42,839 43,490 43,949 2.6%
Antrim and Newtownabbey 60,188 59,747 59,129 -1.8%
Source: NISRA
242.3.16 Employee jobs – Sub regional trends
Employment within the Borough is primarily clustered around the main settlements. Employment can
be grouped into four broad areas.
Table 2.12: Employment clusters in CCGBC
Local Government District 2016 2017 2018 % change
2016-2018
Mid Ulster 52,372 54,256 56,963 8.8%
Causeway Coast and Glens 39,250 40,556 41,733 6.3%
Derry City and Strabane 54,986 55,821 58,196 5.8%
Lisburn and Castlereagh 54,734 56,027 57,888 5.8%
Newry, Mourne and Down 54,668 56,084 57,618 5.4%
Armagh City, Banbridge and 72,866 73,868 76,684 5.2%
Craigavon
Fermanagh and Omagh 39,837 41,764 41,860 5.1%
Northern Ireland 728,116 744,456 759,359 4.3%
Ards and North Down 37,898 38,746 39,294 3.7%
Belfast 218,478 224,098 226,045 3.5%
Mid and East Antrim 42,839 43,490 43,949 2.6%
Antrim and Newtownabbey 60,188 59,747 59,129 -1.8%
Source: NISRA
There is a broad split of employment across the CCGBC area. 54.8% of all employment, 21,557 jobs
are located in the Coleraine area. Almost a fifth (19.4%) are located in the Limavady area, a total of
7,640 jobs. The remaining jobs are spread between Ballymoney (6,766, 17.2%) and Moyle (3,372,
8.6%). With over 90% of employment, the wider Ballymoney, Coleraine and Limavady areas are the
primary employment hubs in the regions.
25Figure 2.23: Employee jobs by Ward (2013)
Source: NINIS
2.3.17 Travel to work data
The 2011 census highlighted that 12,393 people left the CCGBC area to their usual place of work and
4,710 entered the Borough from other areas, with a net impact of 7,683 leaving the Borough.
The majority of residents travel by car as a driver (60.0%) or as a passenger (10.9%). A small
percentage of residents use public transport, with only 1.8% using the bus and 1.0% using the train.
Almost 7% walk to work with a further 12% working from home.
Figure 2.24: Travel to work methods
Source: Census 2011
262.3.18 Sectoral composition
This section provides a high level overview of sectoral structure. The sectoral composition in CCGBC
includes: Agriculture (32.6%), Production (16.5%), Construction (8.2%) and Services (42.7%).
Table 2.13: Companies by Sector (2019)
Northern
Industry CCGBC Ireland
Industry Number % %
Agriculture, forestry & fishing 1,980 32.6% 24.5%
Production 1,005 16.5% 13.9%
Construction 500 8.2% 8.0%
Motor trades 380 6.3% 5.5%
Wholesale 340 5.6% 6.9%
Retail 300 4.9% 6.1%
Transport & storage (inc. postal) 295 4.9% 8.0%
Accommodation & food services 220 3.6% 3.5%
Information & communication 205 3.4% 4.3%
Finance & insurance 185 3.0% 3.6%
Property 175 2.9% 3.7%
Professional, scientific & technical 165 2.7% 3.3%
Business administration and support services 150 2.5% 3.2%
Public administration and defence 75 1.2% 2.7%
Education 55 0.9% 1.7%
Health 45 0.7% 0.9%
Arts, entertainment, recreation and other
services 0 0.0% 0.1%
Total 6,075
Source: Inter Departmental Business Register
272.3.19 Employment structure
In terms of employment by sector, Wholesale and Retail Trade; Repair of Motor Vehicles and
Motorcycles (20.6%) is the largest in the CCGBC area, followed by Human Health and Social Work
Activities (17.9%) and Education (11.1%). Approximately 25% of employment in CCGBC is in the public
sector.
Figure 2.25: Employment by Sector, CCGBC 2018
Source: NISRA, Business Register and Employment Survey
The most dominant sector in CCGBC when compared to Northern Ireland is Accommodation & Food,
followed by Wholesale & Retail and Construction. In contrast, CCGBC has a lower concentration of
Administrative Services, Information & Communication Services and Professional & Scientific Services
than the Northern Ireland average.
Figure 2.26: Relative employment structure – CCGBC Vs Northern Ireland
Source: NISRA, Business Register and Employment Survey
282.3.20 Rural economy
The nature of the sectoral employee statistics is such that they typically underestimate the scale of the
Agriculture sector. The Agricultural Census from DAERA provides more insight into the agriculture
sector across the Borough. With over 144,006 hectares farmed in the area in 2019 the region has 3,258
farms, representing 10.6% of the Northern Ireland total. There is a concentration of large farms, with
14.6% of all the large farms in Northern Ireland in the CCGBC area. Farm output in 2017 is estimated
to be higher in the CCGBC area, with standard output (SO) 16.7% higher than the Northern Ireland
average. A proliferation of small farms may suggest limited opportunities for additional employment
potential.
Table 2.14: Rural economy indicators
Indicator Number % of Northern Ireland
total
Number of farms 2,502 10.1%
Area farmed in hectares 144,006 14.1%
SO per farm (€’000) in 2017 91.00 116.7%
Farmers 3,258 10.6%
Large farms 245 14.6%
Source: DAERA Agricultural Census 2019
The majority of land in the CCGBC area is used for grazing rather than crops, with only 5.7% of farmland
used for crops compared to 4.4% in Northern Ireland. Sheep farming is the dominant farming category,
with almost 400,000 sheep farmed in 2019, 20.0% of the Northern Ireland, reflecting the extent of high
land and rough grazing in the borough.
Table 2.15: Animals farmed in CCGBC
Indicator Number (2019) % of Northern Ireland
total
Cattle 184,020 11.4%
Sheep 396,514 20.0%
Pigs 23,319 3.5%
Poultry 2,445,242 9.9%
Source: DAERA Agricultural Census 2019
The wider rural economy plays a significant direct role in the CCGBC economy, with a wider impact
through local supply chain. The major challenge facing the rural economy is Brexit, with multiple
implications through potential losses of subsidies, to impacts on labour availability and potential tariffs
on exports, depending on the terms of the future economic relationship with the EU.
292.3.21 Qualifications
The most comprehensive assessment (in terms of sample sizes) of skills of residents in the Borough is
the 2011 Census. This showed a Borough where close to one in four working age residents did not
have any formal qualifications and close one in four holding level 4 (i.e. degree level). For context, the
proportion qualified to level four was three percentage points lower than the NI average of 26%. In
addition, the proportion aged 16-64 with 'no qualifications' was 3% higher than the NI average of 21%.
There is a lower skilled labour force than the NI average.
Figure 2.27: Qualifications (16-64 years), Causeway Coast & Glens, 2011
Source: Census 2011
The Labour Force Survey Local Area Database does provide more up to date figures for local skills,
albeit with a reduced sample. It records that the number of working age people with no qualifications
in 2018 has decreased to 20%, considerably worse than the NI average of 15% and is the lowest ranked
Council in the context of NI’s Council areas. At the other end of the skills spectrum, it is a slightly better
relative position for Causeway Coast & Glens. The number of working age people reported as holding
level 4 or above qualifications is 34%, a figure which is more broadly aligned with the NI average of
35% and better than five of the other Council areas.
30Figure 2.28: % 16-64 with no formal qualifications, NI Regions, 2018
Source: Labour Force Survey, Local Area Database
Figure 2.29: % 16-64 with 4+ qualifications, NI Regions, 2018
Source: Labour Force Survey, Local Area Database
2.3.22 Skills pipeline: School leaver attainment
In 2018 49% of school levers in CCGBC left with 2 or more A Levels grades A-E (eight percentage
points lower than NI average of 57%); 88% left with 5 or more GCSE’s grades A-C (three percentage
points higher than the NI average of 85%) and 71% left with 5 or more GCSE’s grades A-C including
English and Maths (in line with the NI average of 71%). While attainment levels of students achieving
5 or more GCSE’s have largely improved across both CCGBC and Northern Ireland, the percentage of
school leavers with 2 or more A Levels grades A-E decreased in 2018 relative to 2016 in CCGBC. This
was consistent with the trend in Northern Ireland as a whole.
While CCGBC has ranked in the top half of school leavers attaining 5 or more GCSE’s grades A-C, the
Borough has ranked in the bottom half of all council areas relating to school leavers attaining 2 or more
A Levels grades A-E and school leavers attaining 5 or more GCSE’s grades A-C including English and
Maths.
31Figure 2.30: Educational Attainment by School Leaver
Causeway Coast & Glens Northern Ireland
Source: Education NI
The figure below presents the destination of school leavers within CCGBC, highlighting that 81%
progress to Higher and Further Education.
Although, the proportion of local school leavers entering higher education (38.1%) fell below the
Northern Ireland average (43.1%). The share of school leavers in CCGBC entering further education
(42.9%) was above the NI average (33.5%).
Figure 2.31: Destination of school leavers, Causeway Coast & Glens, 2017/18
Source: Education NI
322.3.23 Visitor attractions
With a growing NI wide tourism offer and active policy and marketing focus, there is a significant
potential for Causeway Coast & Glens to benefit from improving the local tourism offer. A selection of
the visitor attractions in CCGBC as listed by Visit Causeway Coast and Glens are:
• Ballintoy Harbour
• Barry’s Amusements
• Benone Complex & Strand
• Binevenagh Nature Reserve
• Bushmills Distillery
• Carrick-a-Rede Rope Bridge
• Dunluce Castle
• Giant’s Causeway
• Kinbane Castle
• Mussenden Temple
• Rathlin Island
• Royal Portrush Golf Club
• The Dark Hedges
This list shows a predominance in coastal attractions. However, within existing designations such as
the AONBs there are a range of attractions and stop off points. There remains an opportunity to develop
these non-coastal sites and bring some balance between coast and countryside.
In 2018, there was a total of 2,538,877 visits to visitor attractions in CCGBC. The most popular visitor
attractions were: Giant’s Causeway World Heritage Site (1,039,243) - representing a 38% increase on
the level from 2013 – and ranked 1st in Northern Ireland by visitor numbers; followed by Carrick-a-Rede
Rope Bridge (491,947) – ranked the 4th in Northern Ireland by visitor numbers; and Roe Valley Country
Park (310,000).
2.3.24 Availability of Accommodation
In 2018, there were 14,239 beds available in CCGBC, accounting for 28% of all beds available in
Northern Ireland. Between 2013 and 2015, certified accommodation stock in CCGBC decreased to a
minimum level of 9,921 beds. The number of beds has increased each year from 2016, with a large
increase of 3,229 beds in 2018. Stock across NI declined between 2013 and 2015 has rose sharply
each year between 2016 and 2018, following a similar trend to that of CCGBC.
33Figure 2.32: Indexed changes in certified accommodation stocks, 2013 - 2018, CCGBC v NI
Source: NISRA
2.3.25 Trips
Between 2013 and 2018 the total number of trips to CCGBC area increased by 44%, while the NI wide
number of trips increased by 22%. This trend in CCGBC was driven by sharp increases in 2015 and
2017, with subsequent decreases in both 2016 and 2018.
Figure 2.33: Indexed changes in trips, 2013 – 2018, CCGBC v NI
Source: Local Government District Tourism Statistics
2.3.26 Nights
The number of visitor nights in CCGBC has followed a similar trend as the number of trips, increasing
between 2013 and 2015 and in 2017, with decreasing visitor nights in both 2016 and 2018. In 2018 total
visitor nights in CCGBC were 3,177,569, which is circa 850,000 more than in 2013.
34Figure 2.34: Indexed changes in visitor nights, 2013 – 2018, CCGBC v NI
Source: Local Government District Tourism Statistics
2.3.27 Spend
Between 2013 and 2018, visitor spend in the Borough has increased by 59% to £172m. The peak in
this period was in 2017, when visitor spend was £194m. CCGBC compares well in comparison to
Northern Ireland as a whole, with visitor spend increasing by 35% for the same period.
Figure 2.35: Indexed changes in visitor spend, 2013 – 2018, CCGBC v NI
Source: Local Government District Tourism Statistics
2.3.28 Tourism Employment
In 2017, employment associated with the tourism industry in the Borough amounted to 5,006 jobs, which
accounts for 8% of the Northern Ireland total. This includes jobs in the following areas: accommodation
for visitors; food, beverage serving activities; transport; and sporting and recreational activities.
352.4 CCGBC v Other Northern Ireland Councils
In order to assess how CCGBC is performing, a benchmarking exercise across a range of indicators
has been undertaken. This exercise focused on CCGBC’s performance when compared to the other
10 Northern Ireland Council areas, assessing against 24 unique indicators.
CCGBC scores poorly in relation to the percentage of young people, average business size,
employment levels (16-64), GCSE and A-Level attainment, employee jobs per capita, median wage,
population forecasts, population growth and no formal qualification.
When compared to other Northern Ireland Councils, CCGBC ranks Excellent in 2/24 indicators, Good
in 7/24 indicators, Moderate in 6/24 indicators and Poorly in 9/24 indicators. CCGBC does not rank first
in any indicator, however does rank second in relation to visitor nights and visitor trips and spend,
behind only Belfast in each of these indicators.
These rankings suggest a number of things about the Borough. It has an ageing demographic,
comparably lower education levels to other Councils and a higher proportion of smaller businesses
which do not pay as well. While the relationship between these is unclear, it is likely there is a correlation
between having smaller businesses, who pay less, and employment and economic activity levels.
36Table 2.16: CCGBC benchmark v Northern Ireland Councils
Ranking Indicator
Excellent (Ranks 1-2) - Visitor nights
- Visitor trips and spend
Good (Ranks 3-5) - % over 65 population
- Crime levels
- Number of £100k plus businesses
- Number of businesses per capita
- Employment deprivation
- Farm output
- Income deprivation
Moderate (Ranks 6-8) - Above NVQ level 4 qualifications
- Number of small businesses (less
than 50 employees)
- TEA levels
- % working age population
- Economic activity (16-64)
- Population size
Poorly (Ranks 9-11) - % of young people
- Average business size
- Employment levels (16-64)
- GCSE and A-Level attainment
- Employee jobs per capita
- Median wage
- Population forecasts
- Population growth
- No formal qualifications
Source: Grant Thornton analysis
373 Identifying growth
opportunity sectors
383. Identifying growth
opportunity sectors
3.1 Introduction
This section assesses the potential priority sectors for Causeway Coast and Glens (CCGBC).
Identifying sectors in the CCGBC area requires a holistic look at the local, regional and national
economies, considering sectors of advantage at each of these levels and the role of these sectors within
the borough, now and in the future. As many local businesses operate and are impacted by the global
economy, identifying sectors of advantage must consider global trends. The current global landscape
is fast moving, with technology changing the way business and consumers function. Increasingly there
is convergence between sectors, again with technology playing a key role in blurring the lines between
sectors.
This analysis takes a top down and bottom up approach to identify sectors of advantage within the
CCGBC area. Figure 3.1 below presents an overview of this approach which includes a top down review
of key global economic trends and strategic sectors at a UK and NI level and the bottom up analysis of
the sectors at CCGBC borough level.
Figure 3.1 Overview of approach
39This approach will identify a long list of sectors in which CCGBC have a strength or competitive
advantage. The long-list of sectors will be categorised into the following segments.
Focus and Step Challenge: These are ‘critical for growth’ sectors which are considered likely to have
the potential to support significant economic growth. These are sectors against which to prioritise
resource and effort as a key economic development opportunity for CCGBC.
Sustain and Grow: These are important core sectors for CCG’s economic development, with potential
to enable (potentially significant) incremental growth. These are sectors which should be cultivated and
nurtured to support future economic growth.
Monitor and Intervene: These are sectors which, although they may be important to the current local
economy, are not considered likely to generate material economic growth moving forward. These
sectors should be monitored on an on-going basis for opportunities and trends which might create
potential for future economic development, and interventions made accordingly.
3.2 Identifying priority sectors and trends that will
impact upon them
Top down review
There are a range of strategies, policies, plans and research documents which present sectors of
importance at different geographical and administrative levels. In undertaking this top down review, a
review of the sectors identified in the following has been undertaken.
• UK Industrial Strategy 2017
• Economy 2030 – NI Draft Industrial Strategy
• Matrix NI (range of research documents)
• Invest NI Business Plan 2017-2021
• Rebuilding a Stronger Economy (Department for the Economy, 2020)
This review has identified three main trends:
• There are three sectors which sit within the UK industrial strategy which are considered to have
a level of competitiveness/importance in Northern Ireland – Construction, Creative and Digital
Tech and Life and Health Sciences.
• Three sectors are identified by all the NI focused documents as being priorities for NI but are
not identified in the UK Industrial Strategy – Advanced Manufacturing, Materials and
Engineering; Agri-Food; and Financial Business and Professional Services*.
• The Department for the Economy’s response to Covid-19 identifies sectors that could provide
high paying jobs as part of the economic recovery. These are: Advanced Manufacturing, Life
and Health Science, Clean energy, and Digital.
Some definitions:
Advanced manufacturing - production processes that rely on cutting-edge science and technology
research. ... It also includes generic high-tech processes, such as automation and robotics, which can
give a range of products a competitive advantage in terms of cost or environmental impact.
Materials and Engineering - working with metals, ceramics, and plastics to create new materials
Agri-foods - agriculture, horticulture, and food and drink processing technologies
Financial Business and Professional Services - covers a range of diverse knowledge- intensive
industries and support functions (e.g. call centres and other business support services), which provide
specialised support to businesses and the public sector.
40Table 3.1: Overview of approach
UK Rebuilding
Industrial Economy Matrix Invest a stronger
Strategic Focus Strategy 2030 NI NI economy
Advanced Manufacturing, Materials and ✔
Engineering ✔ ✔ ✔
Aerospace ✔ ✔
Agri-food ✔ ✔ ✔
Automotive ✔
Construction ✔ ✔ ✔
Creative and Digital Technology ✔ ✔ ✔ ✔ ✔
Financial Business and Professional
Services ✔
Life and Health Sciences ✔ ✔ ✔ ✔ ✔
Green/Clean ✔
Source: Grant Thornton analysis
Beyond established sectors, the Draft NI Industrial Strategy – NI 2030 identifies the following sector
growth opportunities:
• Cybersecurity - Digital technology/Financial, Business and Professional Services
• Legal services technology – Digital technology/Financial, Business and Professional Services
• Precision medicine – Life and Health Sciences
• Big data / Internet of things – Digital Technology
These are a combination of niche sectors and cross cutting technology platforms which will impact
multiple sectors.
Bottom up review
The bottom up review focuses on the following:
• Comprehensive analysis of sector performance within the Causeway Coast and Glens area
and sector attributes focusing on sectors defined by Standard Industrial Classifications (SIC);
• Mapping of anchor firms and institutions;
• Review of regional level policies identifying key sectors; and
• Views from across the Causeway Coast and Glen borough on where opportunities lie.
3.2.1 Analysis of Causeway Coast and Glens Sector Performance
Analysis of Sector performance considers the performance of sectors within the CCGBC area against
a range of indicators as identified below. A holistic look at the performance of sectors against these
indicators creates a clear picture of which sectors generate economic and employment output, are
growing, are highly concentrated in CCGBC and are internationally engaged via exports. These
attributes point to various levels of competitiveness, which CCGBC can build on to support
development.
41Figure 3.2: Indicators of Competitive Advantage
GVA Trends
Gross Value Added (GVA) is the measure of the value of goods and services produced in an area,
industry or sector of an economy. Figure 10.3 below presents an overview of the contribution of each
sector within the CCGBC area to the £2.1bn of output generated in 2018, representing 5% of overall
output for NI. CCGBC top five sectors consist of Wholesale & Retail (17.5%), Manufacturing (16.0%),
Real estate (15.7%), Health & Social (9.5%) and Construction (8.2%), which made up a total 67% of
output in 2018.
Figure 3.3: GVA by sector, CCGBC 2018
Source: ONS – Regional accounts
Notes: Other represents those sectors with less than 1% proportion of GVA including – Mining and quarrying, water supply,
financial activities, household activities and utilities.
42Since 2012, the CCGBC economy produced an additional £47 million in GVA. The largest contributors
to this were Retail (£71m), Construction (£53m) and Agriculture (£17m). In terms of growth, construction
saw the largest increase of 44.5% from 2012 averaging at approximately 6.3% growth per annum. This
was then followed by Agriculture (39.9%) and Utilities (25.0%).
Figure 3.4: GVA changes by sector, CCGBC 2018
Source: ONS – Regional accounts
Productivity
Productivity is key component in measuring the health of an economy and how productive each sector
is in terms of its output per worker. The more productive a sector is, the more output it can produce per
worker, meaning that any growth within a highly productive sector with boost growth further within the
local economy. In 2018 average productivity per worker in CCGBC was just under £40,150. The Real
Estate sector was by far the most productive (£701,470) followed by Utilities (£123,290) and Mining &
Quarrying (£70,880). However, these are highly capital-intensive sectors with commonly low
employment and therefore distort the figures. Outside of these sectors, the Manufacturing sector has
the highest productivity levels (£67,240) and is in par with the NI average.
43You can also read