Reduced gonadotroph stimulation by ethanolamine plasmalogens in old bovine brains - Nature
←
→
Page content transcription
If your browser does not render page correctly, please read the page content below
www.nature.com/scientificreports
OPEN Reduced gonadotroph stimulation
by ethanolamine plasmalogens
in old bovine brains
Hiroya Kadokawa1*, Miyako Kotaniguchi2, Onalenna Kereilwe1 & Shinichi Kitamura2
Ethanolamine plasmalogens (EPls), unique alkenylacyl-glycerophospholipids, are the only known
ligands of G-protein-coupled receptor 61—a novel receptor co-localised with gonadotropin-releasing
hormone receptors on anterior pituitary gonadotrophs. Brain EPl decreases with age. Commercial
EPl—extracted from the cattle brain (unidentified age)—can independently stimulate FSH secretion
from gonadotrophs. We hypothesised that there exists an age-related difference in the quality,
quantity, and ability of bovine brain EPls to stimulate bovine gonadotrophs. We compared the brains
of young (about 26 month old heifers) and old (about 90 month old cows) Japanese Black bovines,
including EPls obtained from both groups. Additionally, mRNA expressions of the EPl biosynthesis
enzymes, glyceronephosphate O-acyltransferase, alkylglycerone phosphate synthase, and fatty
acyl-CoA reductase 1 (FAR1) were evaluated in young and old hypothalami. The old-brain EPl did not
stimulate FSH secretion from gonadotrophs, unlike the young-brain EPl. Molecular species of EPl
were compared using two-dimensional liquid chromatography-mass spectrometry. We identified
20 EPl molecular species of which three and three exhibited lower (P < 0.05) and higher (P < 0.05)
ratios, respectively, in old compared to young brains. In addition, quantitative reverse transcription-
polymerase chain reaction detected higher FAR1 levels in the POA, but not in the ARC&ME tissues,
of old cows than that of fertile young heifers. Therefore, old-brain EPl may be associated with age-
related infertility.
Reproduction is controlled by the hypothalamus, which contains neurons that secrete gonadotropin-releasing
hormone (GnRH). This, in turns, binds to GnRH receptors on the gonadotroph plasma membrane in the anterior
pituitary to stimulate the secretion of follicle-stimulating hormone (FSH) and luteinising hormone (LH)1. G-pro-
tein-coupled receptor 61 (GPR61) is a novel receptor that is co- localise with GnRH receptors on the lipid raft of
the gonadotroph surface2, with ethanolamine plasmalogen (EPl), a unique alkenylacyl-glycerophospholipid class,
being its only known ligands3. Even without GnRH, gonadotrophs in heifers were stimulated by cattle extracted
commercial EPls to secrete F SH4. EPl is decreased in the human brain with ageing, which induces age-related
diseases4,5. Therefore, EPl may be a molecular link in age-related infertility via GPR61 in gonadotrophs. However,
the company from which we purchased EPl did not report the age of the cattle used for extraction. Compared
with other organs, the brain contains the highest EPl level5. The biosynthesised EPl may be transported from the
brain, including the hypothalamus, to gonadotrophs via the systemic circulation or hypophyseal portal system.
EPl contains a fatty alcohol bonded to the glycerol backbone at the sn-1 position with a vinyl-ether bond,
and fatty acids bonded to the sn-2 position with an ester bond. We previously suggested the importance of
the side chain at the sn-2 position in gonadotroph s timulation4. Based on the various possible combinations
of fatty alcohol and acids, the brain contains various molecular EPl species. However, there has been no study
on differences in the ratios of various EPl molecular species with ageing for two main reasons. First, there had
been no appropriate analysis method until we developed a novel two-dimensional liquid chromatography–mass
spectrometry (2D LC–MS) system6. Second, it is difficult to collect various human brain samples, and the hypo-
thalamic size of laboratory animals is too small for appropriate analysis.
In this study, we used brain samples obtained from cattle. Similar to that of women, cow fertility decreases
with age7. However, the exact mechanisms underlying this association remain unclear. We hypothesised that
there exists an age-related difference in bovine brain EPl quality and quantity, and in its ability to stimulate
bovine gonadotrophs. We used EPl extracted from the brain of young and old female bovines with known age
and fertility. Glyceronephosphate O-acyltransferase (GNPAT), alkylglycerone phosphate synthase (AGPS), and
1
Faculty of Veterinary Medicine, Yamaguchi University, Yamaguchi‑shi, Yamaguchi‑ken 1677‑1,
Japan. 2Centre for Research and Development of Bioresources, Osaka Prefecture University, 1‑2 Gakuen‑cho,
Naka‑ku, Sakai 599‑8531, Japan. *email: hiroya@yamaguchi‑u.ac.jp
Scientific Reports | (2021) 11:4757 | https://doi.org/10.1038/s41598-021-84306-6 1
Vol.:(0123456789)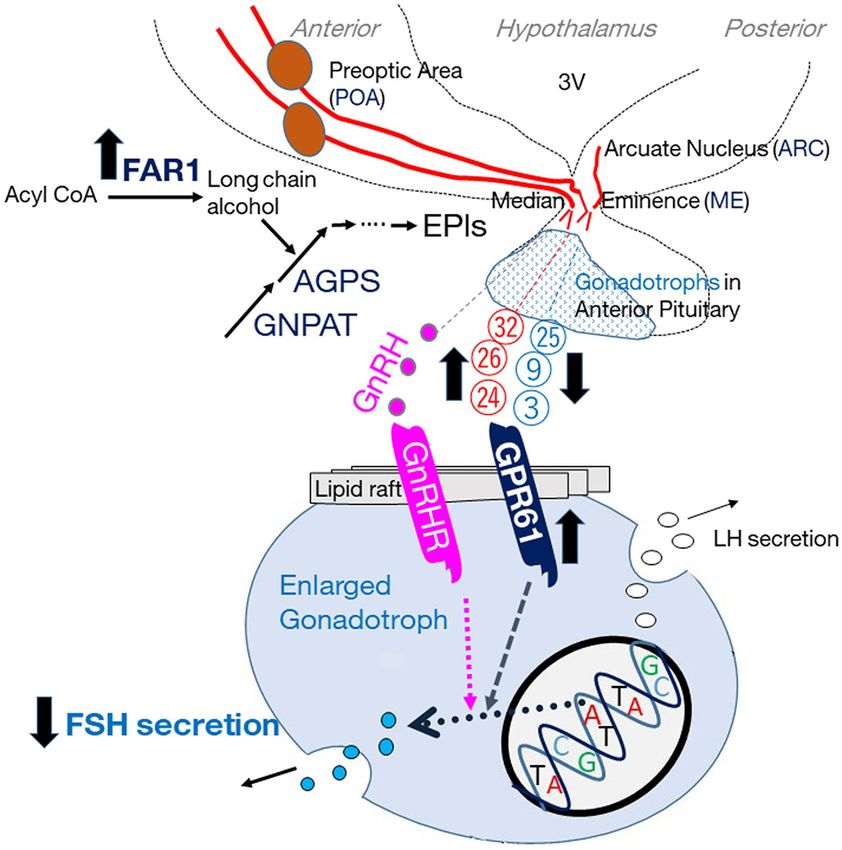
www.nature.com/scientificreports/
iosynthesis5. Therefore, additionally we
fatty acyl-CoA reductase 1 (FAR1) are important enzymes involved b
compared the mRNA expression of these enzymes in the hypothalamus between young and old female bovines.
Results
Weaker gonadotroph stimulation by old‑brain EPl. First, we prepared EPl-rich lipids from a whole
brain mixture of five fertile young heifers (25.8 ± 0.5 months old), or five old cows (90.8 ± 2.2 months old), fol-
lowing the removal of non-plasmalogen-type phosphatidylethanolamines. Subsequently, we prepared bovine
anterior pituitary cells from healthy post-pubertal heifers (25.7 ± 0.4 months old; n = 6) and cultured them for
3.5 days in order to confirm the different anterior pituitary stimulation by young- and old-brain EPl. We incu-
bated the cells with 0, 0.05, 0.5, 5, or 50 ng/mL (final medium concentration) young- or old-brain EPl. The
medium samples were harvested 2 h after culture for FSH and LH assays. We observed that all tested concentra-
tions of young brain EPl stimulated FSH (Fig. 1A), but not LH (Fig. 1C) secretion (statistical values are shown in
Supplementary Tables S1 and S3 online). The cumulative concentration of FSH secreted from anterior pituitary
cells by stimulation of 0.5 ng/mL young-brain EPl over a 2-h period in the absence of GnRH reached the same
level as that secreted from cells by GnRH alone. Contrastingly, no old-brain EPl dose stimulated FSH and LH
secretion (Fig. 1B,D; statistical values are presented in Supplementary Tables S2 and S4 online).
Differences in the ratios of EPl molecular species between young and old brains. We analysed
the EPl-rich lipids from the whole brain mixture of five fertile young heifers, or five old cows using the 2D LC–
MS system. First-dimensional high-performance liquid chromatography (HPLC) comprised of normal-phase
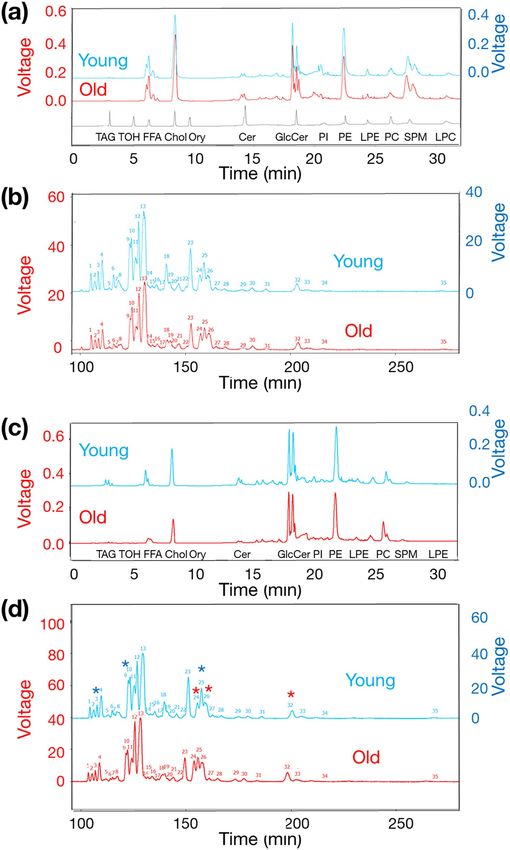
HPLC and a charged aerosol detector. Figure 2a presents an example of a first-dimensional LC profile of EPl-rich
lipids in a 0.1-mg mixture of a young- or old whole brain tissue, and 13 lipid standard compounds. We compared
the peak area ratio of each lipid class to the total peak area between the young and old brains using a two-tailed
unpaired t-test (Table 1). The most prevalent major lipid was cholesterol; moreover, there was no difference
(P = 0.4353) in the ratio of the cholesterol to the total peak area between young and old brains.
Phosphatidylethanolamines were the second most detected major lipids especially, almost all phosphatidyle-
thanolamines were EPls. The ratio of the phosphatidylethanolamine to the total peak area was lower (P = 0.0001)
in old than in young brains. Regarding other lipids, the ratio of the lysophosphatidylethanolamine to the total
peak area was higher (P = 0.001) in young than in old brains. Meanwhile, the ratios of the glucosylceramide
(P = 0.0031) and sphingomyelin (P = 0.0014) peak areas to the total peak area were lower in young than in old
brains.
Subsequently, we analysed the EPl molecular species in the phosphatidylethanolamine fraction using second-
dimensional, reverse-phase HPLC separation and a charged aerosol detector. Figure 2b presents an example
profile of EPl molecular species in the phosphatidylethanolamine fraction, exhibiting 35 peaks. Although we
employed a small sample number, there were several differences in the EPl molecular species between the young
and old whole brains.
For more precise analyses, we extracted EPl-rich lipids following the removal of non-plasmalogen-type
phosphatidylethanolamines from the anterior hypothalamic tissue containing preoptic area (POA tissue), or
from the intermediate and posterior hypothalamic tissues containing arcuate nucleus and median eminence
(ARC&ME tissues) of fertile young heifers (25.7 ± 0.4 months old; n = 6) and old cows (91.0 ± 1.9 months old;
n = 6). We observed differences in the hypothalamic lipid class ratios between the young and old brains. Specifi-
cally, the ratio of the phosphatidylethanolamine to the total area was lower (P = 0.0001) in old (13.22 ± 0.35%)
than in young (15.86 ± 0.25%) brains. We compared the peak area ratio of each EPl molecular species to the
total phosphatidylethanolamine area in each hypothalamus between young and old brains using 2D LC–MS.
Figure 2c,d present an example profile of first- and second-dimensional HPLC separation. Similar to the whole
brain samples, the EPl-rich lipids extracted from the hypothalamus exhibited 35 peaks. The 2D LC–MS system
identified 20 EPl molecular species (Table 2). Among them, the ratios of three molecular species [C16:0–C20:4
(the carbon chain at the sn-1 position was C16:0, and the fatty acid at the sn-2 position was C20:4) (P = 0.0246),
C16:0–C22:4 (P = 0.0403), and C18:0-C18:1 (P = 0.0048)] were lower in the hypothalami of old than that in the
young brains. In contrast, three molecular species [C16:0–C20:1 (P = 0.0075), C18:1–C20:1 (P = 0.0033), and
C18:0–C20:1 (P = 0.0039)] exhibited higher ratios in the hypothalamus in old than in young brains.
EPl biosynthesis enzymes in the hypothalamus. We evaluated mRNA of EPl biosynthesis enzymes
in the following regions: The hypothalamus, especially, in the POA, which controls GnRH surge secretion and
ovulation; the ARC, which controls GnRH pulsatile secretion and various ovarian functions; the ME, which
secretes various hypothalamic hormones into the portal system towards the anterior pituitary8. We could not
separate the ARC and ME, owing to the very close distance between them.
Reverse transcription-polymerase chain reaction (RT-PCR) detected the mRNA of all three aforementioned
EPl biosynthesis enzymes (i.e. GNPAT, AGPS, and FAR1), in the POA and ARC&ME tissues (n = 5, 26 months
old; Fig. 3a). Quantitative RT-PCR (RT-qPCR) detected higher FAR1 levels in the POA, but not in the ARC&ME
tissues, of old cows (90.8 ± 1.9 months old; n = 5) than that of fertile young heifers (25.8 ± 0.5 months old; n = 5;
Fig. 3b).
Upregulated GPR61 expression in the anterior pituitary of old cows. To estimate GPR61 upregu-
lation in the anterior pituitary induced by decreased hypothalamic EPl in old brains, we used RT-qPCR to com-
pare the mRNA levels of GPR61 in the anterior pituitary between young heifers (26.2 ± 0.4 months old; n = 5) and
old cows (90.2 ± 1.9 months old; n = 5). We observed upregulated (P = 0.0208) GPR61 expression in the anterior
pituitary of old cows compared to that of young heifers (Fig. 4).
Scientific Reports | (2021) 11:4757 | https://doi.org/10.1038/s41598-021-84306-6 2
Vol:.(1234567890)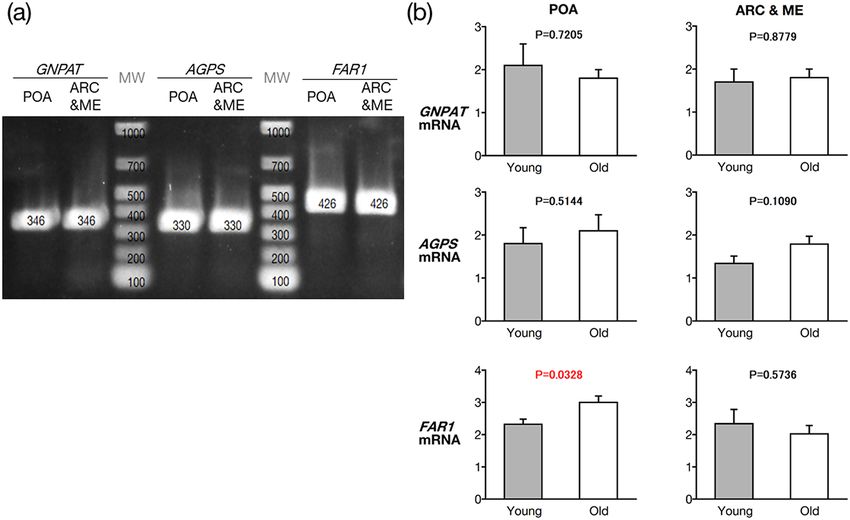
www.nature.com/scientificreports/

                                  Figure 1.  Effects of various concentrations of bovine brain EPl in media lacking GnRH on hormone secretion
                                  from cultured AP cells. EPl was obtained from fertile young heifers (A, C) and old cows (B, D), and its effect
                                  was tested on FSH (A, B) and LH (C, D) secretions. FSH and LH concentrations in control cells (cultured in
                                  medium lacking EPl and GnRH) were averaged and set as 100%. The mean FSH or LH concentrations in each
                                  treatment group were expressed as percentages of the control value. Bars labelled with different letters (a, b, and
                                  c) indicate different stimulatory effects (P < 0.05; Details of P value are presented in Supplementary Tables S1–
                                  S4). The bars labelled with the same letter indicate a similar stimulatory effect. Statistical analysis was conducted
                                  using one-factor analysis of variance, followed by Fisher’s protected least significant difference test. AP anterior
                                  pituitary, EPl ethanolamine plasmalogen, GnRH gonadotropin-releasing hormone, FSH follicle-stimulating
                                  hormone, LH luteinising hormone.

Scientific Reports |   (2021) 11:4757 |                https://doi.org/10.1038/s41598-021-84306-6                                                     3

                                                                                                                                                Vol.:(0123456789)
www.nature.com/scientificreports/
Figure 2. Chromatograms depicting examples of HPLC profiles of bovine EPl. The red font on the left side ▸
Y-axis indicates the voltage of the old group, and the blue font on right side Y-axis indicates the voltage of the
young group. The chromatograms of young animals were shifted up for clarity, and no difference in the baseline
values between young and old animals was observed. (a) EPl-rich lipids were extracted from a whole brain
mixture obtained from five young heifers and five old cows, and analysed thrice using the 2D LC–MS system.
The chromatograms depict an example of a first-dimensional HPLC (normal-phase HPLC and a charged
aerosol detector) profile of the extracted EPl-rich lipids and 13 lipid standard compounds (TAG, TOH, FFA,
cholesterol, Ory, ceramide, GlcCer, PI, PE, LPE, PC, SPM, and LPC). (b) The chromatograms depict an example
profile of second-dimensional HPLC separation (reverse-phase-HPLC and a charged aerosol detector) of the El
molecular species in the phosphatidylethanolamine fraction, eluted from the first-dimensional HPLC column,
exhibiting 35 peaks. (c) EPl-rich lipids were extracted from the hypothalami of young heifers (n = 6) and old
cows (n = 6) and analysed using the 2D LC–MS system. The chromatograms depict an example profile of the
first-dimensional HPLC of hypothalamic EPl-rich lipids, and indicated the elution timing of 13 lipid standard
compounds. (d) The chromatograms depict an example profile of the second-dimensional HPLC separation of
hypothalamic EPl molecular species in the phosphatidylethanolamine fraction, eluted from the first-dimensional
HPLC column, from young or old brains, indicating the presence of 35 EPl lipid classes. The peaks refer to the
components listed in Table 2. Blue and red asterisks indicate identifiable EPl molecular species that were higher
or lower, respectively, in young than in old hypothalami (details are presented in Table 2). 2D LC–MS two-
dimensional liquid chromatography-mass spectrometry, HPLC high-performance liquid chromatography, EPL
ethanolamine plasmalogen, TAGtripalmitin, TOH D-α-tocopherol, FFA palmitic acid, Ory cycloartenyl ferulate,
GlcCer glucosylceramide, PI phosphatidylinositol, PE 1,2‑Dipalmitoyl‑sn‑glycero‑3‑phosphoethanolamine, LPE
1‑palmitoyl‑2‑hydroxy‑sn‑glycero‑3‑phosphoethanolamine, PC 1,2‑dipalmitoyl‑sn‑glycero‑3‑phosphocholine,
SPM sphingomyelin, LPC 1‑palmitoyl‑2‑hydroxy‑sn‑glycero‑3‑phosphocholine.
Discussion
Our findings suggest that old-brain EPl does not stimulate FSH secretion by pituitary gonadotrophs to the same
degree as that of young brains; Fig. 5 illustrates the relationship between EPl, mRNA expression of biosynthesis
enzymes in POA, and gonadotroph stimulation, based on the obtained results and speculation. We speculated
that EPls may be transported from the hypothalamus to gonadotrophs. Brain EPl stimulates FSH secretion in
bovine gonadotrophs, even in the absence of GnRH, through cytoplasmic signalling pathways4. The 2D LC–MS
system used in this study was merely for analytical purposes and could not be used to separately elute each EPl
molecular species; therefore, we did not evaluate the effect of each EPl molecular species. However, our find-
ings suggest that age-based differences in the ratios of EPl molecular species were responsible for reduced gon-
adotrophic FSH secretion. Interestingly, lysophosphatidylethanolamine, which lacks an acyl group in the sn-2
position, did not affect FSH and LH secretions in our previous study4. Therefore, we propose that the acyl group
at the sn-2 position is crucial for regulating gonadotrophic secretion. Our findings indicated that C20:4, C22:4,
and C18:1 at the sn-2 position may be crucial for stimulating FSH secretion. Moreover, our findings indicated
that C20:1 at the sn-2 position play a vital role in inhibiting FSH secretion.
The reaction steps for EPl biosynthesis are as follows: Acylation of dihydroxyacetone phosphate at the sn-1
position by GNPAT, transfer of acyl-DHAP across the enzyme active sites, and finally exchange of the acyl group
(fatty acid) for an alkyl group (fatty alcohol generated by FAR1) by A GPS5. Therefore, the increased FAR1 levels
may partially explain the differences observed in the hypothalamic EPls. However, we could not western blotting
for the enzymes because we could not obtain appropriate set of antibodies, and positive and negative controls to
perform quantitative assays. Therefore, further studies are warranted to evaluate the changes in enzymes in brains.
Three EPl molecular species were higher in the hypothalamus in old than in young brains. Therefore, an
increased suppressive effect of these EPl molecular species is possible. In EPl remodelling, the sn-2 acyl group is
removed by a plasmalogen-selective phospholipase A2 and replaced with a different acyl group by lysophospho-
lipid acyltransferases5. In an unpublished study using RNA-Seq, we discovered > 25 phospholipase A2 members
in the bovine hypothalamus. Therefore, further studies are warranted to clarify the age-related differences in the
expression of phospholipase A2 and lysophospholipid acyltransferases in the brain.
Approximately 75% of GPR61-positive cells in the cattle pituitary are gonadotrophs, while the remaining
are non-gonadotrophs2. Although the precise function of GPR61 remains unclear, GPR61-deficient mice have
exhibited hyperphagia-associated o besity9. Moreover, GPR61 has been implicated in type 2 d iabetes10. Therefore,
the quantitative and qualitative differences in hypothalamic EPl observed in this study may affect food intake
and body weight via GPR61 in non-gonadotroph cells in the anterior pituitary.
Compared with older brains, in this study, younger brains had a lower ratio of glucosylceramide and sphingo-
myelin peak areas to the total peak area. To the best of our knowledge, there has been no previous report on the
relationship between hypothalamic lipids and gonadotrophs, the pituitary, or reproduction. Glucosylceramide
may be involved in the central nervous system regulation of body weight and energy h omeostasis11. Although fur-
ther studies are warranted, these lipids are unlikely to contribute substantially to the regulation of FSH secretion.
For culturing, we used EPl-rich lipids from the whole brain rather than from the hypothalamus, due to
limitations regarding the amount of EPl-rich lipids in the hypothalamus. There was no difference in the first-
and second-dimensional HPLC profiles of EPl between the whole brain and the hypothalamus. Therefore, the
stimulatory effect of hypothalamic EPl-rich lipids was likely similar to that in the whole brain.
We demonstrated in this study that, in the absence of GnRH, the FSH secretion from anterior pituitary cells
stimulated by 0.5 ng/mL young-brain EPl was higher than that stimulated by 50 ng/mL young-brain EPl. We
Scientific Reports | (2021) 11:4757 | https://doi.org/10.1038/s41598-021-84306-6 4
Vol:.(1234567890)www.nature.com/scientificreports/
Scientific Reports | (2021) 11:4757 | https://doi.org/10.1038/s41598-021-84306-6 5
Vol.:(0123456789)www.nature.com/scientificreports/
Young-brain Old-brain area
area (%)a (%)a
Lipid class P value Mean SEM < or > b Mean SEM
Free fatty acid 0.1012 4.87 0.03 4.97 0.03
Cholesterol 0.4353 18.90 0.06 19.00 0.10
Glucosylceramide 0.0031 10.33 0.03 < 10.93 0.09
Phosphatidylethanolamine containing EPl 0.0001 16.47 0.03 > 13.10 0.10
Lysophosphatidylethanolamine 0.0010 1.70 0.00 > 1.20 0.06
Phosphatidylcholine 0.1277 2.90 0.06 2.47 0.22
Sphingomyelin 0.0014 8.47 0.09 < 9.33 0.07
Lysophosphatidylcholine 0.1848 1.20 0.12 0.93 0.12
Table 1. Comparison of the ratio of the peak area of each lipid class to the total peak area of all lipids in
young and old brains. EPl ethanolamine plasmalogen, SEM standard error of the mean. a Ratio of the peak area
of each lipid class to the total peak area. b The ratio was higher ( >) or lower ( 1 nM) exhibited a weaker stimulation of LH secretion in the same
system of cultured bovine anterior pituitary cells12. Therefore, excess EPl may have a weaker stimulatory effect.
Similar to that in women, old age is associated with decreased fertility in cows7. The hypothalamus is a brain
structure with highly conserved anatomy throughout the vertebrates, owing to its essential function in regulat-
ing fundamental aspects of physiological homeostasis and behaviour13. Therefore, the results obtained from this
study may be generalisable to other species, including humans.
Although the brain contains the highest EPl levels in the b ody5, EPl produced in other tissues may act on the
pituitary, which may itself produce EPl to act in an autocrine or paracrine fashion. Therefore, further studies are
warranted to evaluate the changes in EPl molecular species in other organs. Especially, whether EPl production
in all tissues is modified in the same way by ageing remains to be determined. Specific changes in the brain due
to ageing should also be evaluated.
EPl alleviates amyloid-β-induced neurotoxicity, possibly through the vinyl-ether linkage at the sn-1 position14,
making it a potential therapeutic agent against Alzheimer’s disease15. Further studies are warranted to determine
the therapeutic effect of the molecular species observed in this study on Alzheimer’s disease.
Owing to the possible important sex-associated differences, interpreting the obtained data in human females
may not be as clear. Old cows have no menopause at the time of slaughter16,17. In a recent literature review of
23 selected previous papers18, blood FSH concentration in human females approaching menopause decreased
in 21 studies, while the remaining two reported an increase. However, it is possible that other factors, besides
EPl (e.g. oestradiol and prolactin), may contribute to controlling blood FSH levels in older human females18. In
conclusion, our findings indicated that age-related qualitative and quantitative differences in brain EPl may be
crucially involved in age-related infertility in cows.
Methods
Ethics statement. All experiments were performed according to the Guiding Principles for the Care and
Use of Animals in the Field of Physiological Sciences (Physiological Society of Japan). All experiments involv-
ing animals were approved by the Committee of Yamaguchi University (Approval Number, 301). All cattle were
obtained from contract farmers in western Japan. Following the disaster of bovine spongiform encephalopathy
in 2002, all cattle born in Japan are registered at birth in a national database, with an individual identification
number. Consumers can obtain information regarding the breed, date of birth, farm of origin, and slaughter by
querying the server of the National Livestock Breeding Centre of Japan. We verified the above information in
this study. All cattle involved in this study were slaughtered for harvesting beef according to the regulation of the
Ministry of Agriculture, Forestry, and Fisheries of Japan.
In terms of safety hazards, organic solvents and paraformaldehyde were handled inside a fume hood to pre-
vent its inhalation. Insulating gloves were used when handling acids, liquid nitrogen, and the − 80 °C freezer.
Brain and anterior pituitary sample collection. We obtained whole brain, hypothalamus, and anterior
pituitary samples from healthy, post-pubertal, young Japanese Black heifers and old Japanese Black cows at a
ethod12,19. After slaughter, the samples were collected, placed in
local abattoir, following a previously described m
liquid nitrogen within 15 min, and stored at − 80 °C.
We followed previously reported methods19 to collect POA and ARC&ME tissue samples from these animals
to perform RT-PCR, or RT-qPCR.
All cattle were in the luteal phase, as determined by macroscopic examination of the ovaries and u terus20;
the anterior pituitary exhibits the highest LH, FSH, GPR61, and GnRH receptor levels in this phase2,21. None of
the cattle used in the present study were lactating or pregnant and had no follicular cysts, luteal cysts, or other
ovarian disorders22. The old cows were slaughtered for beef after completing parturition a sufficient number of
times, as planned by the farmers.
Scientific Reports | (2021) 11:4757 | https://doi.org/10.1038/s41598-021-84306-6 6
Vol:.(1234567890)www.nature.com/scientificreports/
Young Old
hypothalamus hypothalamus
area (%)d area (%)
Identified molecular
Peakno RT (min) m/za speciesb P value Mean SEM < or > e Mean SEM
1 104.36 748.53 16:0–22:6 0.0774 1.060 0.051 0.922 0.048
2 106.25 774.56 18:1–22:6 0.6005 1.217 0.075 1.157 0.082
3 107.81 724.52 16:0–20:4 0.0246 1.505 0.059 > 1.246 0.078
4 109.74 750.54 18:1–20:4 0.3931 3.643 0.178 3.417 0.182
5 112.95 762.60 UIDc 0.3921 0.947 0.075 0.858 0.066
6 114.99 750.56 16:0–22:5 0.1235 0.912 0.109 0.659 0.103
7 116.06 726.55 16:0–20:3 0.8596 0.490 0.030 0.503 0.067
8 117.18 776.55 18:1–22:5 0.4765 2.113 0.135 1.973 0.134
9 118.38 752.54 16:0–22:4 0.0403 5.298 0.189 > 4.197 0.428
10 122.57 776.54 18:0–22:6 0.7358 4.725 0.302 4.539 0.442
11 123.42 778.58 18:1–22:4 0.2269 6.543 0.203 5.995 0.375
12 125.43 702.50 16:0–18:1 0.5657 10.065 0.486 9.669 0.456
13 126.78 752.59 18:0–20:4 0.7229 20.015 0.647 19.675 0.671
14 129.31 704.57 UID 0.8043 0.880 0.050 0.896 0.037
15 131.01 728.68 16:0–20:2 0.5544 0.835 0.065 0.888 0.058
16 133.06 766.60 UID 0.1758 1.705 0.102 1.910 0.097
17 135.30 754.20 16:0–22:3 0.2831 0.372 0.036 0.463 0.072
18 137.87 778.58 18:0–22:5 0.2196 2.855 0.284 2.403 0.195
19 139.84 754.62 UID 0.0342 1.305 0.059 < 1.530 0.070
20 141.79 742.60 UID 0.0361 0.352 0.034 < 0.551 0.075
21 142.34 780.61 UID 0.8247 1.207 0.126 1.239 0.068
22 145.50 806.60 UID 0.1933 0.512 0.042 0.597 0.045
23 149.18 780.56 18:0–22:4 0.0639 7.725 0.324 6.475 0.505
24 151.13 730.57 16:0–20:1 0.0075 3.345 0.149 < 4.228 0.219
25 155.43 730.54 18:0–18:1 0.0048 6.453 0.140 > 5.845 0.094
26 157.34 756.58 18:1–20:1 0.0033 5.238 0.191 < 6.847 0.373
27 158.98 732.60 UID 0.0828 1.203 0.058 1.393 0.079
28 162.62 758.65 UID 0.0103 1.047 0.044 < 1.361 0.090
29 166.99 744.69 UID 0.0200 0.880 0.056 < 1.170 0.089
30 175.46 782.62 UID 0.0363 0.902 0.066 < 1.102 0.050
31 179.73 808.67 UID 0.0010 0.563 0.031 < 0.788 0.037
32 186.04 758.60 18:0–20:1 0.0039 2.542 0.113 < 3.352 0.186
33 200.85 784.66 UID 0.0039 0.963 0.042 < 1.348 0.094
34 204.59 760.60 UID 0.6307 0.370 0.076 0.408 0.014
35 212.45 786.60 UID 0.2728 0.313 0.049 0.396 0.051
Table 2. Composition and comparison of hypothalamic EPl molecular species extracted from young (n = 6)
and old (n = 6) brains. EPl ethanolamine plasmalogen, SEM standard error of the mean, RT retention time.
a
m/z: mass to charge ratio, identified as the molecular ion [M + H] + b Identified molecular species: denoted as
the carbon chains at the sn-1 position and fatty acids at the sn-2 position. c Molecular species not identified.
d
Ratio of the peak area of each EPl molecular species to the total peak area. e The ratio was higher ( >) or
lower (www.nature.com/scientificreports/
Figure 3. Electrophoresis of amplified DNA produced using RT-PCR to detect expressed mRNA of all three
EPl biosynthesis enzymes (i.e. GNPAT, AGPS, and FAR1) (a) and compared using quantitative RT-PCRs (b).
We used primers for each enzyme and cDNA derived from the POA and ARC&ME tissues in fertile, young
heifers (26 months old), or old cows (90 months old). (a) All lanes were obtained from the same gel; the lanes
labelled as enzyme name demonstrate that the obtained DNA products had the expected size (346, 330, and
426 bp, respectively), whereas the other two lanes (MW) correspond to the DNA marker. Two-tailed unpaired
t-tests was used to determine statistically significant differences in FAR1 in the POA and ARC&ME tissues
between the groups. EPL ethanolamine plasmalogen, AGPS alkylglycerone phosphate synthase, FAR1 fatty
acyl-CoA reductase 1, POA preoptic area, ARC&ME tissues arcuate nucleus and median eminence-containing
intermediate and posterior hypothalamic tissue, GNPAT Glyceronephosphate O-acyltransferase, MW molecular
weight marker.
Small‑scale EPl extraction from hypothalami for 2D LC–MS analysis. Total lipids were extracted
ethod25 and treated with phospholipase A1 (details are pro-
from young and old hypothalami using Folch’s m
vided online in the Supplementary Methods).
2D LC–MS analysis. We used a novel 2D LC–MS system, as described previously6, to analyse the EPl
molecular species (details are provided online in the Supplementary Methods).
Analysis of the effects of EPl‑rich lipids on young‑ or old‑brain anterior pituitary cell cul-
ture. We obtained anterior pituitaries from healthy, post-pubertal Japanese Black heifers at the local abattoir,
using a previously described method2,4. The heifers were in the mid-luteal phase. Enzymatic dispersal of ante-
rior pituitary cells was performed using a previously described method12, and confirmation of cell viability of
> 90% was determined via trypan blue exclusion. Dispersed cells were suspended in Dulbecco’s Modified Eagle’s
Medium (DMEM), containing nonessential amino acids (Thermo Fisher Scientific, Waltham, MA, USA), 100 U/
mL penicillin, 0.05 mg/mL streptomycin, 10% horse serum, and 2.5% foetal bovine serum. Cells (2.5 × 10⁵ cells/
mL, total 0.3 mL) were plated in 48-well culture plates and maintained at 37 °C, in a humidified atmosphere of
5% CO2, for 82 h. Each experiment was performed six times with each of the six different pituitary glands, using
four wells per treatment. We supplied recombinant human activin A (final concentration, 10 ng/mL; R&D Sys-
tems, Minneapolis, MN, USA) to stimulate FSH synthesis 24 h prior to the tests.
To evaluate the effect of young- or old-brain EPl-rich lipids, the initial medium was replaced with 0.25 mL
of DMEM containing 0.1% bovine serum albumin and 10 ng/mL activin A, and incubated at 37 °C for 2 h.
Treatment was performed by adding 0.5 mL of DMEM alone, or 0.5 mL of DMEM containing various con-
centrations (final concentrations of 0, 0.05, 0.5, 5, or 50 ng/mL) of young- or old-brain EPl-rich lipids. After
incubation at 37 °C for a further 2 h, the medium from each well was collected for radioimmunoassay of LH
Scientific Reports | (2021) 11:4757 | https://doi.org/10.1038/s41598-021-84306-6 8
Vol:.(1234567890)www.nature.com/scientificreports/
Figure 4. Upregulated G-protein-coupled receptor 61 (GPR61) expression in the anterior pituitary of old cows.
Comparison of GPR61 mRNA expression measured using RT-qPCR. There were significant differences between
the groups. Statistical analysis was conducted using two-tailed unpaired t-tests.
and FSH concentrations, using a previously reported method2. These concentrations were selected based on
our previous study3.
RNA extraction, cDNA synthesis, and RT‑PCR. Total RNA was extracted using the RNAzol RT isola-
tion reagent (Molecular Research Centre, Inc., Cincinnati, OH, USA), and treated with deoxyribonuclease. The
concentration and purity of each RNA sample were evaluated by spectrophotometry (acceptable range, 1.8–2.1)
and electrophoresis (28S:18S ratios were 2:1). Complementary DNA was synthesised using the Verso cDNA
Synthesis Kit (Thermo Fisher Scientific).
We used previously reported RT-PCR m ethods2 to detect mRNAs of GNPAT (NCBI reference sequence,
NM_001103286), AGPS (NCBI reference sequence, NM_001206719), and FAR1 (NCBI reference sequence,
NM_001099032) in the POA (n = 5) and ARC&ME (n = 5) tissues. Details of primers are provided online in
Supplementary Table S5.
We used previously reported RT-qPCR methods26 to compare the mRNA expressions of GNPAT, AGPS, and
FAR1 in young and old POA and ARC&ME tissues using specific primers (details of primers are provided online
in Supplementary Table S6), the CFX96 real-time PCR System (Bio-Rad, Hercules, CA, USA), Power SYBR Green
PCR Master Mix (Thermo Fisher Scientific), a six-point relative standard curve, no-template control, and no
reverse transcription control. The expression of each enzyme was normalised against the geometric mean of the
expression of two house-keeping genes, tyrosine 3-monooxygenase/tryptophan 5-monooxygenase activation pro-
tein zeta (YWHAZ; NCBI reference sequence, NM_174814.2) and succinate dehydrogenase complex flavoprotein
subunit A (SDHA; NCBI reference sequence, NM_174178.2). The two housekeeping genes were reported for
ewe’s hypothalamus27 and presented 100% homology with the respective bovine genes.
Additionally, we used previously reported RT-qPCR methods26 to compare mRNA expression of GPR61
(NCBI reference sequence, NM_001038571) in young and old anterior pituitaries using the reported. The expres-
sion of GPR61 was normalised against the geometric mean of the expression of two housekeeping genes, glyc-
eraldehyde-3-phosphate dehydrogenase (GAPDH; NCBI reference sequence, NM_001034034) and RAN binding
protein 10 (RANBP10; NCBI reference sequence, NM_001098125).
Statistical analysis. Data were analysed using StatView version 5.0 for Windows (SAS Institute, Inc., Cary,
NC, USA). The Shapiro–Wilk or the Lilliefors test was used to evaluate the normality or log-normality of each
variable, respectively—all variables were normally distributed. We used Via Grubb’s test and verified that there
were no outliers for any of the variables. Differences in LH or FSH concentrations were analysed using one-
factor analysis of variance, with post-hoc comparisons performed using Fisher’s protected least significant dif-
ference test. We compared the measured values obtained from young and old brains using two-tailed unpaired
t-tests. The level of significance was set at P < 0.05. Data are expressed as means ± standard errors of the mean.
Scientific Reports | (2021) 11:4757 | https://doi.org/10.1038/s41598-021-84306-6 9
Vol.:(0123456789)www.nature.com/scientificreports/
Figure 5. Graphical abstract based on the obtained data and speculation on the relationship between EPl,
its biosynthesis enzymes (GNPAT, AGPS, and FAR1) in the anterior hypothalamus containing POA or the
posterior hypothalamus containing ARC&ME, and gonadotroph, shown as small dots in the anterior pituitary
or as enlarged circle, including the GnRHR, GPR61, and FSH and LH secretions. Red circle numbers (24,
26, and 32) indicate the peak numbers of the EPl molecular species, which were higher in old than young
hypothalami. In addition, the blue circle numbers (3, 9, and 25) indicate the peak numbers of the EPl molecular
species, which were lower in old than young hypothalami. The up and down bold black arrows indicate the
increased or decreased levels of each molecules. We have identified 20 EPl molecular species, demonstrated
that the presence of EPl in hypophyseal portal blood was just a speculation, and not evaluated the effect of
each EPl molecular species. Finally, EPl produced in other tissues may possibly act on gonadotrophs. AGPS
alkylglycerone phosphate synthase, FAR1 fatty acyl-CoA reductase 1, POA preoptic area, ARC&ME tissues
arcuate nucleus and median eminence-containing intermediate and posterior hypothalamic tissue, GnRHR
gonadotropin-releasing hormone receptor, FSH follicle-stimulating hormone, LH luteinising hormone.
Data availability
The datasets of the present study are available from the corresponding authors upon reasonable request.
Received: 15 May 2020; Accepted: 12 February 2021
References
1. Kadokawa, H. Discovery of new receptors regulating LH and FSH secretion by bovine gonadotrophs to explore a new paradigm
for mechanisms regulating reproduction. J. Reprod. Dev. 66, 291–297 (2020).
2. Pandey, K., Kereilwe, O., Borromeo, V. & Kadokawa, H. Heifers express G-protein coupled receptor 61 in anterior pituitary gon-
adotrophs in stage-dependent manner. Anim. Reprod. Sci. 181, 93–102 (2017).
3. Hossain, M. S., Mineno, K. & Katafuchi, T. Neuronal orphan G-protein coupled receptor proteins mediate plasmalogens-induced
activation of ERK and Akt signaling. PLoS ONE 11, e0150846 (2016).
4. Kereilwe, O., Pandey, K. & Kadokawa, H. Influence of brain plasmalogen changes on gonadotropin secretion from the cultured
bovine anterior pituitary cells. Domest. Anim. Endocrinol. 64, 77–83 (2018).
Scientific Reports | (2021) 11:4757 | https://doi.org/10.1038/s41598-021-84306-6 10
Vol:.(1234567890)www.nature.com/scientificreports/
5. Braverman, N. E. & Moser, A. B. Functions of plasmalogen lipids in health and disease. Biochim. Biophys. Acta. 1822, 1442–1452
(2012).
6. Takahashi, R., Nakaya, M., Kotaniguchi, M., Shojo, A. & Kitamura, S. Analysis of phosphatidylethanolamine, phosphatidylcholine,
and plasmalogen molecular species in food lipids using an improved 2D high-performance liquid chromatography system. J.
Chromatogr. B Anal. Technol. Biomed. Life Sci. 1077–1078, 35–43 (2018).
7. Osoro, K. & Wright, I. A. The effect of body condition, live weight, breed, age, calf performance, and calving date on reproductive
performance of spring-calving beef cows. J. Anim. Sci. 70, 1661–1666 (1992).
8. Tanco, V. M. et al. Distribution and regulation of gonadotropin-releasing hormone, kisspeptin, RF-amide related peptide-3, and
dynorphin in the bovine hypothalamus. PeerJ 4, e1833 (2016).
9. Nambu, H. et al. Characterization of metabolic phenotypes of mice lacking GPR61, an orphan G-protein coupled receptor. Life
Sci. 89, 765–772 (2011).
10. Yuan, W. et al. An integrated epigenomic analysis for type 2 diabetes susceptibility loci in monozygotic twins. Nat. Commun. 5,
5719 (2014).
11. Nordström, V. et al. Neuronal expression of glucosylceramide synthase in central nervous system regulates body weight and energy
homeostasis. PLoS Biol. 11, e1001506 (2013).
12. Kadokawa, H., Pandey, K., Nahar, A., Nakamura, U. & Rudolf, F. O. Gonadotropin-releasing hormone (GnRH) receptors of cat-
tle aggregate on the surface of gonadotrophs and are increased by elevated GnRH concentrations. Anim. Reprod. Sci. 150, 84–95
(2014).
13. Xie, Y. & Dorsky, R. I. Development of the hypothalamus: conservation, modification and innovation. Development 144, 1588–1599
(2017).
14. Che, H. et al. A comparative study of EPA-enriched ethanolamine plasmalogen and EPA-enriched phosphatidylethanolamine on
Aβ42 induced cognitive deficiency in a rat model of Alzheimer’s disease. Food Funct. 9, 3008–3017 (2018).
15. Che, H. et al. EPA-enriched ethanolamine plasmalogen and EPA-enriched phosphatidylethanolamine enhance BDNF/TrkB/CREB
signaling and inhibit neuronal apoptosis in vitro and in vivo. Food Funct. 11, 1729–1739 (2020).
16. Kereilwe, O. & Kadokawa, H. Bovine gonadotrophs express anti-Müllerian hormone (AMH): comparison of AMH mRNA and
protein expression levels between old Holsteins and young and old Japanese Black females. Reprod. Fertil. Dev. 31, 810–819 (2019).
17. Ferdousy, R. N., Kereilwe, O. & Kadokawa, H. Anti-Müllerian hormone receptor type 2 (AMHR2) expression in bovine oviducts
and endometria: comparison of AMHR2 mRNA and protein abundance between old Holstein and young and old Wagyu females.
Reprod. Fertil. Dev. 32, 738–747 (2020).
18. Ko, J. H. & Kim, S. N. A literature review of women’s sex hormone changes by acupuncture treatment: analysis of human and
animal studies. Evid. Based Complement. Altern. Med. 2018, 3752723 (2018).
19. Kereilwe, O. & Kadokawa, H. Anti-Müllerian hormone and its receptor are detected in most gonadotropin-releasing-hormone
cell bodies and fibers in heifer brains. Domest. Anim. Endocrinol. 72, 106432 (2020).
20. Miyamoto, Y., Skarzynski, D. J. & Okuda, K. Is tumor necrosis factor alpha a trigger for the initiation of endometrial prostaglandin
F(2alpha) release at luteolysis in cattle?. Biol. Reprod. 62, 1109–1115 (2000).
21. Nett, T. M., Cermak, D., Braden, T., Manns, J. & Niswender, G. Pituitary receptors for GnRH and estradiol, and pituitary content
of gonadotropins in beef cows. I. Changes during the estrous cycle. Domest. Anim. Endocrinol. 4, 123–132 (1987).
22. Kamomae, H. Reproductive disturbance. In Veterinary Theriogenology (eds Nakao, T. et al.) 283–340 (Buneidou Press, Tokyo,
2012).
23. Mawatari, S. et al. Identification of plasmalogens in bifidobacterium longum, but not in nifidobacterium animalis. Sci. Rep. 10,
427 (2020).
24. Miyake, K. et al. The Plasmalogen composition of post laying-eggs hen and the production method for edible use. Nihon Chikusan
Gakkaiho 85, 153–161 (2014).
25. Folch, J., Lees, M. & Sloane, S. G. H. A simple method for the isolation and purification of total lipids from animal tissues. J. Biol.
Chem. 226, 497–509 (1957).
26. Pandey, K., Mizukami, Y., Watanabe, K., Sakaguti, S. & Kadokawa, H. Deep sequencing of the transcriptome in the anterior pituitary
of heifers before and after ovulation. J. Vet. Med. Sci. 79, 1003–1012 (2017).
27. Ciechanowska, M. et al. Effect of corticotropin releasing hormone and corticotropin releasing hormone antagonist on biosynthesis
of gonadotropin releasing hormone and gonadotropin releasing hormone receptor in the hypothalamic-pituitary unit of follicular-
phase ewes and contribution of kisspeptin. J. Physiol. Pharmacol. 69, 451–461 (2018).
Acknowledgements
This research was partly supported by a Grant-in Aid for Scientific Research (JSPS Kakenhi Grant Number
18H02329) from the Japan Society for the Promotion of Science (Tokyo, Japan) to H.K.O.K. was supported by
the Ministry of Education, Culture, Sports, Science, and Technology, with the provision of a scholarship.
Author contributions
H.K. conceived the experiments. H.K. and S.K. conducted the experiments. H.K., M.K., and O.K. performed
the analysis, and analysed the results. H.K. wrote the paper. S.K. helped interpret the biological consequences.
All authors reviewed the manuscript.
Competing interests
The authors declare no competing interests.
Additional information
Supplementary Information The online version contains supplementary material available at https://doi.
org/10.1038/s41598-021-84306-6.
Correspondence and requests for materials should be addressed to H.K.
Reprints and permissions information is available at www.nature.com/reprints.
Publisher’s note Springer Nature remains neutral with regard to jurisdictional claims in published maps and
institutional affiliations.
Scientific Reports | (2021) 11:4757 | https://doi.org/10.1038/s41598-021-84306-6 11
Vol.:(0123456789)www.nature.com/scientificreports/
Open Access This article is licensed under a Creative Commons Attribution 4.0 International
License, which permits use, sharing, adaptation, distribution and reproduction in any medium or
format, as long as you give appropriate credit to the original author(s) and the source, provide a link to the
Creative Commons licence, and indicate if changes were made. The images or other third party material in this
article are included in the article’s Creative Commons licence, unless indicated otherwise in a credit line to the
material. If material is not included in the article’s Creative Commons licence and your intended use is not
permitted by statutory regulation or exceeds the permitted use, you will need to obtain permission directly from
the copyright holder. To view a copy of this licence, visit http://creativecommons.org/licenses/by/4.0/.
© The Author(s) 2021
Scientific Reports | (2021) 11:4757 | https://doi.org/10.1038/s41598-021-84306-6 12
Vol:.(1234567890)You can also read