Reducing nitrogen loss - A guide to good management practices
←
→
Page content transcription
If your browser does not render page correctly, please read the page content below
Reducing nitrogen loss
  A guide to good management practices

                Reducing nitrogen loss — A guide to good management practices | 1
For more information visit dairynz.co.nz or phone 0800 4 DairyNZ (0800 4 324 7969)

DairyNZ
Corner Ruakura and Morrinsville Roads
Private Bag 3221
Hamilton 3240

Disclaimer

While DairyNZ Limited (“DairyNZ”, “we”, “our”) endeavours to ensure that the information in this publication is accurate
and current, DairyNZ expressly disclaims any and all liabilities contingent or otherwise to any party that may arise from the
use of the information, or for any error or omission. The information that appears in this publication is intended to provide
the best possible dairy farm management practices, systems and advice that DairyNZ has access to.

©DairyNZ Limited 2014

Copyright

Copyright in this publication (including text, graphics, logos, and icons) is owned or licensed to DairyNZ. Other than for the
purposes of, and subject to the conditions prescribed under, the Copyright Act 1994 and similar legislation which applies
in your location, and except as expressly authorised by these terms and conditions, you may not in any form or by any
means adapt, reproduce, store, distribute, print, display, perform, publish, or create derivative works from any part of this
publication or commercialise any information, products, or services obtained from any part of this publication without our
written permission.

DNZ40-051
Contents
INTRODUCTION 3
How to use this booklet 3
SECTION ONE: Assessing farm peformance 5
Whole farm assessment 5
Comparative stocking rate: matching feed supply and demand 8
SECTION TWO: Understanding nitrogen (N) 9
How N is converted to nitrate 10
Improving N conversion efficiency 11
SECTION THREE: Good management practices for key factors influencing N loss 13
Reducing total N fertiliser applied annually 15
Getting the best response from N fertiliser 18
Grazing cows off in winter 21
Using off paddock facilities 26
Winter crop management 29
Managing effluent systems 32
Culling cows as early as practical in autumn 34
Calculating comparative stocking rate (CSR) 36
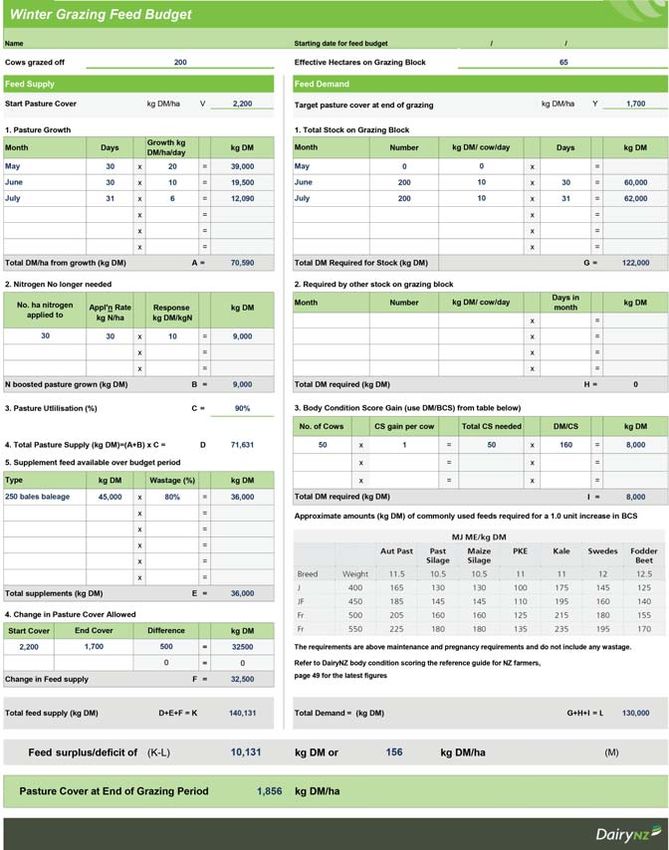
Winter grazing feed budgets 40
Reducing nitrogen loss — A guide to good management practices | 1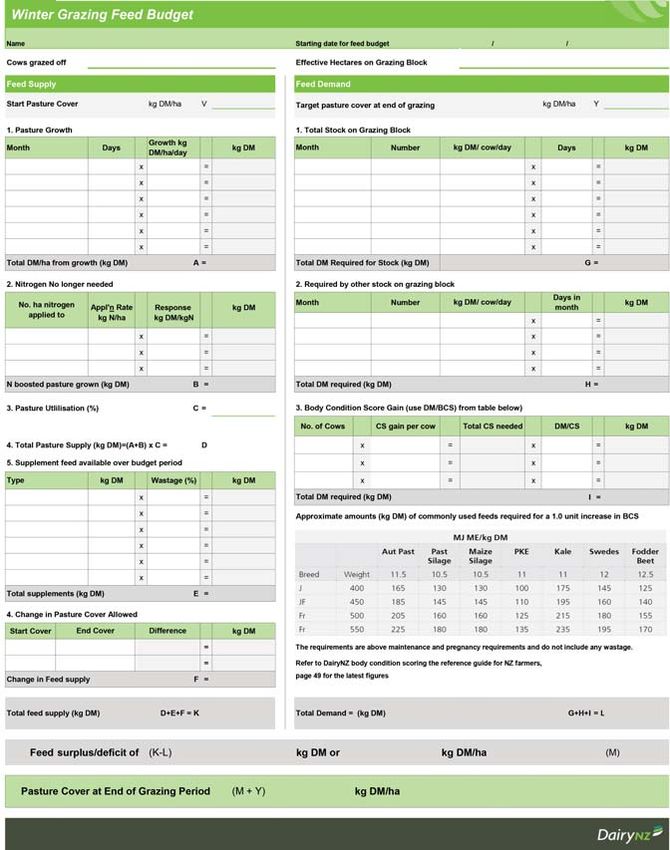
2 | Reducing nitrogen loss — A guide to good management practices
INTRODUCTION

Introduction
The dairy industry is committed to a responsible growth in milk production involving maintaining and improving
water quality to meet community agreed freshwater objectives. On all farms this means that farmers need to use their
nitrogen (N) inputs efficiently and to meet catchment limits. On some farms suitable mitigation options will need to be
found to reduce N leaching further.

The key is for farmers to convert N inputs into product efficiently and profitably while ensuring that N leaching from
their farm is reasonable for their soil and climate.

This booklet is designed to provide farmers and their advisers with a way firstly to evaluate if the farm system is
performing well (i.e. is it optimised?). It then looks at the key factors influencing N loss and describes the likely effects
on the farm system and N loss if changes are made. It provides management guidelines for these key factors.

A key principle is to focus on improving farm performance or efficiency first as this will help improve farm profitability,
thereby providing a way to offset any financial implications if making changes to reduce N surplus and leaching.

How to use this booklet
Before reading this booklet identify your goals and values, i.e. what are the important factors which influence your
farming? What drives this particular farm business? Where may changes be possible?

Section One
In this section some of the key performance ratios for assessing overall farm performance are identified. It is best to
work with an adviser. As regional farm data becomes available, regional benchmarks will be able to be drawn from
DairyBase (the financial and physical data recording and analysis service provided by DairyNZ).

Sections Two and Three look at reducing N surplus and leaching as well as mitigation options.

Section Two
In this section the key factors involved in N management are summarised and the impact areas for reducing N surplus,
and therefore the N available for leaching, are identified.

Section Three
This section provides additional information around the key impact areas and a brief summary you may like to read
before your adviser visits. It also provides additional detailed information to aid in making decisions about mitigation
options you might like to implement.

The information for each mitigation option is divided into four parts as follows:
•    Summary points

•    Likely impact on N leached

•    Key considerations

•    Details.

                                                                   Reducing nitrogen loss — A guide to good management practices | 3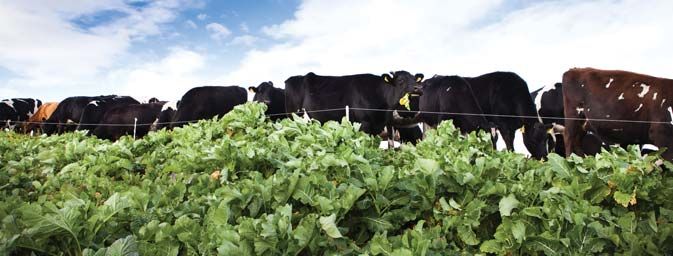
SECTION ONE

Whole farm assessment
The diagram below indicates the importance of assessing performance using all aspects of the farm system and
available data. Although the ratios in Figure 2 are a starting point, a whole farm assessment process should be
considered if farm system changes are being considered. This whole farm assessment process would include looking
at personal and business goals, physical, environmental and financial key performance indicators (KPIs), as outlined in
Figure 1 below.

A view of historical financial and physical performance is provided by DairyBase analysis (levels 1, 2 and 3).
Environmental indicators such as N surplus, N conversion efficiency and N leached are provided by an OVERSEER®
analysis. The effects of changes made can then be compared against the base data. Using farm system modelling
programs is a useful way to evaluate the full effects of any changes.

Investment ratios, such as internal rate of return (IRR) or net present value (NPV) take the time value of money and
depreciation into account and are a better way of assessing capital investments; e.g. an investment into some form of
off-paddock facilities or feeding systems (barns, feedpads, in-shed feeders etc.).

Figure 1. Assessing your farm’s performance

         Physical                                Environmental                              Financial
         •   Cows/ha                             •   N leached                              •   FWE
         •   CSR                                 •   N surplus                              •   Operating profit
         •   MS/cow or /ha                       •   NCE                                    •   Cash surplus
         •   Pasture eaten                       •   Effluent management                    •   ROA
         •   N fertiliser                        •   Fertiliser management                  •   Investment ratios
         •   Supplements                         •   Wintering off                              (IRR, NPV) for system
         •   Six-week in-calf rate               •   Stock exclusion                            changes
         •   MS as % of liveweight               •   SMP

        Key performance ratios, DairyBase physical

                     Overseer, NMP, SMP

                                 DairyBase financial, modelling programmes, whole farm assessment

   CSR: comparative stocking rate, MS: milksolids, NCE: nitrogen conversion efficiency, FWE: farm working expenses,
   ROA: return on assets, IRR: internal rate of return, NPV: net present value, SMP: sustainable milk plan

By taking this approach to assessing overall farm performance, the process of adjusting to N loss limits may in fact become
a positive exercise for the farm business by improving efficiency of resources (feed, fertiliser, water) and profitability.

DairyNZ consulting officers provide a whole farm assessment process as part of the discussion group process.

                                                                   Reducing nitrogen loss — A guide to good management practices | 5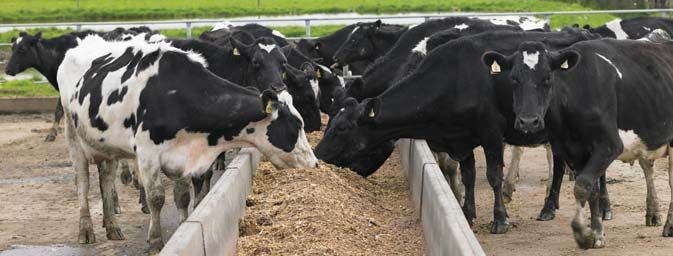
Assessing farm performance
In this section you will calculate some key performance ratios.

Figure 2 is designed to provide an overview of the farm without using DairyBase or OVERSEER®. It provides an
opportunity to compare your current farm performance against other farms in your region and identify any areas that
need further investigation for improved performance and profitability.

Step 1: Determine your farm performance
•    Calculate the key performance ratios on page 7 for your farm. Your adviser can help with this

•    Compare the results with regional averages either provided by your adviser or from the DairyNZ DairyBase system.
     There is space provided to fill in your farms targets

•    This will help you decide if the current resources (i.e. cows, grass, supplements, effluent and fertiliser N, etc.) are
     being used efficiently

•    The key performance ratios in Figure 2 are the ones that will have most influence on N loss. Other key performance
     ratios such as labour productivity and financial KPI’s that are also important to your business are not covered here.

Step 2: Assess farm system impacts
Follow Step 1 with a detailed analysis examining the farm system impacts of changing any ratios that fall outside
the expected ranges for your system type, climate and soil types. Can changes to these ratios improve overall farm
performance?

Farm system models like Farmax, Udder and GSL can help do this effectively across the whole farm system.

Step 3: Assess environmental impact
The environmental impacts of any changes will also need to be assessed in OVERSEER® Nutrient Budgets.

6 | Reducing nitrogen loss — A guide to good management practices
Figure 2. Assessing key performance ratios for your farm.

                                                                                                                                                                                                                           Pasture & crop
                                                                                                                                                                                                                           eaten (tDM/ha)        9.8
                                                                                                                                                                                     Total feed eaten
                                                                                                                                                                                     (tDM/ha)                 12.1
                                                                                                kg MS/cow
                                                                                                                  358                                                                                                      Imported supps
                                                                                                                                                                                                                           (tDM/ha)              1.3
                                                                                                                                                        cow/ha
                                                                                                                                                                       2.51
                                                                                                                                                                                     Total feed offered
                                                                         kgN/ha                 kg MS/ha                        kg Lwt/ha                                            Assumes 80% utilisation 15.1
                                                                                     69                           898                       11.5
                                                                                                                                                                                                                           Grazing off dry
                                                                                                                                                                                                                           cows eaten (tDM/ha)   0.9
                                                                                                                                                        kg Lwt/cow
                                                                                                                                                                       457
                                                                                                kg MS/kgN
                                                                                                                   13

                                                                                                                                                        Comparative SR
                                                                                                                                                        (kg Lwt/tDM offered)    76
                                                                                    Your farm
                                                                                    Region(Tararua Region) Average

                                                                    Figure 2 is designed to provide an overview of the farm without using data from either Dairybase or OVERSEER®. The above ratios have an impact on N loss. Dairybase and
                                                                    OVERSEER® data will provide more information and should be used if available.

                                                                    Some useful guidelines:
                                                                    Comparative stocking rate (CSR) should be in the range 75-80kg Lwt/tDM

                                                                    kg MS/kgN – In this case a higher figure (more than 10) indicates more efficient use of N fertiliser. A figure of less than 6 indicates low MS output per kg N applied.

Reducing nitrogen loss — A guide to good management practices | 7
Comparative stocking rate: matching feed supply and demand
The comparative stocking rate (CSR), measured as kg liveweight/tonne dry matter (kg Lwt/t DM) offered, is a method
of assessing the balance between feed demand and supply on farm and it provides an alternative to the traditional
measure of cows per hectare (cows/ha). Farms now import significant amounts of supplements, or have different breeds
(e.g. Holstein Friesian versus Jersey), and cows/ha is an inadequate description of this balance, and can be misleading
when comparing farms.

Calculating the CSR is an essential step in determining the feed balance of your farm (see p.35). It will need to be
recalculated every time changes are made to the farm system.

A research farmlet trial identified the CSR to maximise operating profit/ha. It is less than the CSR required to maximise
milksolids/ha (see Figure 3). Five herds were compared over a range of CSR from 60 to 91kg Lwt/t DM for three years.
Operating profit was maximised at a CSR of 76, while MS/ha was maximised when CSR was 91. Figure 3 shows that the
drop in profitability was not large for CSR on either side of the optimum.

Milksolids production per cow is very responsive to reduced CSR and research farmlet trials confirm the likelihood of
maintaining total production levels with fewer cows. This will depend on the skills of the farmer. The impact of CSR
on profit is less clear because it depends on how CSR is changed, and on the farmer’s ability to take costs out of the
system when reducing CSR.

Aiming to get close to the optimum CSR of 75-80 will help to improve profitability.

Figure 3. The relationship between CSR, operating profit /ha and MS production /ha from farmlet trials near Hamilton,
1998-2001

                                                                             Max. Milk

                                                                                             1200
                                                        Max. Profit
                               4700
                                                                                             1150
                               4200
                                                                                             1100
     Operating profit ($/ha)

                                      OP ($/ha)
                               3700                                                                  Milksolids (kg/ha)
                                                                                             1050
                               3200
                                                                                             1000
                               2700
                                                                                              950

                               2200                                                           900

                               1700    MS/ha
                                                                                              850

                               1200                                                           800
                                       60         70        76          89        91

                                                       CSR (Lwt/t DM)

8 | Reducing nitrogen loss — A guide to good management practices
SECTION TWO
Understanding nitrogen (N)
N conversion efficiency, N leaching and N surplus, are measures of how well nutrients are used on farm and they
highlight where improvements can be made.
N conversion efficiency (NCE) describes the percentage of N going into a farm (N inputs) that is converted to N in
saleable product (N outputs). NCE equals N output divided by N input and is expressed as a percentage1.
N surplus is the nitrogen that remains after the conversion of N inputs to saleable product, such as milk, meat, and
supplements sold off the farm, (N inputs - N outputs = N surplus) . The N surplus is mostly what is excreted by animals
in urine and dung.
N leaching2 is related to the N surplus. The amount of N leached is influenced by both farm management and non-
management factors such as the volume of rain and some soil characteristics.
Every dairy farm has unique characteristics that will influence its N leaching risk. These can be physical factors, such as
soil types and climate, or farm management factors, such as stocking rate, N fertiliser use, pasture and imported feed
use, and pasture types. Figure 4 illustrates where management and physical factors can make a difference.
Figure 4. Relationship between N conversion efficiency, N surplus and N leaching
N inputs less N outputs N surplus
High
N inputs N outputs
Fertiliser N Milk N
Imported feed N Meat N N
N in soil
Clover N fixation Feed N leached
Herd Urine and Rainfall &
efficiency dung N soil type
&N + excess
Low conversion fertiliser N
Impact of
N inputs
on N
surplus Farm management Farm management Farm location
• Matching feed supply • Timing and rate of N
and feed demand fertiliser applied
• Stocking rate • Recycling N through
• Calving date applied effluent
• Replacement rate • Strategic standing-off
• Pasture and supplement • Wintering-off
eaten and wasted
• N content of feed eaten
1
NCE= N outputs in saleable products x100%
Sum of N inputs
2
N is leached from soil in the nitrate form so is also called nitrate leaching
Reducing nitrogen loss — A guide to good management practices | 9How N is converted to nitrate
The diagram below illustrates the nitrogen cycle, the processes by which N is converted from one form to another; from
organic N to inorganic forms of N (ammonia, nitrate). Nitrate N is the form of N that causes the issues when leached.
Figure 5. The nitrogen cycle
and released bac
by stock k int
Eaten o th
e sys
tem
Urea manure Most N fertilisers
Rotting plants and (DAP SOA)
animals Clover fixation Volatilastion Denitrification
Uptake by plants
Organic Ammonium Nitrite Nitrate
nitrogen (NH4+) (NO2-) (NO3-)
M in e r a lis a t i o n N i trifi c a ti o n
Leaching
Mineralisation (organic N to ammonium)
Organic N is the N contained within organic matter such as animals, plants, dung and urine. Plants cannot use organic
N until it has been broken down into a mineral form of N (ammonium). This is done by microbes in the soil and the
process is called mineralisation.
Nitrification (ammonium to nitrate)
Nitrification is the process by which bacteria in the soil transform ammonium to nitrate through the addition of oxygen
(oxidisation). Nitrification occurs all year round in most New Zealand soils. This generally means that N does not stay in
the soil in large quantities as ammonium or nitrite before being converted to nitrate.
Nitrate leaching
Nitrate is mobile and highly soluble. It can be readily leached if there is too much available in the soil for the plants to
take up. Leaching is the downward movement of soluble nitrate through the soil with water (drainage). If this happens,
during conditions favourable to leaching, nitrate may be lost below the plants root system, through the soil profile to
groundwater.
Volatilisation and denitrification
Volatilisation and denitrification are the processes by which N is lost to the atmosphere as a gas (ammonia, nitrous
oxide or N gas). Denitrification occurs in wet or waterlogged soils (e.g. in winter) and volatilisation tends to occur
during drier warmer conditions (e.g. spring, summer and autumn). These pathways are a minor component of N losses.
10 | Reducing nitrogen loss — A guide to good management practicesImproving N conversion efficiency
A number of factors can result in low N conversion efficiency. These include:
• Low N output in milk relative to N input
• High N fertiliser use or feed input per ha for the kg MS produced per ha
• High proportion of N fertiliser applied in months with low pasture growth response and high rainfall
• Low feed conversion into milk by the herd
• N from the effluent system is used poorly to replace fertiliser N and to grow feed on the farm.
Low cost solutions
Improved feed conversion
Common reasons for low feed conversion are a high proportion of:
1. Feed being used for maintenance of cows – either too many cows or too few lactation days relative to days dry.
2. Feeding too many replacements.
Improving feed allocation means that more of the right feed is fed in the right amounts, at the correct time, to the
most efficient cows. This is achieved by:
• Reviewing stocking rates, and calving (and drying off) dates (see section on CSR, p.7)
• Reducing the time that cows are on the farm but not producing milk going into the vat,
e. g. cows being treated for mastitis, late calving cows or cows dried off early.
Better N fertiliser management
See “Reducing total N fertiliser applied annually” p.15.
Time off pasture to manage recycling of dung and urine
See “Using off paddock facilities to reduce N loss” p.26.
Better effluent management
See “Managing effluent systems” p.32.
Reducing nitrogen loss — A guide to good management practices | 11Relative significance of factors that influence NCE
Table 1 below outlines the expected impact of a number of factors on NCE. It is not always possible to accurately
predict the response to changing one of these factors as there are a number of interconnected parts. It is therefore
extremely critical that any farm changes are considered across the whole farm system and evaluated for impacts on
profit as well as impacts on NCE and N leaching.
A high MS/ha, or MS/cow, does not always mean more profit. Before targeting these to improve NCE, impacts on
profitability for the whole farm system should be considered. Likewise high producing farm systems with high N inputs
and high N outputs can have a high NCE but also still have high values for N leaching.
Research and various farm reviews have, however, shown that in general these responses in Table 1 are the most
likely responses.
For all farmers the focus should be on improving NCE without excessive N leaching while maintaining and/or enhancing
profit. This can be achieved by optimising the efficiency of the farmer’s chosen system.
Table 1. Ranking of factors that influence N conversion efficiency (NCE).
Ranking Factors Input Likely change Application on farms
Annual N fertiliser rate High Increased N fertiliser usually On many farms increased N fertiliser is likely to
1
applied (kg/ha) reduces NCE. increase N leaching.
MS/ha or MS/cow Medium Increased MS/ha or MS/cow Increased MS/ha is also likely to increase N
2 usually increases NCE. leaching per ha unless done without increasing
total N inputs.
Cows/ha Medium Increased cows/ha slightly Where farms are still developing and increas-
increases NCE. ing pasture production, stocking rate increases
3 accompanied by MS/cow increases should
improve NCE. However N leaching may also
increase unless total N inputs are kept constant.
Wintering-off Low More wintering off has This only applies to the milking platform, and
slight beneficial effects on may not reduce the N leached/ha if the land
4
NCE. area where the cows are wintered is also
included in the assessment.
N content in feed Low Lower feed N in imported Requires a significant substitution of a high
feed can improve NCE. protein supplement with a lower protein
5
supplement such as maize silage to reduce the
surplus N intake of cows.
Where catchment limits are in place the focus will be on meeting the farm’s N leaching limit, and being profitable
within that limit. The suggested first step is to review factors that can affect NCE and that can reduce the N surplus;
then mitigate the amount of loss from any remaining N surplus (see p.9 Figure 4).
12 | Reducing nitrogen loss — A guide to good management practicesSECTION THREE
Good management practices for
influencing N loss
This section outlines the key strategies which will impact on N loss (nitrate leaching).
The main points from each of these strategies are summarised below.
Reducing total N fertiliser applied annually (page 15)
• Reducing annual N fertiliser use per ha potentially reduces a farm’s N surplus and therefore N leaching. Annual
pasture production per ha will also be reduced
• Research results show a diminishing DM response to N fertiliser at annual rates above 200kg N/ha. The research
also demonstrated that annual rates above 200kg N/ha could not be justified economically due to the high cost
associated with harvesting the extra grass grown
• At annual rates of less than 200kg N/ha research shows that MS production will drop by approximately 1kg for
every kg of N fertiliser not applied
• To manage reductions in N fertiliser where less than 200kg N/ha is used requires appropriate farm system changes
to ensure profit is maintained
• Reduced N leaching will be greater on farms where applied N use is high relative to milksolids production (i.e. less
than 6kg of MS/kg N)
• There is a wide range in efficiency of N fertiliser use on dairy farms, as indicated by the ratio kg MS produced per kg
N applied.
Getting the best response to N fertiliser (page 18)
• Avoid direct leaching associated with applying in winter and to waterlogged soils
• Optimise response rates and pasture utilisation
• Ensure other nutrients are not limiting
• N is a cost effective way of increasing feed supply.
Grazing cows off in winter (page 21)
• Grazing cows off the farm during winter will reduce the N leached on the milking platform and can have positive
physical effects on soils and pasture grown
• Wintering-off will mean there is more feed on farm at the planned start of calving (PSC) unless the calving and/or
drying off dates change, or changes are made to the amount of supplements or N used
• If pasture covers are higher at the PSC then it will be possible to feed cows better through the early stages of
lactation and/or reduce supplement use
• Grazing-off during winter should be evaluated by comparing the milk price and extra production versus grazing costs.
Reducing nitrogen loss — A guide to good management practices | 13Using off paddock facilities (page 26)
• Off paddock facilities, such as feed pads and stand-off pads, can be used to reduce N loss by intercepting the N
from dung and urine
• The mitigation opportunity is greatest over autumn, where N deposited will be at risk of leaching over the coming
winter months
• Restricting grazing to 8 hours a day over the autumn/winter period, without supplementary feeding, has been
shown to have no impact on production, but has the potential to reduce N leaching by 15-20%
• Use of off pasture facilities may cause animal health and welfare issues, in particular where existing structures were
not designed to hold cows for extended periods. If off pasture facilities result in intensification (i.e. more feed is
used), then more N may be introduced into the system and undo the environmental benefit
• Off pasture facility construction is a capital intensive process and appropriate long term budgeting techniques are
required to ensure that the cost benefit ratio is positive.
Winter crop management (page 29)
• Mineral N leaching can be reduced by minimal or no tillage establishment methods
• Urine N leaching can be reduced through paddock selection, forage crop selection, grazing timing and regime
• Timing and placement of fertiliser applications can affect leaching. The use of crop calculators and precision
application can ensure appropriate timing and application
• Winter fallow leaching can be reduced though the use of a cover crop or cultivating as late as possible.
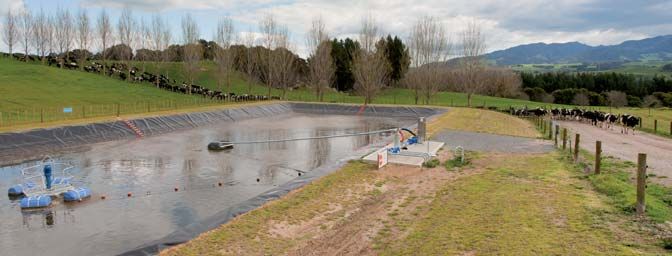
Managing effluent systems (page 32)
• Application rates (depth of applied effluent) should be low enough to prevent losses of nutrients below the root zone
• Storage ponds/tanks should be of sufficient size to prevent the necessity of irrigating onto wet soils and to allow for
easier management of farm dairy effluent (FDE) systems during busy times of the year. Storage ponds/tanks must be
sealed (i.e. not leak)
• Efficient water use and rainwater diversions can significantly reduce the FDE storage requirement
• Effluent blocks should be sized correctly to ensure efficient use of nutrients.
Culling cows early in autumn (page 34)
• This will remove some urinary N from pasture during a risk period
• It will also reduce feed demand
• This may allow a reduction in fertiliser application or imported feed
• Before introducing you need to compare the lost milk production and revenue against saved costs.
Calculating Comparative Stocking Rate (page 36)
• Comparative stocking rate (CSR) calculated as the kilogram liveweight per tonne of dry matter (kg Lwt/t DM)
offered, is a method of assessing the balance between feed demand and supply on farm
• Getting CSR as close to optimum as possible increases feed conversion efficiency and helps reduce N surplus
• Getting as close as possible to the optimum of 75-80 will help improve profitability.
14 | Reducing nitrogen loss — A guide to good management practicesReducing total N fertiliser applied annually
• Reducing annual N fertiliser use per ha potentially reduces a farm’s N surplus and therefore N leaching.
Annual pasture production per ha will also be reduced
• Research results show a diminishing DM response to N fertiliser at annual rates above 200kg N/ha. The
research also demonstrated that annual rates above 200kg N/ha could not be justified economically due the
high cost associated with harvesting the extra grass grown
• At annual rates of less than 200kg N/ha research shows that MS production will drop by approximately 1kg
for every kg of N fertiliser not applied
• To manage reductions in N fertiliser where less than 200kg N/ha is used requires appropriate farm system
changes to ensure profit is maintained
• Reduced N leaching will be greater on farms where applied N use is high relative to milksolids production
(i.e. less than 6kg of MS/kg N)
• There is a wide range in efficiency of N fertiliser use on dairy farms, as indicated by the ratio kg MS produced
per kg N applied.
Likely impact on N leached
The direct impact of fertiliser N applications on N leaching is low unless N is applied to wet soils or when heavy rain is
imminent. Most N leaching occurs from urine patches during winter drainage events, not from applied N fertiliser.
Data from dairy farms in the lower North Island area however showed that for every kg of N fertiliser added per ha, the
N surplus increased by 0.9kg/ha. This is because the indirect impacts from applying N fertiliser are significant. The use
of N fertiliser typically results in increased stocking rates, more feed eaten per ha, and more urine patches with higher
concentrations of N in urine.
A reduction in N fertiliser application will therefore indirectly decrease a farm’s N surplus and therefore N leaching,
provided efficient milksolids production (kg MS/kg N applied, kg MS/kg DM) is maintained from the reduced N input. A
10 year farmlet trial near Hamilton measured a reduction in N leaching from 35 to 20kg N/ha/year (40% reduction) by
reducing N applications from 180kg N/ha/year to none.
Reducing nitrogen loss — A guide to good management practices | 15Key considerations
Modelling of appropriate farm system changes when N fertiliser is reduced is needed to ensure profit is maintained.
Ratio of milk price to the cost of N
The ratio between milk price and the cost of applying N is an important indicator of the likely profitability of N use.
Building a farming system dependent on high levels of N fertiliser use does not guarantee high profitability. In the past
decade there have been times when a low milk price and high N cost (milk price less than $5.50/kg MS, and N applied
$2.20/kg) has meant that the ratio was unfavourable for the profitable use of N. When the ratio is favourable, good
management practices are needed to ensure N fertiliser is used effectively, and applied so that the extra feed generated
is eaten by the herd and converted efficiently into milksolids.
Use of extra feed
Applying N to provide additional pasture growth that remains uneaten, or has to be converted to hay or silage
through more expensive harvesting and feeding out processes, is undesirable if these surpluses are not part of the
normal farm system.
Research results show a diminishing DM response to N fertiliser at annual rates above 200kg N/ha. The research also
demonstrated that annual rates above 200kg N/ha could not be justified economically due the high cost associated with
harvesting the extra grass grown.
Figure 6 illustrates the diminishing response of MS/ha as N application increased. This graph indicates that 1.13kg MS
was added per kg N applied up to 219kg N applied. Between 219 and 319 kg N applied only 0.34kg MS was added
per kgN.
Figure 6: The relationship between annual N applications /ha and kg MS/ha
1600
y = 1.13x + 1008.3 y = 0.34x + 1244.4
1400
1200
1000
kg MS/ha
800
600
400
200
0
0 50 100 150 200 250 300 350
kg N applied
Comparing the ratio of kg MS per ha and kg N applied per ha with other similar farms will provide a guide to how well
applied N is contributing to the production system. If there is a low ratio of kg MS produced per kg N/ha for your farm
(less than 6kg MS/kgN) it is more likely that N fertiliser can be reduced without impacting negatively on profit.
Timing
The timing of fertiliser N applications can influence the amount of N leached. Winter applications of N, when pasture
growth is low and drainage of water through the soil is high, will result in increased N leaching from applied fertiliser.
The discontinuation of N applications in winter, when compared with any other time of the year, will most likely
improve the efficiency of use of applied N and reduce N leaching, while having minimal impact on pasture production.
16 | Reducing nitrogen loss — A guide to good management practicesDetails
Less annual pasture grown
Annual pasture production per ha will most likely be reduced with less N applied so adjustments need to be made to
feed demand and feed supply to keep the CSR within the 75-80kg Lwt/t DM range and also adjusting calving date so
that calving is no earlier than 60 days prior to spring balance date.
The reduction in annual pasture yield will depend on the N response achieved (extra kg DM grown per kg N applied). At
a response rate of 10kg DM/kg N applied using 100kg N/ha less will result in 1 tonne DM/ha less feed, which requires a
reduction in 0.18 cows/ha (450kg liveweight).
Be sure you understand the N response rates and time of application for your region. For example in a 10 year farmlet
trial the response was an extra 16kg DM/kg N applied. Removing 180kg N/ha of fertiliser reduced pasture production by
2.8 tonnes DM/ha/year .
Changes to feed demand/supply balance and comparative stocking rate
The adjustment to the feed demand/supply balance in the farm system because of a 1 tonne DM/ha reduction in
pasture yield can be estimated using the comparative stocking rate (CSR). A calculator is available on the DairyNZ
website to assist with this process (dairynz.co.nz/csrcalc) and an example calculation is provided on page 36.
Buying imported supplement to replace N fertiliser
When reducing N, farmers could choose to replace the feed not grown by purchasing the equivalent amount as
supplement, e.g. 1 tonne DM/ha reduction in pasture grown could be replaced by 1 tonne DM/ha of maize silage. The
impact of doing this on the farm’s N surplus needs to be considered. While maize silage is considered a low N content
feed, it still contains 10kg N in every tonne DM. 100 tonnes of maize silage DM is equivalent to adding 1000kg N to
the farm’s N input.
The use of supplementary feed also requires a whole farm financial analysis as there are costs related to its purchase,
storage and feeding. You also need to be sure that milk production levels can be maintained by using a supplement
instead of N boosted pasture, as key components of a supplement, such as energy values and protein content, will
differ from pasture. For example 1 tonne DM of maize silage contains approximately 1000 MJME less than one tonne
of N boosted spring pasture. The timing of supplement use in relation to seasonal feed supply will also influence the
production response and its economics.
Supporting information/tools
See Comparative Stocking Rate p.8 and p.36
Comparative Stocking Rate calculator – dairynz.co.nz/csrcalc
Reducing nitrogen loss — A guide to good management practices | 17Getting the best response from N fertiliser
• Avoid direct leaching associated with applying in winter and to waterlogged soils
• Optimise response rates and pasture utilisation
• Ensure other nutrients are not limiting
• N fertiliser is a cost effective way of increasing feed supply.
Likely impact on N leached
The application of N fertiliser results in an increase in feed grown which can be converted into milk, but more feed
going through the cow will increase the N leached relative to using no N. Optimising the response rates to N fertiliser
will reduce N leaching by requiring less fertiliser per kg DM produced. Also if the extra pasture grown can fill feed
deficits (thereby improving animal/farm efficiency) and when N is utilised well, the efficiency of N will be maximised.
Avoid direct leaching by minimising or eliminating late autumn/winter use when drainage occurs more often and
responses are lower. Also, avoid applications prior to heavy rainfall or irrigation as the more water flowing through the
soil profile the greater the risk of leaching.
Late autumn/winter use can also increase cow grazing days in this period which also increases N loss.
Key considerations
Make sure your N fertiliser is used efficiently by ensuring high response rates and utilisation of extra feed such as
during a feed deficit period. However as N fertiliser increases the feed grown per ha it also increases the amount of N
processed by the cow if eaten. This increases the N surplus per ha as N is not used with 100% efficiency in the animal.
If considering reducing N fertiliser, and hence the feed supply, ensure you quantify the impact and alter the feed
demand as required.
18 | Reducing nitrogen loss — A guide to good management practicesTable 2. Impact of pasture growth on response rates to N fertiliser (N applied at optimum rates)
Pasture growth Response Time for full response
Pasture growth rate
(kg DM/ha/day) (kg DM/kg N) (weeks)
Slow 10 5 10-14
Moderate 20-40 10 6-8
Fast 50-70 15 5-6
Rapid 80 20 3-4
See DairyNZ Farmfact 7-10 Nitrogen fertiliser
Details
Response rates are governed by a number of factors including: timing and rate of application, availability of other
nutrients, pasture condition and rainfall. These factors are outlined in detail below.
Table 3. Factors which will affect the response to N fertiliser
Likely responses
Factor High Low
Prevailing growing conditions good poor
Season spring winter
Weather conditions rain freezing/drought
Soil water adequate waterlogged
Soil temperature 6oC to 17oC less than 6oC or greater than 17oC
Application rate 20 to 40kg/ha greater than 60kg/ha
Other nutrients (P,K,S) optimal levels less than optimum
less than 5.8 or greater than 6.0
5.8-6.0 (mineral soils) (mineral soils)
pH
5.0-5.5 (peat soils) less than 5.0 or greater than 5.5
(peat soils)
N available from other sources inadequate adequate
Feed supply and interval to next grazing (round length) inadequate adequate
Sward conditions and composition ryegrass weed grasses, pugged
Product used correct for weather conditions
Reducing nitrogen loss — A guide to good management practices | 19N fertiliser is a growth multiplier; when pasture growth rates are high the response to N will be higher, with greatest
response rates achieved in spring. There are lower response rates in autumn nevertheless fertiliser N may still provide
the lowest cost feed source. Early winter applications give the lowest growth responses and are most likely to lead to
direct leaching of fertiliser N. During a dry summer N may be lost through volatilisation before it can be utilised and
plant growth restricted. All forms of N produce the same amount of dry matter per kg N, if applied correctly.
It is important to avoid application to waterlogged soils or before heavy rainfall. Ensure adequate soil moisture and
optimal temperatures (6-17°C).
Efficiency begins to decrease at rates about 60kg N/ha hence application rates of 20-40kg N/ha are recommended for
grazing. All other nutrients need to be at optimum levels to allow optimal pasture growth and therefore response rates.
Remember, for every 1kg N applied as urea, about 1kg lime is required to neutralise acidity. Avoid grazing between 4
and 14 days post application as this leads to high N intake and excretion by grazing animals. When using N, canopy
closure will typically occur at a lower leaf stage. Ideal pre-gazing yields of 2600-3200 are recommended with grazing
residuals of 7-8 clicks on a rising plate meter.
Ensure feed demand and supply is aligned to ensure high utilisation of pasture is achieved. Use the following
monitoring and management methods:
• Strategic: feed budgeting, stocking rate
• Tactical: monitoring – farm walks, pasture wedge
• Operational: pre-gazing covers, residuals, pasture utilisation.
Nitrogen responses will be greater in ryegrass dominant swards. Spring and autumn applications promote increased
tillering and vegetative growth. For more information see the pasture renewal guide (search: pasture renewal guide on
the DairyNZ website dairynz.co.nz) and the Forage Value Index (dairynzfvi.co.nz)
Growth promoters such as Gibberellic acid promote leaf and sheath elongation but are not substitutes for fertiliser.
Generally, the response when used with N is additive and it should be used in spring to fill a feed deficit and in autumn
to stimulate growth before winter which will utilise some N.
Clover contributes 170 to 220kg N/ha/yr at 30-40% content in the sward. N fertiliser reduces N fixation by clover by
about 1kg N/ha/yr for every 3kg N fertiliser applied. Although spring applications of N fertiliser affect clover N fixation
less than other times of the year, high growth rates at this time of year also means that clover can be out competed
resulting in less clover in the sward.
Response rates achieved on farm could be assessed with simple trials such as covering an area of the paddock with a
canopy when fertiliser is being applied, or applying N fertiliser to half of the paddock and assessing the difference in dry
matter production at grazing time.
Supporting information
DairyNZ Nutrient management on your dairy farm.
DairyNZ Technical Series: Issue 12, October 2012, p.2. Fertiliser use: response to nitrogen and phosphorous
DairyNZ Farmfacts
7-1: Plant nutrition
7-2: Determining fertiliser nutrient requirements
7-5: Critical nutrient levels for pasture
7-10: Nitrogen fertiliser
7-11: Seasonal nitrogen use
7-16: Nitrogen use going into summer
7-17: Nitrogen use after a dry summer
7-23: Minimising nitrogen loss
20 | Reducing nitrogen loss — A guide to good management practicesGrazing cows off in winter
• Grazing cows off the farm during winter will reduce the N leached on the milking platform and can have
positive physical effects on soils and pasture grown
• Wintering-off will mean there is more feed on farm at the planned start of calving (PSC) unless the calving
and/or drying off dates change, or changes are made to the amount of supplements or N used
• If pasture covers are higher at the PSC then it will be possible to feed cows better through the early stages of
lactation and/or reduce supplement use
• Grazing-off during winter should be evaluated by comparing the milk price and extra production versus
grazing costs.
Likely impact on N leached
Wintering cows off will reduce the N leached from the milking platform because one of the key contributors to N
entering the soil (and therefore becoming susceptible to leaching) is urine deposited by cows.
There may be a reduction in the effectiveness of this strategy due to feed saved on farm being used in some other way.
For example, wintering-off also allows a change to milking later in autumn or calving earlier in spring. These options
will both mean more N leached at these times, offsetting some of the gains made from wintering-off.
If by wintering-off, less N is used and less feed is grown and used on the milking platform, then this will reduce N
leached; however the overall impact on profitability will also need to considered.
Grazing-off is not a solution at a catchment level unless winter grazing is in a different catchment.
Key considerations
Grazing cows off in winter is a major change to the farm system which can bring a number of potential benefits. It
means feed that otherwise would be needed during this period can be used in other ways potentially increasing farm
income, particularly if it is used to increase milk production.
There are, however, risks (see p. 24 other considerations) to manage and the effects on the overall farm system needs
to be considered. The net benefit from a financial perspective will depend on the cost of grazing versus the return from
the extra feed available on the milking platform for milking cows (see worked example in Table 4).
Reducing nitrogen loss — A guide to good management practices | 21Table 4. Value of feed saved at different milk prices
Number cows grazed off 100
Feed saved/cow/day 10 kg DM
Number of days 61
Feed saved (available for extra days in milk) 61,000 kg DM
Addition revenue
Milk price ($/kgMS) $6.00 $7.00 $8.00
Utilisation of saved feed
100% $28,154 $32,846 $37,538
90% $25,338 $29,562 $33,785
80% $22,523 $26,277 $30,031
Assumes a conversion factor of 13kg DM/kgMS or approx. 80g MS/kg DM
Excludes costs of wintering-off.
22 | Reducing nitrogen loss — A guide to good management practicesDetails
On farm options if utilising grazing-off
Milk longer in autumn
If all of the feed saved by grazing-off is used for milk production then there will be little reduction in N leached as the
total feed, and therefore N going through the cow has not changed.
Milking longer into the autumn increases the urine N loading in the soil prior to the winter period which is the higher
risk period for leaching. There is also more risk attached to milking longer in autumn as dry years could reduce your
ability to continue milking.
Calve earlier
Farm modelling shows that the impact on profit of moving your calving date a few days either way, either earlier or
later than currently, does not change profit that much.
However, especially in summer dry areas, the more production gained before the onset of summer the better, as it will
reduce the influence of summer/autumn dry spells on total production. Calving earlier to utilise extra feed will generally
be a better option and will have less negative implications for N loss than milking longer in the autumn.
Reduce N fertiliser
Applying less N will have the biggest impact on N leached although this is an indirect effect of feed grown and used.
Assuming 30kg N/ha is normally applied in April and August to build feed for winter and spring and average response
rates of 10kg DM/kg N and 15kg DM/kg N respectively, grazing off 100 cows as in Table 4 could mean it is possible to
reduce the area N is applied to by 80ha. This is calculated as follows:
80ha × 30kg N/ha × 10kg DM/kg N = 24000kg DM plus 80ha × 30kg N/ha × 15kg DM/kg N = 36000kg equals 60,000kg
DM in total removed (the same amount “saved” by grazing-off). In this case, a total of 4.8 tonne less N can be used.
Fewer supplements used
There may be opportunities to decrease the bought in supplements. For example, an extra 300kg DM/ha at PSC is
equivalent to needing 2.2 to 2.3 less bales per ha (150kg DM/bale) when differences in quality and utilisation are
factored in. The impact of this on N surplus will depend on a number of factors:
• Is the baleage still made but sold off the farm instead?
• Does this mean less N is used?
• What type of supplement is being used and will its nitrogen content be different from pasture?
Usually changes in feed N content will only have a small impact unless large amounts of supplement are used and/or
the feed crude protein levels are very different. The cost effectiveness of the supplement on an energy basis is the most
important criteria for selecting supplements.
Increase cow numbers
If winter grazing is being used to reduce the N leached then increasing the number of cows milked may increase the N
leached. This will need to be checked in OVERSEER®.
Reducing nitrogen loss — A guide to good management practices | 23Other considerations when grazing-off
Reduced pasture damage and wastage
Grazing-off can increase the amount of pasture grown during winter. If you don’t have to feed out or graze pastures
in very wet conditions then wastage will be reduced and the soil compaction and pugging from stock or machinery
(feeding out) will also be reduced.
It is important to ensure that when cows leave the farm pasture covers are low enough to prevent pasture losses from
death/decay before the cows return.
Grazing contract terms
Experience has shown that wintering off works best when there is a written agreement that covers at least the
following points and there is good communication and regular farm visits along the way, especially when the
arrangement is a new one. It takes time to ensure everyone is clear on expectations.
1. Duration and type of contract
• Will the agreement be based on a feeding rate (e.g. cents per kg DM/cow/day) or a flat rate (e.g. $/cow/week)?
How will performance be checked or measured?
• How much will be paid, due date, recourse if not performing?
• What happens if there is a flood, snowfall or other event that impacts on feed supply? What is the grazier
responsible for?
2. Feed/supplements
• What type, quantity and quality? When will they be fed and at what rates? (this includes saved pasture).
• How will dry matter percentage (DM%) and energy (MJME/kg DM) be assessed and allocated? Does the grazier
pasture score/understand kg DM?
• Will there be sufficient feed to meet your winter grazing requirements as well as the pasture cover required by
the grazier at the end of the contract period? (see p.40 for an example feed budget).
• Can the grazier feed different mobs different amounts, meaning you will achieve minimum body condition score
targets? Who will monitor stock condition and determine if feeding rates are adequate?
NB: the feed quality will impact on the amount needed and the live weight gain achieved. For instance, stock
requiring 10kg DM of good quality pasture (11 MJME/kgDM) will need 10% more pasture DM fed if half their
diet is poor quality silage (at 9.0 MJME/kgDM).
3. Stock health
• What things should the grazier be concerned about, avoid doing and do?
• What drenches or animal health treatments are required? Who will supply, pay for them and do the work?
• If stock are ill, what process does the grazier follow? Do they need to check with the owner first before acting
and what happens if the owner cannot be contacted?
• How are abortions to be noted and verified?
• The TB, BVD and Theileria status of the farm need to be checked before entering an agreement. How will you
ensure the status is maintained while stock are there (movement control, records, exclusion zone)?
24 | Reducing nitrogen loss — A guide to good management practices4. Yarding
• How often is this required and what for?
• How much notice is required, or are the dates set?
• Who does the work?
• What are the labour costs for weighing or other stock work?
• Who meets these costs (owner or grazier)?
5. Stock losses
• What losses is the grazier responsible for?
• Is a percentage allowed before any cost is imposed on the grazier or does the grazier pay for all losses?
• What price is paid for dead animals (or how is it calculated)?
• How and when are losses or adjustments accounted for?
Supporting information/tools
Table 5. Cost of grazing – ready reckoner
kg DM eaten/cow/day
10 11 12 13
$/cow/wk Grazing fee (cents/kg DM)
20 29 26 24 22
22 31 29 26 24
24 34 31 29 26
26 37 34 31 29
28 40 36 33 31
30 43 39 36 33
32 46 42 38 35
34 49 44 40 37
Reducing nitrogen loss — A guide to good management practices | 25Using off paddock facilities
• Off paddock facilities, such as feed pads and stand-off pads, can be used to reduce N loss by intercepting
the N from dung and urine
• The mitigation opportunity is greatest over autumn, where N deposited will be at risk of leaching over the
coming winter months
• Restricting grazing to 8 hours a day over the autumn/winter period, without supplementary feeding, has been
shown to have no impact on production, but has the potential to reduce N leaching by 15-20%
• Use of off pasture facilities may cause animal health and welfare issues, in particular where existing
structures that were not designed to hold cows for extended periods are adapted for this purpose
• If off pasture facilities result in intensification more N can be introduced into the system and undo the
environmental benefit
• Off pasture facility construction is a capital intensive process and appropriate long term budgeting
techniques are required to ensure that the cost benefit ratio is optimised.
Likely impact on N leached
Where off paddock facilities, such as a feed pad, stand-off area or barn are used on farm they intercept the dung and
urine that would otherwise fall on the paddock. It can then be collected and the effluent system utilised to spread the N
across the farm uniformly rather than it falling in concentrated patches that are more susceptible to leaching. If sufficient
storage is available, effluent irrigation can also be delayed until ground conditions are most suitable and plants are actively
growing. In these situations plant take up more of the N applied and N leaching can be reduced further.
Where such facilities are already part of the farm system, adapting them to extend the amount of time that the cows
are off-pasture can contribute to reduced leaching. This is especially true in autumn, as N deposited over this period is
particularly susceptible to leaching because:
• N builds up in the soil over dry months
• Pastures are growing more slowly and are less able to utilise the N deposited
• The onset of winter tends to bring more rainfall (i.e. more drainage events) which will wash surplus N through the
soil profile resulting in leaching.
26 | Reducing nitrogen loss — A guide to good management practicesKey considerations
Because a significant investment is required to construct an off-pasture facility financial implications must be carefully
considered. Risks that may arise through adopting this strategy include:
• The risk of over-capitalising the business, which can occur because of high initial build costs and the cost of
additional equipment purchased over time to operate the new system. It can be hard to recoup the cost of this
additional investment meaning that the return on the investment as a whole can be lower than expected.
• Reliance on milk revenue less feed price as a marginal indicator of profitability. This marginal approach
underestimates costs, especially the cost of capital. A full system analysis should be carried out considering the
impact on all aspects of the business.
• Underestimating how operating costs, especially R&M, will change with intensification.
Such financial outcomes generally occur over the long term and need to be clearly understood. Appropriate budgeting
techniques that account for the long term nature of the investment, such as net present value or internal rate of return,
need to be used.
Details
Impact of time off pasture on N leaching and production
A dairy cow typically excretes 65-75% of the N consumed as surplus in urine and dung. The average cow will excrete
25 litres of urine per day over 8-12 urinations, with the resulting N application at the urine patch being equivalent to
700-1000kg N/ha. Restricting the number of urinations occurring on pasture during “at risk” times of the year can
significantly reduce N leaching.
A DairyNZ study investigated the impact of restricted grazing practices on production in late lactation using three
grazing duration treatments:
1. 1x8hr, one continuous eight hour period of grazing.
2. 2x4hr, eight hours of grazing split between two periods of four hours following each milking.
3. Control, normal 24 hour grazing practice.
When not on pasture the cows were stood off on a lined loafing area to capture urine and dung. While they were on
the stand-off facility they had access to water but were not fed.
The trial found that 4-5 urinations occurred on the stand-off facility which captured 40-50% of the urine excreted
during the period of the restricted grazing treatments. This was estimated to reduce N leaching over the following
drainage period (winter) by 15-20% on both the 1 x 8hr and 2 x 4hr treatments.
The impact on production of this extended time off-pasture was minimal provided:
• The cows were eased into the grazing regime over 3-5 days (ie length of time gradually increased to this 8 hours
• No significant increase in the distance walked during the day occurred
• If used outside of late lactation e.g. when cows are producing close to peak MS/cow the grazing needs to be offered
in 2x4hr grazing periods.
This research showed that it’s possible for cows to consume all their daily intake requirements during restricted grazing
without the need for additional supplements. Cows will readily adapt their grazing time and rate of pasture intake to a
change in grazing routine. This means farms relying mostly on grazed pasture can also use standing off to help reduce
the urinary N output to pasture in autumn.
However, if additional feed is added into the system this introduces more N to the system, some of which will be
excreted and be at risk of leaching, potentially undoing the benefit of stand-off.
Reducing nitrogen loss — A guide to good management practices | 27Impact on pasture
In addition to the potential benefits from reduced N leaching, restricting grazing time in autumn is useful for
grazing management in drier, non-irrigated dairy areas. Standing off paddock can prevent cows grazing below the
recommended pasture residuals during dry periods. The stand-off facility can also be used over winter to protect soils
from damage, contributing to overall pasture production. The overall impact on pasture is likely to differ regionally and
will be dependent on both rainfall and soil types. The DairyNZ trial reported above was unable to detect any difference
in pasture eaten between treatments in the Waikato.
Animal welfare
Adapting existing facilities that are not designed to hold animals for long periods of time for stand-off purposes (e.g
concrete yards) can result in animal husbandry concerns. Where cows are off pasture for long periods they need
sufficient area to lie down. The surface of the facility needs to be wood chip or similar and managed to encourage
cows to lie down and prevent lameness. Redesign of the facility may be necessary before a standing off area can be
used for extended holding times.
Shade
The provision of shade in the stand-off area may help alleviate heat stress, so long as it does not restrict air movement
and increase relative humidity. Water (e.g. using a sprinkler in the holding yard of the dairy) is more effective in
reducing respiration rate and core body temperature but cannot be used in typical stand-off areas.
Animal health
As the length of time cows spend in a stand-off facility increases extra vigilance will be required to ensure animal health
problems do not become an issue, for example, mastitis. The close proximity of cows for extended periods will also
increase the risk of disease transfer.
Effluent system design
Stand-off facilities intercept dung and urine, which needs to be contained and dealt with by an effective effluent
system. The capacity of the system to deal with extended periods off pasture must be evaluated to ensure it remains
compliant.
Covering the facility
Covering the stand-off facility is a means of reducing the amount of rain falling on the surface and therefore
maintaining the stand-off surface in better condition for longer. It has the added benefits of reducing the need to
upgrade the effluent system but will add to construction costs of the stand-off area.
Supporting information/tools
DairyNZ Farmfacts
7-25: Standing cows off pasture – a potential mitigation strategy to reduce nitrate leaching
1-9a: Standing cows off – how cows change grazing behaviour
1-9b: Standing cows off – impact on pasture intake and milk production
8-2: Feed pad design and construction
8-3: Feed pad management and maintenance
Stand-off pads dairynz.co.nz/publications/farm/stand-off-pads/
28 | Reducing nitrogen loss — A guide to good management practicesYou can also read