Residential Heat Pump Breakeven Analysis - Presentation to the Michigan EWR Collaborative March 15, 2022 - State of Michigan
←
→
Page content transcription
If your browser does not render page correctly, please read the page content below
Residential
Heat Pump
Breakeven Analysis
Presentation to the
Michigan EWR
Collaborative

March 15, 2022
Disclaimer
This deliverable was prepared by Guidehouse Inc. for the sole use and benefit of, and pursuant to a client
relationship exclusively with DTE Energy (“Client”). The work presented in this deliverable represents
Guidehouse’s professional judgement based on the information available at the time this report was prepared.
The information in this deliverable may not be relied upon by anyone other than Client. Accordingly,
Guidehouse disclaims any contractual or other responsibility to others based on their access to or use of the
deliverable.

                                                                                                                1
Project Background
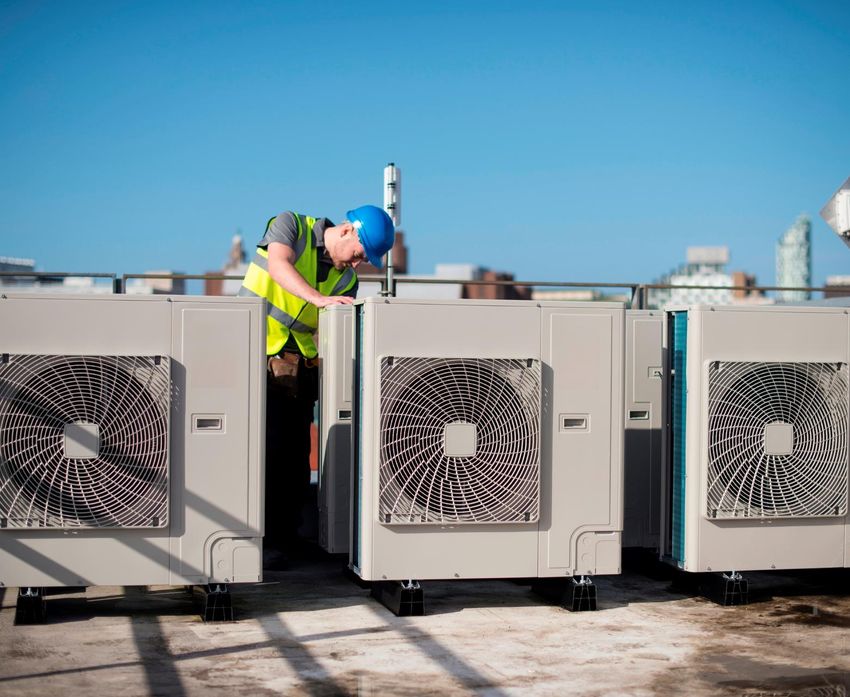
• In support of GHG emissions reduction in the buildings sector, electric heat
pumps (HPs) have seen renewed interest for residential and commercial space Primary heating fuel source for
existing homes in Michigan - 2015
conditioning, even in colder climates such as Michigan.
– HPs can offer substantial GHG emissions savings when supplied with low Natural Gas 77%
carbon electricity.
Electricity 9%
• The national HP penetration rate for residential space heating is 13% today.*
Heat Pump 1-3%
– Some US regions (South – HP penetration rate of 24%), are well suited for
HP adoption due to favorable climate and fuel costs. Propane 9%
– The Northeast and Midwest (HP penetration rate of 4% each) face adoption Other Fuels
4%
challenges due to colder climate and potentially unfavorable economics. (wood)
Fuel Oil 1%
• Electric HPs have very small market share in MI – with only 3% of existing
homes using an electric HP as the primary heating equipment
Source: RECS 2015, 2020 MI Baseline Study
(2020 MI Residential Baseline Study, RECS 2015 suggests ~1%).
2
*percentage of homes that use HPs as primary heating equipment – RECS 2015Project Goals and Objectives
• Although existing studies suggest that HPs are
unlikely to provide lifetime cost savings to MI
consumers in the near term, HPs align with
long-term decarbonization goals in the state.
– As the state’s electric grid decarbonizes, the GHG
emissions savings from HPs will grow.
– Electric grid decarbonization, changes in energy
prices, technological improvements in HPs, and
increased market acceptance are just a few factors
that might change the economic outlook for heating
electrification in the future.
To help DTE better understand the outlook of HPs when replacing electric resistance, propane, fuel oil, and natural gas
heating, Guidehouse conducted an analysis across the multiple HP systems and building types to determine break-even
points for lifecycle cost, lifecycle emissions, and other factors.
3Methodology Overview
User Inputs Analysis Outputs
▪ Baseline space and water heating system
▪ HP replacement system ▪ Heat pump COP and capacity ▪ Cost comparisons for baseline and
▪ Efficiency Level
degradation analysis** HP systems
▪ Vintage
▪ Type of housing (SF, MF) ▪ Installed costs
▪ Location ▪ Cost analysis ▪ Operating costs
▪ Electrical and other upgrades required ▪ Installed costs ▪ Lifetime costs
▪ Gas pipeline cost avoided ▪ Operating costs
▪ Lifecycle costs ▪ Emissions comparisons for
baseline and HP systems
Data Inputs* ▪ GHG emissions analysis ▪ Annual emissions
▪ Annual emissions ▪ Lifecycle emissions
▪ Equipment Costs
▪ Lifecycle emissions
o Installed cost
o Maintenance cost ▪ Breakeven analysis for HP vs.
**HP performance depends on outdoor baseline
o Upgrade cost
ambient temperatures and will decrease at
▪ Utility rates (low, current, high) ▪ Cost breakeven
lower outdoor temperatures in winter. To
▪ Delivered fuel rates (low, current, high) model the requirement for back up electric ▪ Emissions breakeven
▪ Weather data resistance heat, the HP performance
▪ GHG emissions rate (MISO, DTE, degradation needs to be modeled to
accelerated 2035) location-specific outdoor temperatures.
*Aligned with MEMD prototypes as closely as possible including coordinating with the Morgan Marketing Partners team on MEMD building simulation outputs. See next slide for details.
4Methodology: Residential Prototypes
Parameter Vintage Housing type Location Fuel types Efficiency Modeling Scenarios
Number 3 2 7 5 2 3
• Existing • Single family • Detroit, MI • Gas • Standard • Grid Electricity Emissions
(Pre 1978 construction) 2 story house, 2930 sq. ft. Efficiency factors
• Traverse City • Propane
(Current DOE energy • Current projections (MISO
• Existing • Alpena • Oil conservation standards) projections)
(1978-2015 construction) • Multi-family • DTE targets
950 sq. ft. per unit • Muskegon • Electric • High • 2035 Accelerated targets
Description
• Saginaw resistance Efficiency
• New construction (ENERGY STAR
• Fossil fuel prices (low, high,
(Recent construction
• SS Marie • Electric HP specifications) current)
conforming to the Michigan
State Uniform Energy Code)
• Lansing • Electricity prices (low, high,
current)
• Michigan Energy • Michigan Energy Measures • TMY3 Weather • EIA Technology • EIA Technology • EIA Annual Energy Outlook 2021
Measures Database Database (MEMD) data Forecast Forecast Updates • Current fuel and utility prices from
(MEMD) Weather Weather Sensitive Support Updates • NEEP database EIA
Sensitive Support Document 2020 Weather data was • MEMD (for cold climate HP • Grid Electricity Emission factors**
Data Sources* Document 2020 used to model the efficiency ) from DTE projections and MISO
• Building loads* : 2016 HP performance projections***
DTE studies of energy degradation as
efficiency potential of outdoor temperature
natural gas and electricity decreased
* Electricity loads (in kWh) were converted to MMBtu by using the factor of x 3,412 to compare with fuel-fired loads
**Detailed descriptions of the emissions scenarios and data sources used can be found in the Appendix
*** GHG emissions forecast for MISO electric generation based on August 2021 Guidehouse research to evaluate GHG emissions impact for lifetime EWR savings.
5Methodology: CCHP Performance Modeling
Guidehouse modeled heat pump performance as a function of temperature using Michigan weather data and performance
curves from the Northeast Energy Efficiency Partnership (NEEP) database and manufacturer literature. The availability of lab-
verified CCHP performance data will improve in future years with recent changes to DOE and ENERGY STAR test standards.
COP and Capacity HP Performance in Michigan Weather HP Energy Consumption
1) Used COP and capacity data for 24- 3) Mapped COP degradation equation onto TMY3 5) Calculated consumption (kWh) for
60 kbtu/hr (2-5 ton) ducted and ductless weather data for each MI city / climate region to evaluate heat pump and resistance heat
CCHP units from the NEEP database heating demand and COP in each temperature bin.
6) Summed heat pump and resistance
2) Determined COP and capacity 4) Determined switchover temperature (0°F as default) heat consumption to obtain overall
degradation equation as a function of and required make-up capacity from auxiliary electric electricity consumption
outdoor temperature resistance heating (COP = 1).
DOE Appendix
M1 load line for
cold region
5-10°F typically
6Data inputs:
Results: HVAC and WH Costs Elec. rates: Current
Fossil-fuel rates: Current
Existing Single-Family Pre-1978 Home in Detroit, MI – results are largely representative of all scenarios. Electric upgrades: Not Required
Gas pipeline: Not avoided
Space Heating Water Heating
*
• Central CCHP have lower lifecycle costs than oil & propane furnace and electric
• HPWHs have a lower lifecycle cost compared to propane and electric
resistance heating, but higher lifecycle costs compared to gas furnace and boilers.
resistance WHs, but higher lifecycle cost compared to gas.
• A gas furnace/AC system has lower lifecycle cost than a central CCHP over a 15 • Existing homes with gas WHs may require minor electrical system
yr. lifetime, primarily due to upfront cost differences. upgrades (e.g., dedicated 110 or 220V line) when switching to a
• Existing homes may require electrical system upgrades (e.g., panel, wiring) of HPWH (upgrades likely only needed once for both SH and WH and
around $2,500 when replacing a fuel-fired option with an electric HP system. more recent vintages i.e 1980s-1990s may avoid this altogether)
• The lifecycle cost difference between gas WH and HPWH is ~$2000.
• All-electric new construction can save up to $6,000 in avoided gas pipeline costs.
7Results: HVAC and WH Costs
Electrical upgrade needs and the ability to avoid gas pipelines can significantly shift the economics for electric HPs.
Federal, state, utility or other incentive programs can also reduce lifecycle costs by lowering upfront installed costs.
• HP installed costs can range by about $8,500 depending on whether
electric upgrades are needed and gas pipeline costs can be avoided
for new construction.
• Details on the sensitivities for these upgrade costs and savings can
be found in the Appendix.
• Even with this consideration, a central HP is more expensive
compared to a gas furnace + A/C over a 15 yr. lifetime. However, the
cost differential between the two is now only ~$4,500. Many Most
All-Electric
Older Homes Newer Homes
New Construction
Pre-1978 Post-1978
(150-200 amp
(< 100amp (150-200 amp 8
panel / service)
panel / service) panel / service)Data inputs:
Results: HVAC and WH Cost Breakeven Points Elec. rates: Current
Fossil-fuel rates: Current
Existing Single-Family Pre-1978 Home in Detroit, MI Electric upgrades: Not Required
Gas pipeline: Not avoided
• Central CCHP (installed in 2021) breaks even with:
• Electric resistance heating/AC in 4 years, • HPWHs do not breakeven with gas WH for the duration of the
• Oil furnace + A/C in 7 years, and equipment lifetime for any period in this analysis.
• Propane furnace + A/C in 8 years
• Sensitivity around gas and electricity rates does not change this result.
• Natural gas furnace + A/C no payback
• Sensitivity around delivered fuel costs and electricity rates can shift this breakeven • HPWH (installed in 2021) breaks even with propane WH and elec. R
by ±2 years. Necessary or avoided infrastructure costs will also shift payback. WH in 3 years.
• Upfront incentives would reduce installed cost and lead to earlier payback.
9Results: HVAC and WH Annual Emissions
Existing Single-Family Pre-1978 Home in Detroit, MI – results are largely representative of all scenarios.
Space Heating Water Heating
• All three electricity emissions factor forecast scenarios* show decreases in heat • All three electricity emissions factor forecast scenarios* show a decrease in
pump emissions over time with the 2035 accelerated targets being the most water heating emissions over time with the 2035 accelerated projection being
aggressive. the most aggressive.
• Central CCHPs (installed in 2021) have lower annual emissions starting immediately • HPWHs (installed in 2021) has lower annual emissions starting immediately
(2021) per the DTE and 2035 accelerated electricity emissions targets, and lower total (2021) per the DTE and 2035 accelerated targets, and lower emissions starting
emissions starting 2023 per the MISO model. 2025 per the MISO model.
10
*Detailed descriptions of the emissions scenarios (MISO, DTE, 2035 accelerated) and data sources used can be found in the AppendixAnalysis: Natural Gas Price Breakeven
• For the DTE breakeven analysis , the natural gas price was modeled as
$ 8.68 per MCF delivered to MI residential customers (2020 annual).*
• Guidehouse investigated what future natural gas prices would achieve
operating cost and lifecycle cost parity with CCHP systems.
• The graph on the right shows the absolute values of the natural gas
prices required for parity:
• Operating cost breakeven is $12 – 16 per MCF,
• Lifetime cost breakeven is $19 – 22 per MCF.
• Colder climate in Sault Ste Marie pushes the price to the upper
bound, because of the performance degradation of the CCHP at
lower temperatures (i.e., more electric resistance)
• These ‘breakeven’ gas prices represent a significant increase from the
base value of $8.68 per MCF. The table to the lower right shows the % NG price %increase needed to breakeven with CCHP ($) – Current model price = $8.68/ MCF
increase required from the base price to reach these parity prices. In
some cases, the breakeven gas price is more than double today’s rates Location Breakeven type
Existing Existing New Construction
(Pre-1978) (1978-2015) (post-2015)
(i.e., greater than 100% increase).
Operating cost
40% 41% 42%
breakeven
• Natural gas rates may increase due to future supply shortages, stranded Detroit
asset costs, Renewable Natural Gas (RNG) requirements, carbon taxes, Lifetime cost
115% 123% 134%
breakeven
or other market effects.
Operating cost
83% 83% 84%
Sault Ste breakeven
Marie Lifetime cost
*Natural gas prices for Michigan and nationally are from the US EIA 159% 149% 147%
breakeven
11CCHP Cost Estimates and Sensitivity
• Although utility cost differences are the most significant factor in this analysis, assumptions for installed cost also contribute to the
lifecycle cost comparison between technologies.
• Whole-home CCHPs are still a relatively new technology, particularly in the Midwest, so detailed installed cost estimates for MI are
unavailable. Nevertheless, several resources provide CCHP cost examples and highlight the large range in estimates.
CCHP Cost Resources CCHP Installed Cost Details Link
Estimate Used in This Study $12,500 • Based on NYSERDA study below, and upsized to a 4-5 ton model n/a
NYSERDA Renewable
Heating and Cooling $12,000 • 3 ton model, Table 4.4 Link
Framework (2017)
• HVAC+WH equipment costs for cold climate systems are at least 2x the
$15,000-$20,000 cost of the gas/oil baseline equipment
NYS Carbon Neutral
(2x installed cost as gas • The study also analyzes how significant shell improvements can lower Link
Buildings Report (2021)
baseline) this cost premium by using smaller capacity HVAC equipment (although
shell upgrades have high cost).
MassCEC ASHP • Entries based on incentivized projects
$3,694 / ton Link
Comparison Tool (2021) • Median project size 2.1 tons, project cost $3,694 per ton
MassCEC Whole Home Heat • $18,400 per home average for 1,603 SF per home over 168 projects
>$18,000 Link
Pump Solutions (2021) • Only covered HVAC, not water heating
MEEA You’re Getting • 10.5 HSPF ccASHP cost $9,406 national average with range of $8,878
>$9,000 Link
Warmer (2018) to $11,690 for the cities studied.
12Results Summary
While system efficiency, location, fuel & electricity rates influence the results of each analyzed scenario, the following insights are largely
representative of all scenarios considered.
Space Heating & Cooling Water Heating
• Central cold-climate heat pump (CCHP) and ductless CCHP costs
do not breakeven with gas furnace + A/C or gas boiler + RAC. • HPWH costs do not breakeven with gas WH for the duration of
the equipment lifetime. Sensitivity around gas and electricity rates
• Central CCHP (installed in 2021) breaks even in 4-9 years with does not change this result.
Cost electric resistance, oil, and propane heating w/ AC systems
• HPWH costs (installed in 2021) break even with electric resistance
Breakeven • This happens because natural gas rates are low, electricity rates WH costs in ~3 years.
are relatively high and delivered fuels are expensive
Point
• Central CCHPs (installed in 2021) have emissions benefits
compared to electric resistance, oil, and propane starting
• HPWHs installed in 2021 have emissions benefits compared to
immediately for all electricity emissions scenarios.
electric resistance WH starting immediately for all projections.
• Central CCHP and ductless CCHP (installed in 2021) emissions
Emissions • Emissions breakeven with gas WH occurs in 2028 (MISO
break even with gas furnace + A/C and gas boiler+ RAC in 0-2
scenario) and in 2022 (DTE targets)
Breakeven years (DTE targets) and in 3-10 years (MISO scenario) – with the
Points upper range representative of colder cities (such as SS Marie).
• Given the low natural gas rates in Michigan, gas customers would likely not see lifetime economic savings from heating electrification unless
CCHPs and HPWHs cost significantly less than gas-systems because of the operating cost premium for HP systems.
• Upfront cost incentives and avoiding gas pipeline costs (e.g., new construction) can shift the upfront cost outlook for CCHPs.
13Contact Jim Young Associate Director jim.young@guidehouse.com (312) 583-3743 Ali Akber Kazmi Senior Consultant akazmi@guidehouse.com (781) 270-8304 Debbie Brannan Associate Director debbie.brannan@guidehouse.con (303) 728-2493 Craig McDonald Partner cmcdonald@guidehouse.com (303) 728-2461 ©2022 Guidehouse Inc. All rights reserved. This content is for general information purposes only, and should not be used as a substitute for consultation with professional advisors.
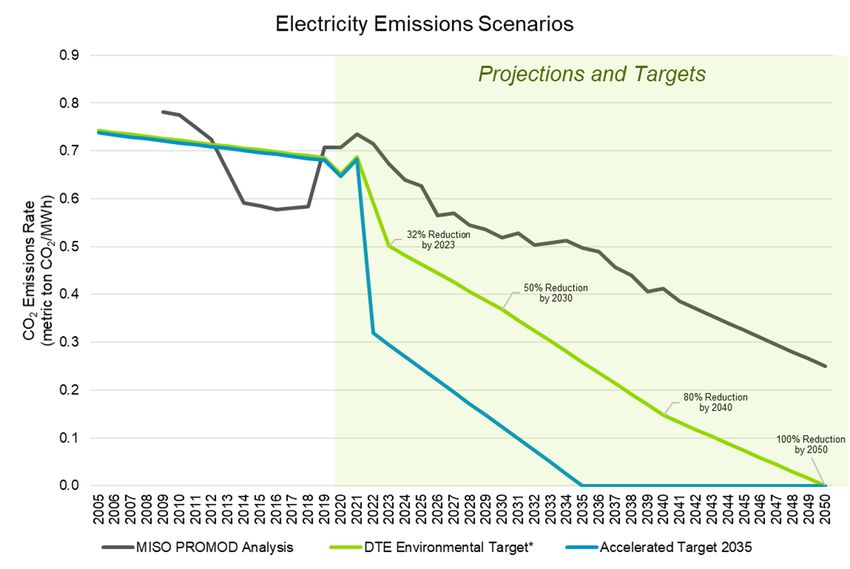
Electricity Emissions Scenarios

                                     • This study examined three electricity
                                       emissions scenarios
                                          1. MISO Analysis
                                                     •     GHG emissions forecast for MISO
                                                           electric generation based on
                                                           August 2021 Guidehouse research
                                                           to evaluate GHG emissions impact
                                                           for lifetime EWR savings
                                             2. DTE Environmental Targets
                                                 • Zero-emissions by 2050
                                             3. Accelerated Targets 2035
                                                 • Zero-emissions by 2035

                                  *DTE Environmental Targets use 2005 as the baseline for reductions

                                                                                                       15
Sensitivities for Technology Cost Comparison
• Depending on the site-specific situation, installing electric heat pumps may require changes to the building infrastructure, which can increase or
decrease costs substantially.
• Some homes may need infrastructure upgrades for HPWH (up to $500 for condensate line and dedicated 110/220V line) and full electrification
($2,500 or greater for panel and service line upgrades). The number of homes that would need upgrades and their cost is highly uncertain.
• New construction could avoid the gas line or fuel storage with all-electric designs, which may save consumers approximately $6,000.
Impact on Potential
Cost Sensitivity Cost Range (Res-Com)
Electrification Cost Situations
Wiring Upgrades (Water Heating) – installing 110V or 220 V outlet Existing buildings $300 (R), $700 (C) based on 2019 E3
near HPWH with gas WH (Link) and 2016 TRC (Link)
Condensate Piping (Water Heating) – piping / pump to floor or Existing buildings $200 (R), $200 (C) based on 2019 E3
laundry drain with gas / electric WH (Link) and 2016 TRC (Link)
Airflow Requirements (Water Heating) – installing louvered doors Existing buildings
Varies
Increases Costs & or airflow ducts if located in small space with electric WH
Decreases Older homes,
Attractiveness Panel / Service Upgrades – increasing from 60-100A to 200A Varies, est. $4,000 (R), $0 (C) based
especially without
panel, and may require upgraded connection from utility on 2019 E3 (Link) 2016 TRC (Link)
central AC
Existing buildings Varies, removing gas meter may have
Decommissioning Costs for Fuel Storage
with oil / propane costs for former gas customers
Complicating Factors Not Considered in Analysis (no ducts,
Wide variety Varies, can add significant cost
hydronic heating, high-rises, backup electric needs)
Decreases Costs &
Avoided Gas Line and Fuel Storage (all-electric for heating, water New all-electric $6,000 (R), $12,000 (C) based on
Increases
heating, cooking, laundry, and misc. loads) buildings 2019 E3 (Link) 2016 TRC (Link)
Attractiveness
16Key Data Sources
• Weather • Utility rates
• TMY3 data set for all seven MEMD climate regions (publicly • Current rates
available at: Whitebox) • DTE electricity rates
• Michigan natural gas rates
• Building load • Projections: EIA AEO2021
• MEMD (primary source) • Electricity
• Michigan Energy Efficiency Studies (secondary check) • Natural Gas
• Gas study • Delivered fuel prices
• Electric study • Current prices
• Data from Morgan Managing Partners • Heating oil
• Propane
• Equipment costs • Projections: EIA AEO2021
• EIA Technology forecast updates • GHG emissions factors
• Except for CCHP units • ISO Level (MISO) from eGRID (2009-2018); ISO Level
(MISO) from Guidehouse PROMOD Analysis (2019-2040)
• Efficiency • DTE targets
• EIA Technology forecast updates
• Residential Prototypes
• MEMD
17You can also read