Residual stress measurements that correlate fatigue and fracture behavior Residual Stress Summit 26 September, 2010 Tahoe City, CA
←
→
Page content transcription
If your browser does not render page correctly, please read the page content below
Residual stress measurements that correlate
           fatigue and fracture behavior

                    Residual Stress Summit
                     26 September, 2010
                        Tahoe City, CA

Michael R. Hill
Professor
Mechanical and Aeronautical Engineering
University of California, Davis
mrhill@udavis.edu

President
Hill Engineering, LLC
McClellan, CA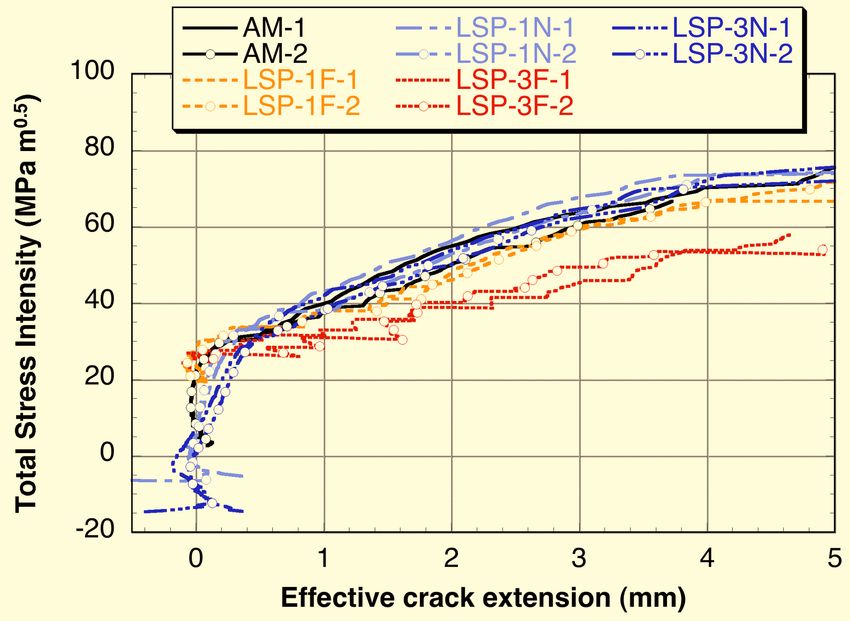
Acknowledgements

   Development of laser shock peening (LSP) (1999 to present)
       LLNL and MIC (Lloyd Hackel)
       Boeing and Lockheed-Martin (Jim Pillers, Jeff Bunch, Tom Brussat, Dale Ball)
   FAA Rotorcraft Damage Tolerance (RCDT) Program (2006 - Pres)
       John Bakuckas, Traci Stadtmueller, Felix Abali, Dy Le
   NAVAIR SBIR Phase I and II (established Hill Engineering, LLC)
       “Design Tools for Fatigue Life Prediction in Surface Treated Aerospace Components”,
         2004 to 2009
       Ravi Ravindranath (NAVAIR)
       Mike Shepard (AFRL)
       Pratt & Whitney (Bob Morris)
   USAF SBIR Phase I and Phase III
       “Design/Life Prediction Tools for Aircraft Structural
         Components with Engineered Residual Stresses”, 2008 – Pres)
       Kristina Langer (AFRL)
   NRC/EPRI joint program on weld residual stress
       Al Csontos, Howard Rathbun, Matthew Kerr
       Paul Crooker, Eric Willis
   My graduate students
       Makarenko, Lin, Yau, McKenna, Meith, Rankin, Demma, DeWald, Truong, Bhoon, Lee,
         Cuellar, Boyd, Chandra, Pistochini, Liu, Hopkins, Luong, VanDalen, Stuart, Minotti

                                                                                          2
Presented at the 2nd Int’l Laser Peening Conf (19Apr10)

    Presented by David Jensen, Boeing
    Glass bead peening =  Durability
      Small number of aircraft

                                                          3
Presented at the 2nd Int’l Laser Peening Conf (19Apr10)

    Presented by David Jensen, Boeing
    Laser shock peening =  DT and  Durability
      Small number of aircraft
    Process matured on test airframe
      “Current capability is on track
      for implementation in 2011”

                                                          4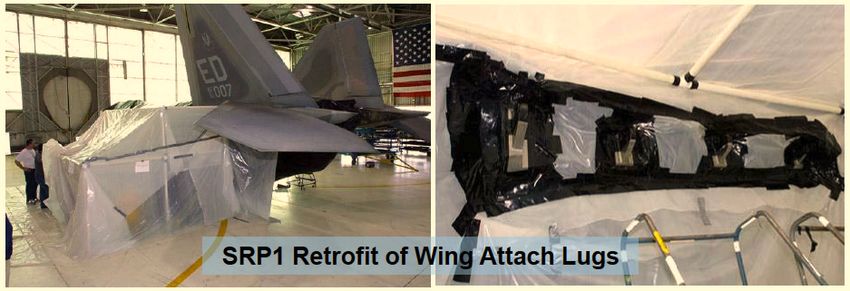
Residual stress engineering methods for sustainment

    Sustainment: assuring structural safety in presence of degradation
        Sub-critical cracking (fatigue, SCC, creep)
        Residual strength (fracture)
    Characterize residual stress fields in parts
        Residual stress measurements                      More complicated than
        Residual stress predictions                   determining applied stress field
    Combine applied and residual stress fields (linear or non-linear)
    Correlate performance under combined stress fields
        Remove effects of residual stress in property measurements
          (fatigue crack growth and fracture properties)
          the “reverse problem” (ref: Dale Ball, RS Summit 2007, ASIP Con 2008)
        Forecast effects of residual stress on performance
          (fatigue crack growth, stress corrosion cracking, residual strength)
          the “forward problem”
    Objectives for today’s session
        Describe residual stress measurement methods
        Describe coupon-scale experiments
        Show correlation of fatigue and fracture data
          Is behavior as expected from combined stress fields?

                                                                                    5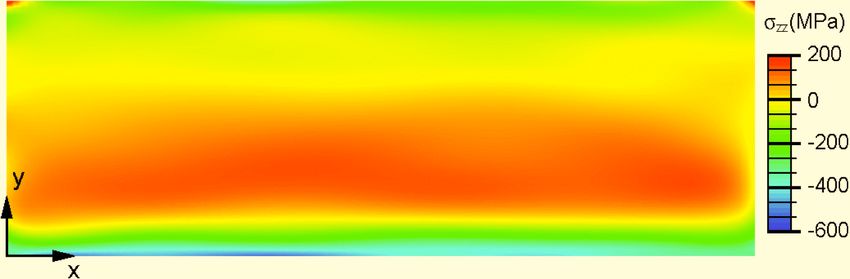
Residual stress background

    Residual stresses play a significant
      role in many failure mechanisms
        Examples: fatigue, fracture,
          stress corrosion cracking
        Tensile RS  decrease performance
        Compressive RS  increase performance                   Subsurface
                                                                                          1 mm
          • Often provided by surface treatments                  initiation

                                                    From: M. J. Shepard, P. S. Prevéy, N. Jayaraman,
    Residual stresses satisfy equilibrium         “Effects of surface treatment on fretting fatigue
                                                    performance of Ti-6Al-4V”, Proceedings of the 8th
        Residual stresses in all parts are both   National Turbine Engine High Cycle Fatigue
          Tensile and Compressive                   Conference, April 14-16, Monterey, CA, 2003.
        Example: compressive stress treatments
          • Compressive in treatment zone
          • Tensile outside treatment zone           Need to understand through-
                                                       thickness residual stress
          • Can lead to, e.g., sub-surface crack
                                                       variations in coupons and
             initiation (> 1 mm depth)
                                                              components

                                                                                              6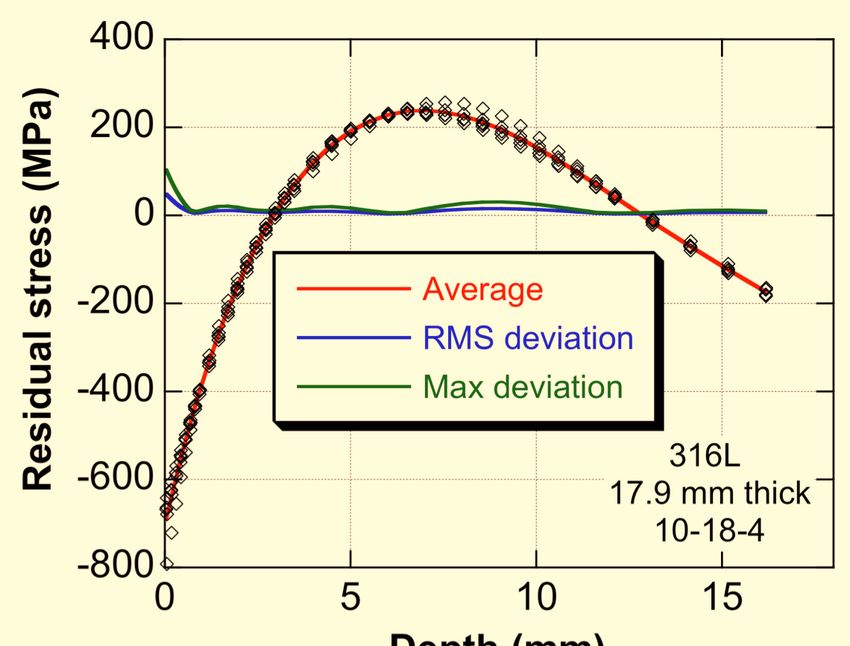
Slitting method residual stress measurement

    Provides a 1-D stress “profile”, through thickness
       Parts of arbitrary cross section, but prismatic
       Wide range of thickness
    Experimental steps
       Instrument with strain gage(s)
       Incrementally cut slit into body, measure strain release vs depth of cut
       Solve for initial residual stress from measured strain (elastic inverse)
    Representative slitting measurement
       Laser peened block of material

                                                                               7
Working principle (Iain Finnie and co-workers, 1971 and following)

    Consider a beam or plate containing residual stress
    Slit incrementally to a set of depths (a1, a2, …)
        Measure strain release at each depth (ai)
          at two gages (“front” and “back”)
    Assume
        Elastic stress release
        No stress variation out of plane (z)
    Released strain a function of
        Residual stress perpendicular to slit
        Elastic properties
        Geometry: gage sizes, positions
          part and slit dimensions
    Find stress from measured strain (elastic inversion)
        Assume polynomial expansion
        Find Aj to determine RS(y)
                                            RS (y) =    A P (y)j   j
                                                        j= 2,m

          Non-polynomial alternative available (the “pulse method”)

                                                                         8
Laser Shock Peening (LSP) Process Description

   An extension of conventional shot peening
   Laser peening provides
        High compressive surface stress
        Deep compressive stress
        Low cold work
        Smooth surface
        Process control

                                            Photo courtesy of Metal Improvement Company

                                                                                     9
Slitting useful in understanding effects of LSP parameters

                           Rectangular, highly uniform
                            laser beam intensity
                              distribution is coupled to
                              the part using an optical
                                delivery system that
                                preserves the uniform
                                 intensity

                              Peening pulses are applied
                             sequentially in complete
                            rows without the need
                           for re-coating the surface      Photo and graphic courtesy of
                          ablation layer                   Metal Improvement Company

    Key laser shock peening parameters:
       Irradiance (GW/cm2) (proportional to peak pressure)
       Pulse width (nsec)
       Number of layers (number of times surface is covered)
    Optimal parameters depend on material, geometry, and failure
      mode

                                                                                     10
Effects of LSP parameters in titanium alloy
Process variations studied in 0.5 inch thick block coupons
Material: BSTOA Ti6Al4V
Increases in irradiance and layers increase depth of compression
Key: (GW/cm2-nsec-#layers)
XRD difficult in this
large grained material
11Benchmark Slitting with Contour and X-ray: Set-up
Uniformly LSP entire surface of
titanium alloy plate
Cut into 4 block coupons
Each 25 x 25 x 8.7 mm
Measure residual stress
Slitting, Contour, X-ray diffraction
Expect good agreement
Uniform microstructure,
small equiaxed grains
Residual stress field that meets
assumptions of methods
12Benchmark Slitting with Contour and X-ray: Results
Very favorable results
Some differences in
near-surface behavior
Good agreement in integral
of stress with depth
LSP Surface
13Establish intralaboratory repeatability of Slitting: Set-up
Uniformly LSP entire surface of
316L stainless steel plate
Initially: 100 x 250 x 17.9 mm
Cut into 10 block coupons
Each 50 x 50 x 17.9 mm
Each block should have similar RS
• Expect low variability in LSP process, material properties
• Observe variability in RS measurement
Measure RS in six blocks
14Establish intralaboratory repeatability of Slitting: Results
Results in six blocks
All six measurements shown
along with average and deviation
RMS deviation:
~40 MPa near surface
~10 MPa away from surface
Demonstrated repeatability
error < 5% of peak stress
15Session objectives
Describe residual stress measurement methods
Describe coupon-scale experiments
Show correlation of fatigue and fracture data
Is behavior as expected from combined stress fields?
Summary comments
16Tests and analyses of C(T) coupons with residual stress
Are residual stress data useful?
YES, if they correlate mechanical performance!
Without such correlation, merely “reference data”
Objective: Determine the degree of correlation achieved by
combination of applied and residual stresses for
fracture and fatigue crack growth under (nearly) SSY conditions
Approach
Designed residual stress bearing C(T) coupons
• 5 different residual stress levels
Developed test data
• Residual stress fields
• Fracture data
• Fatigue crack growth data
Carried out companion analyses
• Fracture: superposition of applied and residual K
• Fatigue crack growth: superposition, LEFM, and NASGRO equation
17Coupon design
ASTM C(T) coupons
Clad 7075-T6 Al sheet, 4.8 mm thick
Low-energy, ductile fracture
B = 3.8 mm, W = 50.8 mm, L-T
Residual stress from Laser Shock Peening
Repeatable, controlled, low cold
work, deep compression
Applied to both sides
In a square region (23mm wide)
• Near the front face (N) LSP Near
• Far from the front face (F) front face
LSP intensity varied by layers: (KRS Negative)
low (1) or high in (3)
Five conditions
AM, LSP-1F, LSP-1N, LSP-3F, LSP-3N
LSP Far from
Tests performed
Fracture tests (K-R and FCG)
front face
Measure RS (contour) (KRS Positive)
Measure KRS (slitting)
18Contour residual stress measurement
Opening stress, on crack plane
LSP-3N
• Compression in peened area
• Balancing tension and bending
AM: rolling
Good repeatability
Material
Processing
Measurements
19Contour residual stress measurement
Opening stress, on crack plane
LSP-3N
• Compression in peened area
Thickness-average residual stress
• Balancing tension and bending
AM: rolling
Good repeatability
20Slitting residual stress measurement: Strain data
Back-face strain gage
(a)
High levels of strain
Significant differences among coupon conditions
21Slitting residual stress measurement: Computed stress
Back-face strain gage
(a)
Data reduction used the
unit pulse method
(Schajer and Prime, JEMT 2006)
22Validation opportunity: Stress from Slitting and Contour
Slitting and Contour each use different measured quantities
Comparison of results provides validation
Compare Slitting with thickness-average of Contour results
Thickness-average residual stress
300
LSP-3N - Slitting
LSP-3N - Contour
200 AM - Contour
Residual Stress (MPa)
100
0
-100
-200
0 10 20 30 40 50 60
x (mm)
23Slitting also provides KRS(a)
Schindler’s method
Schindler, H.J. and P. Bertschinger. “Some Steps Towards Automation of the
Crack Compliance Method to Measure Residual Stress Distributions.” in Proc. 5th
Int. Conference on Res. Stress. 1997. Linköping.
E d(a)
(a) = K RS (a)
Z(a) da
Note: crack size
measured from
loading holes.
a = x – 12.7 mm
24Validation opportunity: KRS(a) from Slitting and Contour
E d(a) a
Slitting K RS (a) = Contour K RS (a) = 0
RS (x) m(x,a)dx
Z(a) da
Residual stress intensity factor
20 Green’s Function, or
Slitting, d/da Weight Function
15 Slitting stress + GF
Contour stress + GF
10
KRS (MPa m )
0.5
5
0
Note: crack size
-5 measured from
loading holes.
-10
a = x – 12.7 mm
-15
-20
0 10 20 30 40 50
a (mm)
25Fracture toughness tests
R-curve tests to ASTM E561-98
Load vs CMOD data
Initiation toughness to E399 (KQ, not sized for KIc)
Results ignoring, and including residual stress
KQ,Tot = KQ,App(ao) + KRS(ao)
KR,Tot(ae) = KR,App(ae-ao)+KRS(ae)
Details
Precracking performed to E 561
• Constraint:
final 0.65mm >5,000 cycles
• Guideline: Kmax = 0.0001E m1/2
• Account for KRS effects
• Compression-compression
for LSP-1F, LSP-3F
• High stress ratio tension-tension
for LSP-1N, LSP-3N Valid a0
Effective crack extension, ae
• Initial and final physical crack lengths measured
26Observed load, displacement
Peak load significantly affected by residual stress
KRS(a0) > 0 Reduced Pmax
KRS(a0) < 0 Increased Pmax
Valid a0
27Initiation toughness, KQ
Ignoring residual stress: spread is 9.7 to 52 MPam0.5
28Initiation toughness, KQ
Ignoring residual stress: spread is 9.7 to 52 MPam0.5
Including residual stress: spread is 32 to 37 MPam0.5
KQ,Tot = KQ,App(ao) + KRS(ao)
LSP-3F LSP-1F AM LSP-1N LSP-3N
29R-curve, ignoring residual stress
Two replicates for each condition
Applied load and CMOD data only
LSP Near
front face
(KRS Negative)
LSP Far from
front face
(KRS Positive)
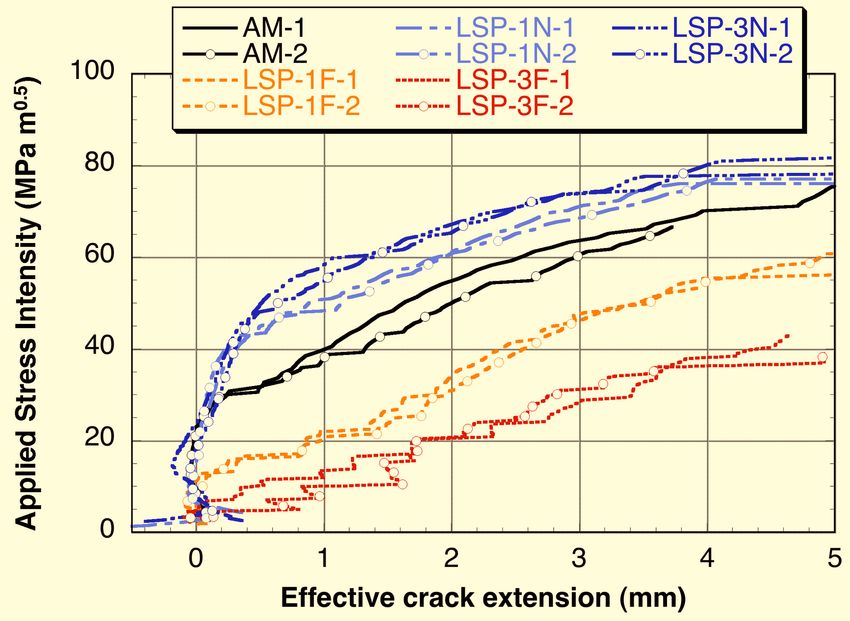
30R-curve, including residual stress
Linear superposition
KR,Tot(ae) = KR,App(ae-ao)+KRS(ae)
LSP Near
front face
(KRS Negative)
LSP Far from
front face
(KRS Positive)
31Fatigue crack growth prediction
Constant Pmax (0.98 kN for AM, 2.22 kN for LSP)
Rapp = 0.1 (K increasing)
LSP-3N coupon condition (KRS < 0)
LSP-3N
AM
LSP-3N
AM
32Fatigue crack growth data and prediction
Constant Pmax (0.98 kN for AM, 2.22 kN for LSP)
Rapp = 0.1 (K increasing)
LSP-3N coupon condition (KRS < 0)
LSP-3N
AM
LSP-3N
AM
33Comments on fracture toughness and FCG testing
Sample design provided useful coupons for study
Significant residual stress levels
Range of residual stress effect (sign and magnitude)
Repeatable processing
Wide range of KRS(ao)
-50% to 78% of as-machined KQ
Residual stress measurement methods in agreement
Stress distribution
KRS(a)
Residual stress data provided useful correlation
Across all coupon conditions
Initation toughness
R-curve
Fatigue crack growth
More than merely reference data!!
34Residual stress complicates the building block approach
Sustainment engineering often uses building blocks
Proof of concept data in simple, typically small, coupons
Success in coupons used as gate for more complicated tests
De
Simple
cr
Develop/Optimize
ea
Feature Tests
si
Technology
ng
Ri
sk
Quantify Variation
of
More Complicated
for Intended
St
Feature Tests
ru
Application
ct
ur
al
Fa
Develop
ilu
KEY: Component
re
Analysis
Tests
Analysis Methodology
Verified
By Testing Demonstrate
Technology for Full -Scale
Actual Tests
Application
35Residual stress complicates the building block approach
Size and shape differences between coupons and components
Residual stresses must be different
Benefits in coupons will not equal benefits in structure
B Bair, et al, 2009 ASIP Conference
Need to validate
residual stress engineering
tools at appropriate scales
and develop methods for
transferability between
coupon and full scales Residual Stress (ksi)
Depth from surface (in) 36Summary
Residual stress engineering is advancing
Residual stress measurement
Residual stress modeling
Test experience with well-characterized coupons and components
Measurements of full-field residual stress enable fundamental
understanding of fracture and fatigue behavior
Can be exploited for validation of residual stress models
The majority of our work shows superposition to be adequate for many
problems
Coupon scale data show good correlation with expected behavior
(when residual stress is known)
Be aware of challenges and complications in transferring
results between coupon and full scales
Must have continued support for development of residual stress
engineering methods
Government and industry sponsorship
Advanced process design and specifications
Industrial use
Standardization
37Thank you.
38Contact Information
Michael R. Hill
Mechanical and Aeronautical Engineering
University of California
One Shields Avenue
Davis, CA 95616
mrhill@ucdavis.edu
(530) 754-6178
Hill Engineering, LLC
Adrian DeWald, Managing member
atdewald@hill-engineering.com
(916) 635-5706
Hill Engineering provides residual stress measurements
and residual stress engineering services to industry.
39Transition in residual stress engineering paradigm
Historical Future
Residual Stresses are Residual Stresses are part of
managed consequences higher-order specifications
that affect design performance that ensure design performance
Residual stress measurements are Residual stress measurements are
opportunistic or last resort routine and part of quality program
Tensile residual stresses removed Tensile residual stresses limited by
where possible; accounted for with specifications and improvements in
high conservatism if required process design and toolsets
Compressive stress treatments used Compressive stress treatments widely
sparingly to assure safety & available, part of design and repair
sustainability engineering
Residual stress engineering methods Residual stress engineering methods
and tools highly specific, developed and tools are vetted through broad
for unique events consensus (Standards, Code cases)
Residual stress engineering is Residual stress engineering is a
expensive, time-consuming work of manageable discipline, consistent
experts with economic considerations
Future needs require advances in
residual stress engineering methods and tools 40Similar test program in open hole coupons
Can we also achieve good correlation
in more relevant geometry?
Material and geometry
Open hole
7075 T6 sheet a
• Clad (C) or Bare (B)
• 2.03mm thick
Residual stresses
As-machined (AM)
Split-sleeve cold expanded (CX)
• 3% interference
Reamed after CX
As Machined Cold Expanded
Loading B1 C1 B1 C1
R = 0.1
Constant amplitude load B2 C2 B2 C2
Stress ratios: R=0.1, R=0.5 B1 C1 B1 C1
R = 0.5
B2 C2 B2 C2
8 test variations, 8 replicates
41Contour residual stress measurements
2-D residual stress distribution thickness-average
3 coupons measured on both sides = 6 measurements
±10% variability in through thickness average
Through thickness average
stress distribution
100
0
Bare Right
Residual stress (MPa)
-100 Bare Left
Clad Right
-200 Clad Left
Clad2 Right
-300 Clad2 Left
Average
-400
-500
±10% variability
Length in (mm) -600
0 2 4 6 8 10 12 14 16
Stress in (MPa) Distance from edge of hole (mm)
42Results for as-machined coupons, R=0.1
Low variability in crack growth history
Good correlation with LEFM prediction
8
Fatigue crack growth rate (mm/cycle)
B080-1NC
7 C080-1NC -4
10
C080-2NC
6
LEFM
Crack size (mm)
5
4
B080-1NC
3
C080-1NC
2 C080-2NC
-5
10
1 LEFM
0
0 50000 100000 150000 200000 0 1 2 3 4 5 6 7 8
Cycles Crack size (mm)
43Results for cold-expanded coupons, R=0.1
Greater variability in crack growth history
Factor of 9 spread in lifetime
Good correlation with LEFM prediction (including spread)
8
Fatigue crack growth rate (mm/cycle)
B080-14 -3
C080-08 10
7
C080-06
C080-14
6 LEFM
LEFM 90%
Crack size (mm)
LEFM 110%
5
-4
10
4
B080-14
3 C080-08
C080-06
2 -5 C080-14
10 LEFM
LEFM 90%
1 LEFM 110%
0
0 50000 100000 150000 200000 0 1 2 3 4 5 6 7 8
Cycles Crack size (mm)
44You can also read