Resiliency Urbanism Economic Resilience in a Changing Climate - Tales of Adaptation from Four Indian Cities
←
→
Page content transcription
If your browser does not render page correctly, please read the page content below
Resiliency Urbanism
Economic Resilience in a Changing Climate
      Tales of Adaptation from Four Indian Cities

                   Meenu Tewari
                  mtewari@unc.edu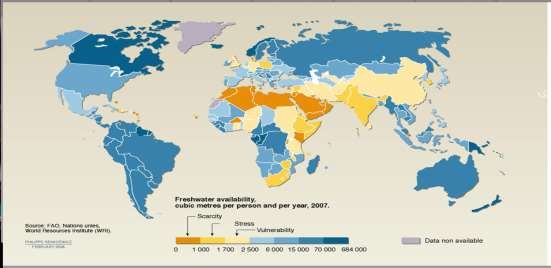
Massive urban transition at a time of climate change

                                                                  Source

  India’s urban population is expected to double by mid-century

                                                         814
                                 420
         161
                                 862                     806
         538

         1980                   2015                    2050
Source: World Urbanization Prospectus
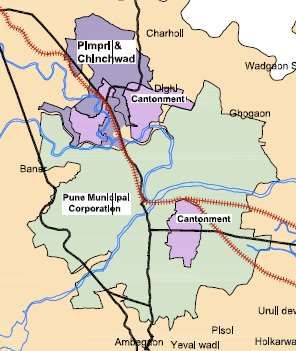
• Cities are the engines of economic growth, but also at the greatest
  risk from a changing climate, given the concentration of human life
  and resources.

Resources are under stress, especially water

A fifth of the world’s population with access
To only 3% of the world’s fresh water resources

Dwindling, weak storage; Depleting ground water

• Adaptation will be critical….and the time to act is now

Adaptation is a spatially rooted, highly variable process
How is this local process playing out in Indian cities.
What motivates resource constrained cities burdened Chose 4 secondary
with huge development deficits and weak planning cities for a deep dive
institutions to act on perceived climate risks.
How can adapting to the risks of climate change actually
enhance the competitiveness of cities?
Under what conditions can economic development and
climate adaptation go hand in hand, reinforcing each other,
rather than be inevitable trade-offs.
4 Study Cities
                                                     Mixed methods – Case studies, field research
                                                     Data analysis

                                                     Choice of cities -- 4 Rapidly growing secondary cities;
 Laissez faire, entrepreneurial       Ludhiana       Where ACCCRN or partner agencies had worked before.
                                        3,487,882

Benign top-down technocracy;         Surat
                                   4,585,367
Involved business elite
                                      Pune             Mining Variation:
    Competent and effective;
                                      5,049,968        Differing industrial structures
    Strong & vocal civic society
                                                       -- Two labor intensive;
                                                       -- Two mixed manufacturing and services led
        Participatory, rule-bound;        Kochi
        Active advocacy groups           2,117,990     Differing governance structures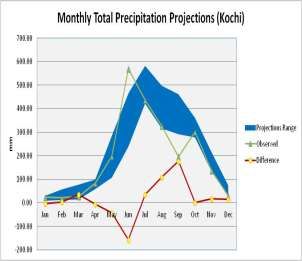
Study Approach

                                                               Sea Level
                              Output          Industrial       Rise and
                             Per capita          Str.           Water
                              Income                          Ingression

                                               Urban
                                              Services
Indicators

                                                                                           Indicators
                           Economic                           Climate
                                                                             Temperature
             Rev. Base   Competitiveness                      Change
                                                                                Rise
                            of Cities                       Vulnerability
                                             Livelihood

                            Access to                          Extreme
                             Urban           Governance
                                                             Precipitation
                            Services

                                           Vantage Points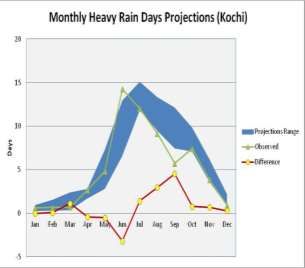
SURAT                                           PUNE                   KOCHI

Population (UA):          4.58 million (97% is city)           5.05 million (62% is city)            2.2 million (28% is city)
Area (City)                    326.24 sq kms                        243.84 sq kms                         94.90 sq kms
Density (City)                    13,670.92                            12,754.27                            6,322.44
Growth ‘91-’01                      85.1%                                50.6%                                18.8%
Growth ‘01-’11                     63.09%                               34.28%                               56.20%
                     dense part – central zone -getting   Both city core and the suburbs are   suburbs (west, north and north east)
Spatial Growth
                     denser                               growing                              growing faster than the core
Ann. hhld income                 Rs. 457,000
Literacy                           89.03%                               97.49%                               91.61%
Gender Ratio                         758                                  945                                 1028
Unemployment
                                    0.65%                                 27%                                 3.5%
Rate
Poverty Rate (BPL)                   10%                              Almost 50%                               35%
% of City
Population in                        17%                                  40%                                 18.9%
Slums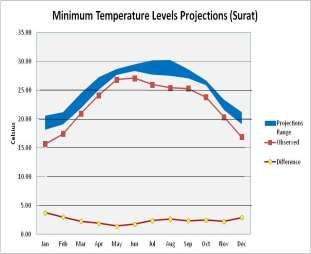
Surat
        •    Higher winter minimum
        •    Disease window increases
        •    Reduction in Precipitation-
        •    water storage implication

Kochi
            •Sharp rise in total rainfall-
            unexpected patterns

            •Overall increase in heavy
            rain days (serious storm water
            drainage issues)

            •Fisheries impact

            • Hydropower Impacts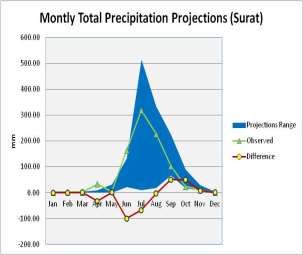
City Vulnerability Profiles

City          Population    City Growth (%)   Key Climate Concern

                                              Flood risk, sea level rise
                                              Secondary risks surges, salt water
Surat        4,585,367     83.3               inundation of the Tapi estuary, heat
                                              and humidity

                                              Sea level rise, intensity of monsoons,
                                              saline inundation, threat to water
Kochi        2,117,990     0.9                systems (availability, collapse of
                                              drainage)

                                              Periodic flash floods, water
Pune         5,049,968     22.7               availability

                                              Riverine flooding
Gorakhpur    671,048       7.8
Mapping Economic Competitiveness
Financial Conditions
70
Institutional Support 60
Physical Conditions
50
40
Supplier Sophistication Communication
30
20
10
Business Incentives 0 Administrative Conditions
Competition Intensity &
Human Capacity
Diversity of Firms
Income Distribution &
Innovation
Spending Pattern
Demographics
Pune (9) Surat (14) Kochi (16) Ludhiana (32)Who is likely to act on climate adaptation and under what conditions? Q1
Finding 1: When perceived risks are diffuse, uncertain, non-specific or
seen as not affecting those that hold social or economic power,
motivating climate action by local governments is difficult – unless the
problem crosses a threshold, or there are external nudges.
Ground water depletion in urban peripheries, unsafe effluent discharge in labor-
intensive industrial cities (Ludhiana, Surat), poor solid waste management
Finding 2: Uncertainty in climate science and downscaling to city scales
can be a source of resistance to climate action
Clarity on how climate impacts impinge on cities is lacking
City specific climate models needed
Downscaling of results from models at the national level is rare
In the face of multiple other demands, climate threats are therefore seen as distant,
vague and costly – a strain on already limited resources – not an immediate priorityPolicy takeaways
Gathering better data is key.
Can the regular collection of economic and climate relevant data at the
city level be made mandatory?
Example: National programs such as JNNURM and AMRUT, SMART
tried to do this – or had this effect.
Create city level climate cells with funding, training, and a seat at the
table.
Support cities in fostering City-University-Community linkages backed by
meaningful incentives.Finding 3: Differences in climate consciousness between gradual and sudden onset
impacts can shape adaptive responses in deep ways
Gradual onset events – such as temperature Cities with experience of
rise, air quality, pollution, ground water repeated sudden onset
depletion, sea level rise are notoriously climate related extreme
difficult to act on as opposed to extreme events may be more amenable
precipitation events, floods, or disease to climate action (e.g. Surat)
contagion
But even so, if the event is
Gradual onset of climate impacts can lead to perceived as being a natural
costly lock-ins when policy makers are
hazard, the response can stay
confronted with an escalation of a known
limited to disaster-
hazard. --- This can lead to a much more
costly adaptation process for the city after the management-orientation, and
fact. the urgency to transform can
be lost with time (e.g., recent
E.g. the gradual submergence of low-lying areas on
Mattancherry is not new; but the recent worsening of the Kochi floods)
situation by increasing incidence of rainfall has caught the
government and residents off-guard.Policy Takeaways
A short term focus and poor planning can lock in Unbundling and leveraging existing
urban assets leading to many investments complementarities between
being stranded and others being stretched provision of urban services and
beyond their capacity. climate resilience can lower costs
and generate co-benefits
Climate aware, strategic planning can pay
economic dividends today and lower the cost of Careful balance between strong
adjustment over time. administrative wing at the city level,
political support, and meaningful
“Strategic planning devices” that Salet (2007) participation, can help foster
and others talk about might be needed to align linkages between different scales of
goals, create a vision and build political government, politics and society
coalitions. But this first requires city officials or
other leaders to be convinced of the cause.Finding 4: One acts when something of deep value is impacted.
We found that cities act in climate adaptive ways (even if they don't call it that or think of it in
those terms) when:
(i) the bottom line of the business elite is badly impacted (Surat).
(ii) When the bureaucracies’ own self image of competence is called into question or is
at stake on a public stage (Surat in wake of the 1994 Plague).
(iii) When concentrated risks are faced by a politically strong and vocal group (Surat
industry that relied on global diamond supply and demand).
(iv) When strong advocacy groups or civic groups are active and organized (Pune,
Kerala).
(v) When external nudges arrive from higher level governments or non-state external
actors via funding and technical assistanceIllustration: The Surat Story The floods and plague contagion of 1994 is generally regarded as an important turning point for Surat economic and climate performance. In a striking pivot around those events of 1994, the city went from being the dirtiest in the country to the cleanest by 1995/6. The same mediocre, ineffective bureaucracy turned around into more of the more efficient and capable local governments in the country. Strikingly, these changes have not faded with the passing of time, but have stayed for over 25 years – a remarkable feat in itself.
But Surat has had floods for a 100 years. Monsoon related disease and
mortality is endemic. Nothing changed before.

So what was different about 1994?

 (i) The nature of the disease – not isolated to poor quarters, but could potentially
     involve all

 (ii) A dent in the business reputation of the industrial elite – migrant workers fled,
      buyers hesitated to come in

 (iii) A public shaming of the local bureaucracy on a global scale – a calling into question of
       their competence.

 (iv) Could not label the twin events as “natural disaster” alone. It was human-made and
      avoidable; just like the 2006 floods would be for different reasons

 (v) With powerful political, economic and self-interests aligned, the city acted – in the
     public eye.
It is interesting to reflect on the sequence of SMC’s actions
To control a flood related disease contagion, they
1. acted on solid waste, garbage, sewerage and drainage first. Not on water.
2. Their initial spatial focus was the city’s slums, the poorest neighborhoods.
Cleaned out the garbage, set up solid waste collection mechanisms, paved the
road with Kota stone
Desilted the drains and fixed sewerage lines.
3. Organizational reforms came next. Street level bureaucrats and their two-way
interaction with middle managers lay at the core of the new accountability mechansism
that were set up – linking multiple levels
4. Then redoubled focus on securing the water system, focusing on:
- water source reforms
- quality
- distribution
- costs
- public healthBuilding up your own high water marks by acting and learning
They muddled through. No magic bullet
Still, by acting, learning occurred and capacity got built.
As you act you learn and create your own high water marks, build capacity to do more. It is messy and
often an act of muddling through.
The results brought public appreciation, and trust.
This helped build support (and demand) for sustaining such action.
Good performance also had financial consequences – Surat was able to increase fees and
property tax rates, with local support.
Good performance and adaptive outcomes can signal growing institutional capacity (awards
were won), which can draw the attention of higher levels of government – and later ACCCRN-
TARU– which in turn brought resources and new knowledge.
Program support from higher levels of government (JNNURM, Biogas initiative, Solar City) and
ACCCRN, in turn led to greater institutional clarity and institution building (NRW cell, EEEWS, SCC
Trust, and many more.At the same time this built public responsiveness from below When the city successfully aggregated demand for Round II for Rooftop solar It reached out via the press, and other ways to explain the services and benefits Got a huge response from RWAs and others that came forward to participate. Without bottom up support efficient top-down solutions are hard to sustain. That support comes about of credible performance, trust and engagement
EVEN so…

 ….It was the most visible problem that was addressed – flood risk, water, public health,
 and the nested sectors involved in this.

 Similar adaptive concerns did not neccessarily spill over into other areas (slow onset) –
 e.g., air quality, public transit, till much later.

 Same with green building now, even though there is great success with rooftop solar.

This suggests that sectoral strategies might have important latitudes and linkage
characteristics that might be worth exploring as potential entry points for adaptive action
Industrial Structure and Industrial Risks: When do firms
act on climate threats?
Finding 5: Rising temperatures have a significant negative Impact on Worker
Productivity, and through that mechanism on industry’s contribution to GDP
Little is understood of how climate impacts industrial productivity, and
if it does, little is known through what mechanisms the effects are channeled.
Used multiyear panel data of manufacturing plants in India, as well as daily worker
productivity data from selected case-study units in Surat and other settings*
Found that worker productivity declines by as much as 4 to 9 percent per degree rise in
temperature on hot days.
Sustained heat also increases absenteeism.
Similar temperature induced productivity declines were replicated in annual plant
output from a national panel.
Our estimates imply that warming between 1971 and 2009 may have decreased
manufacturing output in India by at least 3 percent relative to a no-warming
counterfactual.
*with Anant Sudarsha, E. Somanathan and R. SomanathanFinding 7: If left to the market, firm level adaptation to climate threats is likely to be
uneven and selective.
Firms, like cities, respond selectively to climate risks and primarily when threats
impact high value investments and output.
In both the textile and diamond industries, large and small, we found that the highest value-adding
Segments of the internal work-chain was climate controlled; not necessarily those with more workers.Policy Takeaways
If left to the market equitable outcomes may not be automatically be forthcoming for dealing
with extreme heat or other extreme events.
The government would need to intervene to ensure the lowest paid workers in the lowest
value adding segments of the work chain were also protected.
This also implies that cities need to pay closer attention to the location and design of urban
industrial zones.
Cool roofs, water bodies, green cover, green building technologies, alternative, lower
energy systems and alternative systems of lighting and air temperature control as well as
other urban planning innovations are needed to lower ambient temperatures and combat
urban heat island effects.
There exists an entrepreneurial opportunity for innovations related to finding low carbon and
energy intensive solutions to climate control of built spaces.
currently some of the smaller firms are traveling to china to look for affordable
clean/green options.
Finally, one of the most neglected industrial risks relates to industrial disasters (chemical
spills etc) during extreme events.
There are few standards that currently secure these assets in the face of climate threats.Finding 6: Climate Adaptation and Public Health Co-Benefits: Negative impact
on health and increased risk of disease
Cities face an increased risk of disease in the facing of rising temperature and
humidity. The benefits of adaptation or per person costs saved (including losses
averted), when aggregated across the exposed population city-wide, outweighs the
cost of adaptation
Policy Takeaways
Climate change induced probable increases in temperatures and rainfall are likely to have public
health consequences, notably by increasing the disease window in several Indian cities
Policy action will be needed to deal with this growing human and economic riskHow Does Urban Form Influence Climate Security?
Finding 7: Urban form can influence both economic productivity and the cost of a
climate security
A city’s spatial structure can shape its economic performance and environmental
effectiveness.
Compact cities are considered low carbon and climate safe.
However, the benefits of mixed use, compact, high Floor Area Ratio (FAR), dense cities
via a smaller ecological and transportation footprint are not automatic.
Supportive policies (such as transit oriented development and adequate green cover)
are needed to overcome diseconomies of urban density and negative ecological
externalities.
E.g., Surat. Compact, mixed use, but poor air quality because the city put public
transit on a back burner
A strong and effective modal shift is now happening in Surat as a result of extensive
investment in bus services.Finding 8: A city’s climate and economic security cannot be limited to city (municipal)
boundaries alone
Adaptive planning cannot be confined to narrow jurisdictional boundaries.
Food, water and mobility security depend upon urban, periurban and rural linkages; the
political economy of adaptation is a cross-boundary process.
Example: Surat’s flooding linked to forces outside the city (Ukai dam and the intensity of
precipitation in the related catchment area); but support also came from farmers outside city
borders. Same with fishermen during the Kerala floods.
The most effective response to flood management in Surat was also inter-jurisdictional and
collaborative -- the End-to-End Early Warning System (EEEWS) which linked Surat
municipality with the Ukai Dam management.
Case in point: the successful containment of the 2013 floods.
Our analysis of city development plans and a variety of other planning documents showed
that barring Kochi (2 municipalities 13 gram panchayats), all other 3 cities have plans
focusing on the city alone.Policy Takeaways
Regional scales allow for the combination and recombination of
multiple spatial scales that is key to adaptive planning.
Redundancy, overlap and inter-institutional, inter-state linkages are
crucial to building the trust and the knowledge systems that will help
foster effective responses to achieving climate security.Exclusions and Inclusions
Finding 9: A city’s economy is as climate secure as the weakest link in its chain

    Example: Surat. A fairly technocratic city government was compelled to first focus on the
    slums, secure the poor neighborhoods to deal with the disease catastrophe it faced in
    1994.

              It cleaned out the garbage, managed solid waste, paved the roads with kota
    stones, fixed the drains and connected them to sewer lines.
              This continued in the mid 2000s when it began moving them from low-lying
    unsafe areas.
              But when risks can be quarantined, then where is the motivation to be
    inclusive?
Migrant labor most vulnerable to climate impacts, especially new migrants
Surat & Kochi both have high levels of migration and share of migrant labor
Surat – majority single men living in overcrowded quarters in most
vulnerable parts of the city (next to khadis) with minimum income buffer to
safeguard from climate setbacks.
Weak access to services – housing, transport, health - especially new
migrants
This had wider repercussions for the urban economy
In Surat, the setbacks to the city’s economy from flooding were two-fold:
Direct impacts due to inundation of establishments (homes, businesses,
factories, etc.) and
indirect impacts resulting from interruption of supply chains for both
goods and labour because of flooding of transportation hubs and networks.
By securing its most vulnerable groups, a city can secure its wider economyFinding 10: Bringing Equity Back in At the end the biggest surprise was when our quantitative work resonated with what our case study and qualitative work in Surat, Kochi and Pune had already suggested: that a set of social factors associated with equity, inclusion, and literacy were associated with a city’s adaptive capacity as well as its relative competitiveness.
Using a two-step PCA analysis for 10 cities and then a correlation matrix for our 4
cities, five variables were identified as most significant (having the highest weights)
for both economic competitiveness and climate resiliency.

These were:

1.   Proportion of the population living in slums (.10)
2.   Proportion of waste water treated (.10)
3.   Availability of public transportation (.10)
4.   Literacy levels (.09)
5.   Employment shares (.08)

These indicators carried higher weights for being associated with both climate resiliency and
economic competitiveness than variables such as per capita investment on assets (.07), area
under green cover (.07), water supply cost recovery (.07), average trip length (.05), per capita
income (.05), government revenue expenditures (.05), among others.
Making the city a place of flourishing for all It is striking that variables connected to equity/welfare/inclusion/education and responsible use of resources (waste water treatment, public transit) are associated with a city’s climate resilience as well as economic competitiveness. This important finding reinforces our qualitative results that show that in the medium to long term a city’s resiliency and adaptiveness – both economic and climate related -- is limited by the extent of its inequities and urban disparities, and the fortune of its most vulnerable. Making progress on improving equity can help improve its economic drivers and climate resilience.
Conclusion - Resiliency Urbanism? An urbanism that speaks not of bouncing back to the status quo after disruptions – economic or climate related But one that is transformative Bouncing back, to do things differently each time, Reducing its use of resources each time, in all activities Reusing, Recycling, Renewing, Innovating, Being inclusive and Equitable Muddling through messy and incompletely understood experimentation – deliberatively, reflectively. Making cities places of human flourishing for all.
You can also read