Results Presentation Gavin Rochussen, Chief Executive Officer John Mansell, Executive Director Samir Ayub, Finance Director Twelve Months to 31 ...

Page created by Sara Burgess
 
CONTINUE READING
Results Presentation Gavin Rochussen, Chief Executive Officer John Mansell, Executive Director Samir Ayub, Finance Director Twelve Months to 31 ...
Results Presentation
          Gavin Rochussen, Chief Executive Officer
          John Mansell, Executive Director
          Samir Ayub, Finance Director
          Twelve Months to 31 March 2021

                                                                        polarcapital.co.uk

This presentation is for use with non-US professional investors only.
Results Presentation Gavin Rochussen, Chief Executive Officer John Mansell, Executive Director Samir Ayub, Finance Director Twelve Months to 31 ...
Agenda

Page 3           Overview & highlights

Pages 4-7        Market perspective & hybrid working

Pages 8-13       Fund performance & capacity

Pages 14-16      AuM & fund flows

Pages 17-23      Financial review

Pages 24-35      Strategy & outlook

Page 36          Questions

Page 37          Appendices

              This presentation is for use with non-US professional investors only. Please refer to the Important Information at the end of this presentation.
Results Presentation Gavin Rochussen, Chief Executive Officer John Mansell, Executive Director Samir Ayub, Finance Director Twelve Months to 31 ...
Overview & Highlights

                                                                                                    Significant
                                                                                                 progress in ESG
                                                                                                    integration
                                                                                                       within
                                                                                                    investment      Strong focus on
                                                                                                 processes and at
                                                     Core operating                               corporate level        digital
                                                    profit increased                                                 marketing has
                                                        by 24% to                                                   benefitted client
                                                         £51.5m.
                                                      Performance                            Established
                                                                                                                     diversification
                                                      fees enabled                            Phaeacian              during remote                 Strong cash
                                                    diluted total EPS
                                                                                         Partners in the US,            working                    generation
            Results reflect                          to increase by
                                                                                                                                                     enabled
                                                           53%                             acquired Dalton
             delivery of                                                                                                                             dividend
                                                                                              Strategic
              strategic                                                                                                                            increase of
                                                                                          Partnership, new
             objectives                             AuM increased
                                                                                                                                                      21% to
                                                                                             sustainable
                                                       71% from
                                                                                          thematic team to          Net inflows in the              40p/share
                                                      £12.2bn to
                                                       £20.9bn.                            join in Q3 2021          financial year of
                                                     Average AuM                                                         £2.1bn.
                                                    increased 18%                                                   Net inflows have
                                                      to £16.7bn                                                    continued in the
                                                                                                                      latest quarter

Source: Polar Capital, as at 31 March 2021. Past performance is not indicative or a guarantee of future results.

This presentation is for use with non-US professional investors only. Please refer to the Important Information at the end of this presentation.                 3
Results Presentation Gavin Rochussen, Chief Executive Officer John Mansell, Executive Director Samir Ayub, Finance Director Twelve Months to 31 ...
Market Perspective
                     & Hybrid Working

This presentation is for use with non-US professional investors only. Please refer to the Important Information at the end of this presentation.   4
Results Presentation Gavin Rochussen, Chief Executive Officer John Mansell, Executive Director Samir Ayub, Finance Director Twelve Months to 31 ...
Market Perspective
Global indices vs volatility

   90%                                                                                                       •   From the low point in March 2020, world equities staged
   80%
                                                                                                                 a remarkable rally into 2021, almost doubling in response
                                                                                                                 to significant central bank and government stimulus
   70%

   60%                                                                                                       •   The pandemic presented an environment of low interest
   50%
                                                                                                                 rates, low growth and flatter yield curves
   40%                                                                                                       •   This resulted in the acceleration of performance in the
   30%                                                                                                           technology sector and other “long-duration” growth areas
                                                                                                                 until deep into the 4th quarter of 2020
   20%

   10%                                                                                                       •   The prospect of further stimulus from a Democratic
    0%
                                                                                                                 administration and good news on vaccine efficacy marked
                                                                                                                 a change in market leadership
  -10%

  -20%                                                                                                       •   From November, more economically-sensitive sectors
                                                                                                                 rallied strongly – the so called ‘value’ stocks
  -30%

  -40%                                                                                                       •   Energy and financials, the worst performers in 2020 are
                                                                                                                 the best performers so far in 2021

                                                                                                             •   Inflation remains a concern and this will ultimately lead to
                   S&P 500 TR                              MSCI All-Country World Index
                                                                                                                 increasing rates over time
                   MSCI Emerging Market Index              FTSE 100 TR
                   VIX                                     DAX
Source: Bloomberg, as at 7 June 2021. Past performance is not indicative or a guarantee of future results.
All opinions and estimates constitute the best judgment of Polar Capital as of the date hereof, but are
subject to change without notice, and do not necessarily represent the views of Polar Capital.

This presentation is for use with non-US professional investors only.
Please refer to the Important Information at the end of this presentation.                                                                                                  5
Results Presentation Gavin Rochussen, Chief Executive Officer John Mansell, Executive Director Samir Ayub, Finance Director Twelve Months to 31 ...
Market Perspective
Net sales of funds across Europe (€m)

 300,000                                                                                                •   Equity funds across pan-Europe registered the 13th
                                                                                                            consecutive month of net inflows

                                                                                                        •   Active equity fund flows have been positive since
 200,000
                                                                                                            April 2020

                                                                                                        •   Monthly net flows into pan-European active equity funds
 100,000                                                                                                    increased in November 2020 and have remained the
                                                                                                            dominant asset class for net flows since then

        0

-100,000

-200,000

-300,000
            Jan Feb Mar Apr May June July Aug Sept Oct Nov Dec Jan Feb Mar Apr
                                          2020                                         2021

             Bond         Equity         Mixed Assets          Other         Cumulative Total

Source: Broadridge Fund File and Fund Radar, as at 30 April 2021. Data excludes funds of funds, money
market funds and ETFs (unless stated).

This presentation is for use with non-US professional investors only.
Please refer to the Important Information at the end of this presentation.                                                                                            6
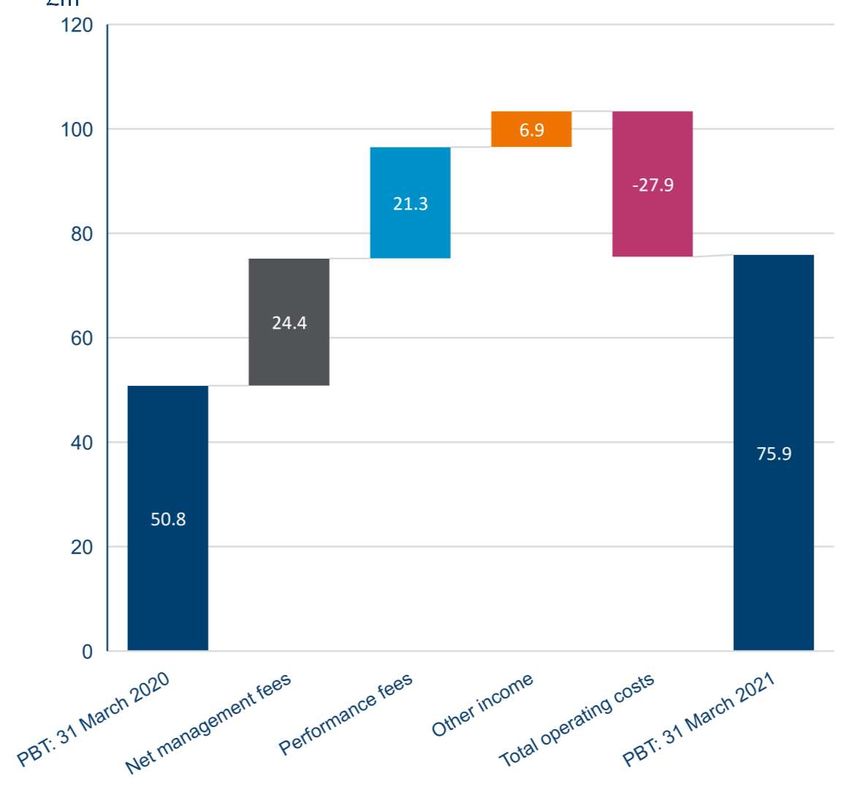
Results Presentation Gavin Rochussen, Chief Executive Officer John Mansell, Executive Director Samir Ayub, Finance Director Twelve Months to 31 ...
Hybrid Working
Post COVID-19 working environment

                                                                             •   Staff have worked remotely from home since March 2020

                                                                             •   The principal office has been opened for certain periods
                                                                                 when government guidelines permitted

                                                                             •   Staff have been able to attend the office where there are
                                                                                 benefits to wellbeing and for critical activities

                                                                             •   Pre booking via a mobile phone app is required to monitor
                                                                                 and track attendance

                                                                             •   A pivot to digital marketing and virtual presentations and
                                                                                 roadshows has been beneficial

                                                                             •   The office has been reconfigured for flexibility and
                                                                                 increased numbers safely distanced

                                                                             •   Increasing numbers are returning to the office

                                                                             •   Flexible working will continue but overlap collaboration
                                                                                 days will be a feature

Source: Polar Capital.

This presentation is for use with non-US professional investors only.
Please refer to the Important Information at the end of this presentation.                                                                    7
Results Presentation Gavin Rochussen, Chief Executive Officer John Mansell, Executive Director Samir Ayub, Finance Director Twelve Months to 31 ...
Fund Performance
                         & Capacity

This presentation is for use with non-US professional investors only. Please refer to the Important Information at the end of this presentation.   8
Results Presentation Gavin Rochussen, Chief Executive Officer John Mansell, Executive Director Samir Ayub, Finance Director Twelve Months to 31 ...
UCITS Performance
Annualised fund performance against benchmark (since inception)

     12%
                      1st Quartile
                      2nd Quartile
     10%              3rd Quartile
                      4th Quartile

      8%

      6%

      4%

      2%

      0%

     -2%

     -4%

Source: Polar Capital, 28 May 2021, Lipper quartile rankings as at 28 May 2021. Lipper Leaders fund ratings do not constitute and are not intended to constitute investment advice or an offer to sell or the solicitation of
an offer to buy any security of any entity in any jurisdiction. As a result, you should not make an investment decision on the basis of this information. Rather, you should use the Lipper ratings for informational purposes
only. Certain information provided by Lipper may relate to securities that may not be offered, sold or delivered within the United States (or any State thereof) or to, or for the account or benefit of, United States persons.
Lipper is not responsible for the accuracy, reliability or completeness of the information that you obtain from Lipper. In addition, Lipper will not be liable for any loss or damage resulting from information obtained from
Lipper or any of its affiliates. For Lipper methodology please go to: http://lipperalpha.financial.thomsonreuters.com/wp-content/uploads/2015/11/S026849-Method-Lipper-Leaders-Ratings-System-International.pdf Past
performance is not indicative or a guarantee of future returns.*Absolute return product, Fund does not have a benchmark. Funds ordered according to launch date. All data is based on the Fund’s base currency.

This presentation is for use with non-US professional investors only. Please refer to the Important Information at the end of this presentation.                                                                                   9
Results Presentation Gavin Rochussen, Chief Executive Officer John Mansell, Executive Director Samir Ayub, Finance Director Twelve Months to 31 ...
US 40 ACT, Cayman & LUX SICAV Performance
Annualised relative performance since inception
US 40 Act Funds                                                            Cayman Funds                                          LUX SICAV Funds
  3.0%                                                                       9.0%                                                4.5%

                                                                             8.0%                                                4.0%
  2.0%
                                                                             7.0%                                                3.5%

  1.0%                                                                       6.0%                                                3.0%

                                                                             5.0%                                                2.5%
  0.0%
                                                                             4.0%                                                2.0%
 -1.0%
                                                                             3.0%                                                1.5%

 -2.0%                                                                       2.0%                                                1.0%

                                                                             1.0%                                                0.5%
 -3.0%
                Accent         Global Value        Emerging                  0.0%                                                0.0%
            International      since 2011        Market Stars                            European Forager        China Mercury              European      European   Melchior Global
           Value launched                       launched 2021                             launched 2003          launched 2018            Opportunities  Long/Short Equity launched
                2011                                                                                                                     launched 2010 launched 2010     2010

  •     Accent International Value has                                       •      The European Forager manager, Rob            •      The track records of the three funds
        outperformed by 2.5% annualised for                                         Gurner, has retired and three co-                   acquired by Polar are positive since
        over a decade                                                               managers have managed the Fund                      inception with the largest fund,
                                                                                    since January 2021                                  European Opportunities annualising in
  •     While the original Global Value Fund
        was launched in 1958, the performance                                •      The China Mercury Fund is managed                   excess of 3.5% outperformance for
                                                                                                                                        over a decade
        above reflects the 10 year period                                           by two members of the EM Stars team,
        during which the team has managed                                           one of whom is an analyst in Shanghai
        the Fund for the majority of the time
  •     Recent launch into challenging markets
        but recovering
Source: Polar Capital, as at 28 May 2021. Past performance is not indicative or a guarantee of future returns.

This presentation is for use with non-US professional investors only. Please refer to the Important Information at the end of this presentation.                                   10
Performance
% of UCITS Funds AuM by quartile ranking

 100%                                                                                                    •   Over 93% of UCITS Fund AuM is in the top two quartiles
                                                                                                             measured against the Lipper peer group over three and
   90%                                                                                                       five years
                                                                                                         •   99% of UCITS Fund AuM is in the top two quartiles
   80%
                                                                                                             measured against the Lipper peer group since inception
                                                                                                             to 28 May 2021
   70%

   60%

   50%

   40%

   30%

   20%

   10%

    0%
                        3Y                            5Y                            SI

                 1st quartile       2nd quartile        3rd quartile       4th quartile

Source: Lipper, 28 May 2021. Totals may not sum due to rounding. Past performance is not indicative or
a guarantee of future results.

This presentation is for use with non-US professional investors only.
Please refer to the Important Information at the end of this presentation.                                                                                            11
Performance Against Benchmarks
Percentage of AuM & Funds that have
outperformed benchmark to 28 May 2021
                                                                                                        • After a strong performance year in 2020, the technology
                                                                                                          funds are currently lagging benchmark following weaker
                                                                                                          relative performance since the ‘vaccine’ rotation in
 YTD
                                                                                                          November

                                                                                                        • 48% of AuM outperformed benchmark over three years

                                                                                                        • 80% of AuM outperformed benchmark over five years
   3Y
                                                                                                        • 90% of AuM outperformed benchmark since inception

                                                                                                        • The majority of the Polar funds have outperformed their
                                                                                                          benchmark over three years, five years and since
                                                                                                          inception
   5Y

    SI

         0%             20%                40%               60%               80%               100%

          % of AUM outperformed Benchmark               % of Funds outperformed Benchmark

Source: Polar Capital, 28 May 2021. Totals may not sum due to rounding. All data is in sterling. Past
performance is not indicative or a guarantee of future results.

This presentation is for use with non-US professional investors only.
Please refer to the Important Information at the end of this presentation.                                                                                          12
Capacity
Capacity as at 28 May 2021

                                                                                                        •   Four teams added within past four years bringing an
               Technology                                                                                   additional total capacity of c.£15bn
                Healthcare
                                                                                                        •   Three teams have added extension strategies in the last
                  EM Stars                                                                                  four years also adding capacity
                 Phaeacian                                                                              •   The Phaeacian strategies added Global/ International
                                                                                                            Value equities
 European ex-UK Income

                     Dalton
                                                                                                        •   EM Stars has grown organically over almost three years
                                                                                                            and added sustainable emerging market equities
           North American
                                                                                                        •   European “quality growth” equities added through the
  UK Value Opportunities
                                                                                                            Dalton acquisition
          Global Insurance
                                                                                                        •   UK Value equities grown organically over four years at
                 Financials                                                                                 Polar following the team lift-out
              Convertibles                                                                              •   Total remaining capacity across all teams is estimated to
              Japan Value
                                                                                                            be in excess of £30bn

                    Forager

                              0      2000     4000      6000     8000     10000     12000    14000

                                  AUM (£ M)       Remaining Capacity

Source: Polar Capital, as at 28 May 2021. Totals may not sum due to rounding. Past performance is not
indicative or a guarantee of future results.

This presentation is for use with non-US professional investors only.
Please refer to the Important Information at the end of this presentation.                                                                                           13
AuM & Fund Flows

This presentation is for use with non-US professional investors only. Please refer to the Important Information at the end of this presentation.   14
AuM
25 June 2021

       bn
 £25                                                                                                    •   Assets under management have more than doubled from
            AuM CAGR 22.5%                                                                                  £9.3bn to £20.9bn over the four years to 31 March 2021
                                                                                            £22.7bn
            Average AuM CAGR 10.1%                                                £20.9bn
                                                                                                        •   The financial year to March 2021 saw the highest single
 £20
                                                                                                            year of growth in AuM of 71%
                                                                        £16.4bn
                                                                                                        •   The financial year to 31 March 2021 was a record year for
                              £14.7bn      £14.3bn
 £15
                                                                                                            Polar with net inflows of £2.1bn and a further £1.7bn AuM
                                     £13.8bn
                       £12.0bn                                                                              added through two acquisitions
                                                  £12.2bn
                 £10.6bn
                                                                                                        •   Over four years to March 2021, AuM has seen a
            £9.3bn
 £10                                                                                                        compound annual growth return of 22.5%

                                                                                                        •   Over four years to March 2021, average AuM has seen a
                                                                                                            compound annual growth return of 10.1%
   £5

   £0

                                        Total AuM           Avg AuM

Source: Polar Capital, 25 June 2021. All figures quoted in Pounds Sterling. Totals may not sum due to
rounding. Past performance is not indicative or a guarantee of future results.

This presentation is for use with non-US professional investors only.
Please refer to the Important Information at the end of this presentation.                                                                                            15
Net Flows by Strategy
                                                                                                                                                                                                                                                                                                                                                                                                      November 2020

Twelve months to 31 March 2021                                                                                                                                                                                              Seven months April 2020 to                                                                                                                                                                                      Seven months November 2020 to
                                                                                                                                                                                                                            October 2020                                                                                                                                                                                                    May 2021
           £2,000                                                                                                                                                                                                                      1,500.00                                                                                                                                                                                                            £500
Millions

                                                                                                                                                                                                                                                                                                                                                                                                                                                Millions
                                                                                                                                                                                                                            Millions
           £1,500
                                                                                                                                                                                                                                       1,000.00                                                                                                                                                                                                            £400
           £1,000
                                                                                                                                                                                                                                         500.00                                                                                                                                                                                                            £300
             £500
                                                                                                                                                                                                                                                                                                                                                                                                                                                           £200
               £-                                                                                                                                                                                                                             -
                                                                                                                                                                                                                                                                                                                                                                                                                                                           £100
            -£500                                                                                                                                                                                                                       (500.00)
                                                                                                                                                                                                                                                                                                                                                                                                                                                             £-
           -£1,000                                                                                                                                                                                                                     (1,000.00)
                                                                                                                                                Dalton Funds
                                                                                   UK Value
                     Technology
                                  Healthcare

                                                                       Insurance

                                                                                                                Global Convertibles
                                                                                                                                      Forager
                                               Emerging Market Stars

                                                                                              Phaeacian Funds

                                                                                                                                                                                       Financials
                                                                                                                                                                                                    Japan
                                                                                                                                                                                                            North America
                                                                                                                                                               European Income Ex UK

                                                                                                                                                                                                                                                                                                                                                                                                                                                           -£100

                                                                                                                                                                                                                                                                 Healthcare

                                                                                                                                                                                                                                                                                                      Insurance

                                                                                                                                                                                                                                                                                                                                                            Global Convertibles
                                                                                                                                                                                                                                                                                                                                                                                  Forager
                                                                                                                                                                                                                                                                                                                                                                                            Japan
                                                                                                                                                                                                                                                                                                                                                                                                    Financials
                                                                                                                                                                                                                                                                                                                                                                                                                 UK Value
                                                                                                                                                                                                                                                                                                                                                                                                                            North America
                                                                                                                                                                                                                                                    Technology

                                                                                                                                                                                                                                                                                                                  European Income Ex UK
                                                                                                                                                                                                                                                                              Emerging Market Stars

                                                                                                                                                                                                                                                                                                                                          Phaeacian Funds

                                                                                                                                                                                                                                                                                                                                                                                                                                                                                                         Insurance

                                                                                                                                                                                                                                                                                                                                                                                                                                                                                                                                  Japan

                                                                                                                                                                                                                                                                                                                                                                                                                                                                                                                                                                      Dalton Funds
                                                                                                                                                                                                                                                                                                                                                                                                                                                                                             UK Value

                                                                                                                                                                                                                                                                                                                                                                                                                                                                                                                                            North America
                                                                                                                                                                                                                                                                                                                                                                                                                                                                                           Technology
                                                                                                                                                                                                                                                                                                                                                                                                                                                                                            Healthcare

                                                                                                                                                                                                                                                                                                                                                                                                                                                                                                                      Global Convertibles

                                                                                                                                                                                                                                                                                                                                                                                                                                                                                                                                                  Forager

                                                                                                                                                                                                                                                                                                                                                                                                                                                                                                                                                            European Income Ex UK
                                                                                                                                                                                                                                                                                                                                                                                                                                                                   Emerging Market Stars

                                                                                                                                                                                                                                                                                                                                                                                                                                                                                                         Financials

                                                                                                                                                                                                                                                                                                                                                                                                                                                                                                                        Phaeacian Funds
                                                              12m to March 2021                                                                                                                                                                                                                                                                                                                                                                                                              7 Months to May 2021
                                                                                                                                                                                                                                                            7 months to October 2020
      •       In the reporting period to 31 March                                                                                                                                                                                                                                                                                                                                                                                           •              EM Stars net inflows increased due to
              2021, Technology dominated net                                                                                                                                                                                                                                                                                                                                                                                                               new Nordic channel yielding results
              inflows                                                                                                                                                                                                                                                                                                                                                                                                                       •              UK Value net inflows are a
      •       Net inflows from Healthcare, EM Stars,                                                                                                                                                                                                                                                                                                                                                                                                       consequence of Brexit deal,
              Insurance, UK Value and Phaeacian                                                                                                                                                                                                                                                                                                                                                                                                            performance and ‘Value’ rotation
              funds                                                                                                                                                                                                                                                                                                                                                                                                                         •              Insurance, Financials, Convertibles &
      •       Reduced rate of net outflows from                                                                                                                                                                                                                                                                                                                                                                                                            Phaeacian were beneficiaries of the
              North American and Japan Funds                                                                                                                                                                                                                                                                                                                                                                                                               ‘Value’ rotation
Source: Polar Capital, 28 May 2021. Totals may not sum due to rounding. Polar Capital UK Absolute Equity Fund, Asian Opportunities & Emerging Markets Income Fund are excluded due to closure during the period.
Past performance is not indicative or a guarantee of future results.

This presentation is for use with non-US professional investors only. Please refer to the Important Information at the end of this presentation.                                                                                                                                                                                                                                                                                                                                                                                                                                 16
Financial Review

This presentation is for use with non-US professional investors only. Please refer to the Important Information at the end of this presentation.   17
Financial Highlights

                                                                                                                           Profit before tax up 49% in 2021
                                                                                                                           Core operating margin up 1% to 36%
                                                         31-Mar           31-Mar                                    £m
                                                                                          Change
                                                          2021             2020
 AuM and Revenue
 Average AUM (£bn)                                         16.7             14.1             18%
 Net management fees (£m)                                 142.5            118.1             21%
 Net management fee yield                                  85bp             84bp             1bp

 Profitability and other income (£m)
 Core operating profit1                                    51.5             41.6             24%
 Core operating profit margin                              36%              35%               1%

 Performance fee profit1                                   19.5              8.8            122%
 Other income1                                              7.4              0.5           1380%
 Profit before tax                                         75.9             50.8             49%

 Earnings per share and dividend
 (pence)
 Adjusted total EPS2                                       62.2             40.7             53%
 Dividend per share                                        40.0             33.0             21%
Source: Polar Capital as at 31 March 2021. 1. Refer to RNS (Financial Review and APM page) for reconciliation to reported results. 2. Adjusted for IFRS costs of preference shares included in share based payments,
deferred remuneration costs and exceptional items.

This presentation is for use with non-US professional investors only. Please refer to the Important Information at the end of this presentation.                                                                       18
Operating Costs

                                                                                               Variable compensation costs up in line with profitability
                                                                                               Cost discipline maintained
                                           Year to                 Year to
                                           Mar-21                  Mar-20    Change            Core operating margin up 1% to 36%
                                             £m                      £m                          £m

 Salaries, bonuses and
                                             29.1                   25.6      14%
 other staff costs1

 Core distributions                          38.5                   27.7      39%

 Share-based payments1                        2.9                    3.0      -3%

 Performance fee
                                             24.4                   13.5      81%
 interests1

 Staff compensation costs                    94.9                   69.8

 Other operating costs2                      23.6                   20.8      13%

 Total operating costs                      118.5                   90.6      31%

Source: Polar Capital as at 31 March 2021.
1. Refer to RNS (Finance Review and APM page) for reconciliation
2. Inclusive of exceptional items of £2.8m

This presentation is for use with non-US professional investors only. Please refer to the Important Information at the end of this presentation.       19
Other Operating Costs

                                                         Year to            Year to
                                                         Mar-21             Mar-20
                                                           £m                 £m
                                                                                               • Other operating costs before exceptional items remain flat
 IT                                                        6.6                6.4                compared to prior year
 Rent and rates                                            2.8                2.7              • Termination and reorganisation costs of £6.2m were anticipated at
                                                                                                 the time the Dalton acquisition was announced. Of this total,
 Professional fees                                         1.9                1.8                £2.4m has been incurred in the current year with the remaining to
                                                                                                 be incurred in FY22
 Research                                                  3.1                3.6
                                                                                               • Reduced travel and related spend as a result of the pandemic.
 Corporate access                                          0.3                0.3                Some increase to be expected as restrictions lift
 Insurance & regulation                                    0.7                0.6

 Travel & entertainment                                    0.5                1.9

 Staff recruitment                                         0.3                0.1

 Irrecoverable VAT                                         1.9                1.5

 Sponsorship/ PR                                           0.7                0.7

 Other                                                     2.0                1.2               Exceptional costs (£m)

                                                           20.8               20.8              Termination and reorganisation costs                     2.4

 Exceptional costs                                         2.8                  -               Amortisation of intangibles                              0.4

 Other operating costs                                     23.6               20.8                                                                       2.8

Source: Polar Capital as at 31 March 2021.

This presentation is for use with non-US professional investors only. Please refer to the Important Information at the end of this presentation.                     20
Cash and Seed Investments

                                             2021                                                                                      2020
           Total cash and seed investments of £175.7m                                                     Total cash and seed investments of £137.9m

                                                            Seed investments               39.0                                                    Seed investments           30.1
                                                            Cash                          136.7                                                    Cash                      107.8
                                                                                          175.7                                                                              137.9

                                                            EM Stars US mutual              7.3                                                     EM Stars UCITS             7.1
                                                            China Stars                     7.3                                                     China Stars                5.1
                                                            China Mercury                   4.2                                                     China Mercury              3.9
                                                            Global Absolute Return         10.1                                                     Global Absolute Return     7.6
                                                            Asia Stars                      7.5                                                     Asia Stars                 4.7
                                                            Healthcare Discovery            2.2                                                     Healthcare Discovery       1.4
                                                            Miscellaneous                   0.4                                                     Miscellaneous              0.3
                                                                                           39.0                                                                               30.1

• Strategic seeding programme supporting six funds (2020: six funds)
• EM Stars UCITS seed money redeemed and EM Stars US Mutual Fund seeded in 2021
• Overall increase in seed portfolio due to gain in fair values

Source: Polar Capital as at 31 March 2021.

This presentation is for use with non-US professional investors only. Please refer to the Important Information at the end of this presentation.                              21
Group Capital

                                                                                                                                                   Year to   Year to
Capital allocation (£m)
                                                                                                 Regulatory Capital                                Mar-21    Mar-20
 160                                                                                                                                                 £m        £m
                           151.4
 140                                                                                             Shareholder funds                                 151.4     116.1
                            36.0
 120                                                            116.1
                                                                  8.3
 100                        30.0
                                                                 23.5                            Less: deferred tax and capital reserves            -11.0     -8.3
   80
                            21.4
                                                                 34.2                            Less: Goodwill and intangible assets               -25.0       -
   60
                            25.0
   40                                                            20.0                                                                              115.4     107.8

   20                       39.0
                                                                 30.1
    0
                            2021                                 2020
                                                                                                 Less: dividend provision                           -30.0     -23.5
            Seed capital                               Working capital - Regulatory
            Working capital - General                  Proposed final dividends                                                                     85.4      84.3
            Other items non cash
                                                                                                 Regulatory capital                                 -25.0     -20.0
Framework for use of capital

                           Maintain strong
                          balance sheet for                                                      Surplus capital                                    60.4      64.3
   Seeding new                                   Return of          Share buy back
                          future growth and
   product ideas                                  capital            programme
                          to provide market
                                buffer

Source: Polar Capital as at 31 March 2021.

This presentation is for use with non-US professional investors only. Please refer to the Important Information at the end of this presentation.                       22
Dividend Policy

                                                                                                                                           •    Total dividend of 40p up 21%
 70p                                                                                                                             45p
                                                                                                                       40.0p
                                                     CAGR 12%                                                                              •    64% pay-out ratio on adjusted total EPS
                                                                                                                                 40p
 60p
                                                                      33.0p
                                                                                                                                           •    Over four years to 31 March 2021 the
                                                                                                                 62.2p           35p
                                                                                                    33.0p
                                                                                                                                                total dividend has grown at a CAGR of
 50p
                                                                                                                                                12%
                                           28.0p                                                                                 30p
                                                                              51.5p

 40p
                                                                                                      40.7p
                                                                                                                                 25p       Policy
                   25.0p
                                                   36.6p                                                                                   •    The policy in respect of the first interim
               20.4p                                                                                                             20p
 30p                                                                                                                                            dividend paid each January is that half of
                                                                                                                                                the first half’s core earnings are paid out
                                                                                                              31.0p              15p
 20p                                                          25.0p                      25.0p
                                   22.0p
                                                                                                                                           •    Under normal circumstances the Group
       19.5p                                                                                                                     10p            would expect to pay a total annual
 10p                                                                                                                                            dividend within a range of 55% to 85% of
                                                                                                                                 5p             adjusted total earnings, with the exact
                                  6.0p                         8.0p                      8.0p                   9.0p                            quantum being dependent on the scale of
        5.5p
  0p                                                                                                                             0p             performance fee profits in any given year
               Mar-17                    Mar-18                  Mar-19                    Mar-20                Mar-21                         but also on the short-term trading
           £80.6m                        £106.3m                 £147.6m                  £137.9m               £175.7m        Total cash and   conditions of the Group
                                                                                                                                investments
                  First interim dividend            Second interim dividend           Adj. diluted EPS        Total dividend

Source: Polar Capital as at 31 March 2021.

This presentation is for use with non-US professional investors only. Please refer to the Important Information at the end of this presentation.                                         23
Strategy and
                             Outlook

This presentation is for use with non-US professional investors only. Please refer to the Important Information at the end of this presentation.   24
Strategy Update – Growth with Diversification
Sustainability

                Responsible investing
                • Teams formulate and implement the right responsible investing strategy for their funds
                • Investment teams supported by Head of Sustainability, Sustainability Committee, CIO,
                  CRO and Risk team
                • ESG forms oversight and review of funds’ ESG profiles and characteristics
                • Signatory to the United Nations Principles for Responsible Investing (UNPRI),
                  participating member of Climate Action 100+
                Corporate responsibility
                • Over the past year, we have focused efforts on evolving our understanding of our
                  carbon impact, working with a specialist climate consultant to determine our
                  Scope 1 and 2 footprint and undertaken a Scope 3 emissions gap analysis and
                  modelling exercise, setting goals for progressing our climate change strategy
                • We have partnered with a local school to build a meaningful, long-term                                                 Sustainability
                  relationship for direct impact on the local community
                • Two awards will be made to fund two undergraduates each year with full tuition
                  fees and an annual living allowance for their full three year degrees
                • We have contributed funding to enable the school to provide 94 laptops to
                  students who had no means of home schooling
                • In 2021, we partnered with the charity ‘Heal’ which was established to respond to
                  the biodiversity emergency
                Our people
                • Established our Diversity and Inclusion Committee, formed to promote and foster
                  a culture of inclusion and diversity at Polar and within the industry.
                • In 2021, we welcomed our first six trainees from Investment 2020, the industry
                  recruitment programme focused on widening access to diverse talent.
                • Member of #includedAWM promoting diversity and inclusion in the Wealth and
                  Asset Management
Source: Polar Capital.

This presentation is for use with non-US professional investors only. Please refer to the Important Information at the end of this presentation.          25
Strategy Update – Growth with Diversification
Proposed new team for September 2021 launch

   A sustainable thematic strategy focussing on clean energy & clean mobility

                                                                                               •      Team of four investment professionals and two specialist staff,
                                                                                                      headed by Thiemo Lang, previously running €5bn

                                                                                               •      Long track record in sustainable equity strategies; expertise in
                                                                                                      energy, decarbonisation, EV/AV themes

                                                                                               •      Polar plans to launch two new strategies for the team – both
                                                                                                      expected to be categorised as Article 9 under SFDR

                                                                                               •      Strong client demand for these strategies in multiple jurisdictions

                                                                                               •      Builds on the sustainability capability of Polar’s EM Stars and
                                                                                                      Insurance teams

Source: Polar Capital.

This presentation is for use with non-US professional investors only. Please refer to the Important Information at the end of this presentation.                         26
Strategy Update – Growth with Diversification
Distribution and Client Servicing

                                                                                                     Dalton Strategic                                    Institutional
       Asian client base                             Phaeacian Partners
                                                                                                  Partnership acquisition                            Segregated mandates

• Asian client base                              • Phaeacian Partners                           • Dalton Strategic Partnership                     • Total of seven segregated
  increased to over $2bn in                        acquisition added £528m                        acquisition added £1.3bn of                        mandates added in 2021
  three years                                      of International & Global                      European equities and £4bn                         CYTD, including four in
                                                   Value Equities, and                            of total capacity                                  recent Dalton acquisition,
                                                   £4.5bn of total capacity                                                                          amounting to in excess of
                                                                                                • Luxembourg SICAV                                   £700m
                                                 • US 40 Act Mutual Fund
                                                   range                                        • Segregated mandates                              • Three significant
                                                                                                                                                     segregated mandates
                                                 • Segregated mandates for                      • Alternative funds                                  added after year end in
                                                   institutional clients and                                                                         the June 2021 quarter
                                                   sub-advised relationships

                                                 • Delaware Statutory Trust
                                                   Fund vehicle for
                                                   institutional clients

Source: Polar Capital.

This presentation is for use with non-US professional investors only. Please refer to the Important Information at the end of this presentation.                                  27
Strategy Update – Growth with Diversification
Additional capacity added in past four years

                                                                                                                 Capacity                     AuM1
    Calendar year                     Strategy                 Type                      Style                                                          Net Flows YTD
                                                                                                                   £bn                         £m

           2017                       UK Value                Lift-out                   Value                       2.5                      1,571

           2017                          A&AI               Extension                   Growth                       2.1                       505

                                                                                     Sustainable
           2018                       EM Stars                Lift-out                                                5                        617
                                                                                       Growth
                                   Convertible
           2019                                             Extension             Absolute Return                    1.4                           34
                                 Absolute Return
                                     Healthcare
           2020                                             Extension                   Growth                      0.35                           46
                                     Discovery
                                    International/         Acquisition
           2020                                                                     Value/ Quality                   4.5                       519
                                    Global Value          (Phaeacian)
                                 European/Global           Acquisition            Quality Growth &
           2021                                                                                                       4                       1,316
                                     equities               (Dalton)              Absolute Return
                                    Sustainable              Lift-out                Sustainable
           2021                                                                                                      8.5                           -
                                   Article 9 funds       (1 September)                 Growth

                                8 Fund strategies                                                                £28.35bn                   £4,600m

Source: 1. Polar Capital, as at 28 May 2021.

This presentation is for use with non-US professional investors only. Please refer to the Important Information at the end of this presentation.                        28
Strategy Update – Growth with Diversification
Fund Range Developments
Dublin UCITS umbrella:                                              Cayman Funds:                                      Luxembourg SICAV umbrella
• Emerging Markets Income Fund merged                               • European Forager team                            • Acquisition of Dalton Strategic
  into Emerging Market Stars Fund                                     reconfigured following                             Partnership brought a Luxembourg
• Asian Opportunities Fund merged into                                retirement of lead manager                         SICAV range to Polar
  Financial Opportunities Fund
• Suspension and closure of UK Absolute
  Return Equities Fund

                                  Investment Trusts:                                          US Mutual Fund 40 Act                                Segregated Mandates:
                                  • Global Financials Investment Trust                        Series Trust:                                        • Seven new mandates to Polar
                                    continuation vote in 2020                                 • Proxy vote successful for the                        in 2021
                                  • Significant demand post continuation                        acquisition of First Pacific
                                    meant the discount narrowed and the trust                   Advisors International and
                                    traded at a premium post the ‘vaccination’                  Global Value Funds
                                    rotation                                                  • Emerging Market Stars 40 Act
                                  • Successful C share roadshow resulting in                    launched
                                    excess of £100m in additional equity
Source: Polar Capital.

This presentation is for use with non-US professional investors only. Please refer to the Important Information at the end of this presentation.                                   29
Strategy Update – Growth with Diversification
Digital Marketing

  Jan 2020 – April 2021
                        Website                                    Webcasts                                   Website Traffic                            E-mail

           6 Websites launched                                   20 webcasts                                      Up 150%                            60,000 clients
                                                                                                                                                   reached through our
                                                        2,400 clients participated
                                                                                                                                                    E-mail campaigns
                                                        of which 25% new clients
                                                      to Polar Capital, broadening
                                                             our client base

• Lockdown significantly accelerated our digital marketing strategy, with consumption of digital content increasing in lieu of
  direct face-to-face contact.

• Since January 2020, we have completely overhauled our digital marketing infrastructure, launching six websites, including
  for our US affiliate, Phaeacian Partners; Polar Capital’s US business – which includes a dedicated site for Institutional
  investors – plus our three investment trusts.

• In the latest study from Broadridge, Polar Capital was, for the first time, ranked in the top 5 of all groups in the UK for Fund
  Manager Access.

Source: Polar Capital

This presentation is for use with non-US professional investors only. Please refer to the Important Information at the end of this presentation.                         30
Strategy Update – Growth with Diversification
Polar Capital ranked 2nd in the UK for Brand Preference

• Marketing is an area Polar Capital has invested significantly in over the past couple of years, with lockdown having
  accelerated many of the initiatives we had in place. The Marketing team has now trebled in size since January 2020
• Following this investment, Polar Capital is now ranked 2nd in the UK for Brand Preference in the Broadridge Fund Buyer 50
  survey

            Brand Preference Ranking (UK)                             Polar Capital UK Brand Preference Ranking

                                                                                1

                                                                                2
                                                                                                                                                                2nd
                                                                                3

                                                                                4                                                                       4th
                                                                                         5th
                                                                                5
                                                                         Rank

                                                                                6

          Polar Capital Ranked                                                  7
                                                                                                                                  7th

                            2nd
                                                                                8
                                                                                                             8th
                                                                                9

                                                                                10
                                                                                      Q1 2020             Q2 2020            Q3 2020               Q4 2020    Q1 2021

Source: Polar Capital and Broadridge

This presentation is for use with non-US professional investors only. Please refer to the Important Information at the end of this presentation.                        31
Strategy Update – Growth with Diversification
Polar Capital rankings in Broadridge UK Fund Buyer 50 Report

     Polar Capital UK Ranking

Source: Polar Capital and Broadridge

This presentation is for use with non-US professional investors only. Please refer to the Important Information at the end of this presentation.   32
Strategy Update – Growth with Diversification
Broadridge UK Fund Buyer 50 Survey: 2nd for Product Quality
• As an investment-led boutique, the quality of our investment offering is paramount. Our products are a mix of thematic and
  regional funds, capacity constrained, and registered for sale in many jurisdictions.

• Of our 22 OEICs and SICAVs, 19 hold either a Morningstar Analyst Rating or Morningstar Quantitative Rating

Morningstar1

                                                                                                                             11 of our fund managers have a Citywire manager
                        3                                                                                                    rating2

              2                                                     Morningstar Gold

                                                    10              Morningstar Silver
                                                                    Morningstar Bronze
                                                                    Non rated                                                4 of our fund managers are ranked as FE Alpha
                                                                                                                             Managers 20213
                   7

                                                                                                                             Our funds have received 30 awards since
                                                                                                                             January 2020

Source: Polar Capital. Morningstar as at 31/03/2021. 1. ©2021 Morningstar. All Rights Reserved. The information contained herein: (1) is proprietary to Morningstar and/or its content providers; (2) may not
be copied or distributed; and (3) is not warranted to be accurate, complete or timely. Neither Morningstar nor its content providers are responsible for any damages or losses arising from any use of this
information. 2. Source & Copyright: CITYWIRE 3 year risk-adjusted performance for the period 31/03/2018 - 31/03/2021. 3. FE Awards: FE Crown Fund Ratings & FE Alpha Manager Ratings do not
constitute investment advice offered by FE and should not be used as the sole basis for making any investment decision. All rights reserved.

This presentation is for use with non-US professional investors only. Please refer to the Important Information at the end of this presentation.                                                                33
Strategy Update – Growth with Diversification
Broadridge UK Fund Buyer 50 Survey: 4th for Sales & Account Management

 • Our approach at Polar Capital is to                                                                2 additions in Europe
   deliver a specialist investment                                          2 additions in US
   offering with a premium service to                                                                                        Head of Asia- Pacific added
   our clients. In Broadridge’s Fund
                                                                                                                           AFRICA
   Buyer 50 survey, we were ranked 4th
   in the UK for Sales & Account
   Management which is testament to
   the quality of our offering

 • Our focus remains on growth and
   diversification, by both
   fund/investment team and by
   channel/geography. To support our
   strategy, we have added six
   experienced individuals to our
   international sales team

 • New mandates won for significant
   distributors, including UBS, a UK                               Our focus remains on growth with diversification, by both channel and geography, and we see
   high street bank and a Swiss private                            significant opportunities outside of our home market of the UK.
   bank                                                            We continue to broaden and deepen our presence and support in Continental Europe – including key
                                                                   markets, such as Switzerland, Germany, France and Spain.
                                                                   Our approach to wider expansion is both targeted and measured. We continue to invest in regions
                                                                   where we see significant, long-term opportunities for growth. We have made senior distribution
                                                                   appointments in the US, Asia and the Nordics, facing both wholesale and institutional channels, and
                                                                   all three regions will be a focus going forward.

Source: Polar Capital

This presentation is for use with non-US professional investors only. Please refer to the Important Information at the end of this presentation.                     34
Summary & Outlook

                                                                                                                   The arrival in
                                                                                                                   September of
                                                                                                                  the Sustainable
                                                          The strategy                                               Thematic
                                                           is yielding                                             Equities team
                                                                                                                     provides
                                                             results                                                                          An increasingly
                                                                                                   A strong          additional
                       Achieved                                                                                    “sustainable”              diverse range of
                                                                                                balance sheet
                                                                                                                      capacity                active specialist
                        strong                                                                     provides
                                                                                                                                               strategies with
                     growth in an                                                               optionality to
                                                                                                                                                   capacity,
                                                                                                drive strategic
                     extraordinary                                                              direction and
                                                                                                                                              positions Polar
                          year                            The increased                                              Investment in                  well for
                                                                                               take advantage
                                                         number of fund                                           technology across               continued
                                                                                               of opportunities     our investment,
                                                          structures give                                                                           growth
                                                                                                                      operations,
                                                           global clients
                                                                                                                    distribution and
                                                         more choice and                                            client servicing
                                                         enables Polar to                                         has yielded results
                                                              deepen                                                 and provides
                                                           relationships                                          further opportunity

Source: Polar Capital, 31 March 2021. Past performance is not indicative or a guarantee of future results.

This presentation is for use with non-US professional investors only. Please refer to the Important Information at the end of this presentation.                  35
Thank You

                              Questions?

This presentation is for use with non-US professional investors only. Please refer to the Important Information at the end of this presentation.   36
Additional
                              Information

This presentation is for use with non-US professional investors only. Please refer to the Important Information at the end of this presentation.   37
Current Investment Strategies
   Technology                                                            AuM: £10.1bn            Japan                                                           AuM: £148m
   Established: 2001                                  • Technology Trust                         Established: 2001                             • Japan Value (UCITS)
   Typical number of positions: 50-140 • Global Technology (UCITS)                               Typical number of positions: 45-55
   Team size: 10                                      • Automation & Artificial                  Team size: 2
                                                        Intelligence (UCITS)
   Years’ experience: 150+                                                                       Years’ experience: 25+

   European Long/Short                                                    AuM: £119m             Healthcare                                                      AuM: £3.1bn
   Established: 2003                                  • European Forager                         Established: 2007                             • Global Healthcare Trust
                                                        (Cayman Fund)                                                                          • Healthcare Opportunities (UCITS)
   Typical number of positions: 80-120                                                           Typical number of positions: 25-80
                                                                                                                                               • Biotechnology (UCITS)
   Team size: 3                                                                                  Team size: 6
                                                                                                                                               • Healthcare Blue Chip (UCITS)
   Years’ experience: 35+                                                                        Years’ experience: 130+                       • Healthcare Discovery (UCITS)

   Financials                                                             AuM: £354m             Convertibles                                                    AuM: £791m
   Established: 2010                                  • Income Opportunities (UCITS)             Established: 2010                             • Global Convertible (UCITS)
                                                      • Financial Opportunities                                                                • Global Absolute Return Fund
   Typical number of positions: 35-150                  (UCITS)                                  Typical number of positions: 40-80
                                                                                                                                                 (UCITS)
   Team size: 5                                       • Global Financials Trust                  Team size: 5
   Years’ experience: 90+                                                                        Years’ experience: 115+

   North America                                                           AuM: £847m            Global Insurance                                                AuM: £1.8bn
   Established: 2011                                  • North American (UCITS)                   Established: 1998                             • Global Insurance (UCITS)

   Typical number of positions: 40-60                                                            Typical number of positions: 30-35
   Team size: 4                                                                                  Team size: 2
   Years’ experience: 70+                                                                        Years’ experience: 30+

Source: Polar Capital, 28 May 2021. Totals may not sum due to rounding

This presentation is for use with non-US professional investors only. Please refer to the Important Information at the end of this presentation.                                38
Current Investment Strategies

    European ex UK Income                                                 AuM: £152m               UK Value                                                         AuM: £1.6bn
    Established: 2014                                  • European ex UK Income (UCITS)                                                             • UK Value Opportunities (UCITS)
                                                                                                   Established: 2017
    Typical number of positions: 25-50                                                             Typical number of positions: 30-100
    Team size: 3                                                                                   Team size: 2
    Years’ experience: 20+                                                                         Years’ experience: 30+

    Emerging Markets Stars                                                AuM: £617m               Phaeacian Partners                                               AuM: £519m
    Established: 2018                                  • Emerging Markets Stars (UCITS)                                                            • Accent International Value
                                                                                                   Established: 2020
                                                       • China Stars (UCITS)                                                                       • Global Value
    Typical number of positions: 30-90                                                             Typical number of positions: 30-40
                                                       • China Mercury (Cayman fund)
    Team size: 5                                                                                   Team size: 6
                                                       • Asia Stars (UCITS)
    Years’ experience: 60+                             • Emerging Markets Stars (40 Act)           Years’ experience: 90+

    Dalton                                                                AuM: £1.3bn
    Established: 2021                                  • European Opportunities (LUX
                                                         SICAV)
    Typical number of positions: 50-80 • European Long/Short (LUX
    Team size: 9                         SICAV)
                                                       • Global Equity (LUX SICAV)
    Years’ experience: 160+

Source: Polar Capital, 28 May 2021. Totals may not sum due to rounding.

This presentation is for use with non-US professional investors only. Please refer to the Important Information at the end of this presentation.                                  39
Lipper Figures for Long and Alternative UCITS – as at 28 May 2021
                                                                                                    1 Year                         3 Years                       5 Years                         Since
                                                                     AuM £m
                                                                                                   Percentile                     Percentile                    Percentile                     Inception
 Japan Value (S JPY)                                                     148                            85                             86                            63                           68
                                                                                                                                                                                                31/10/2012
 Healthcare Opportunities (I USD)                                      1,456                            61                             46                            18                            6**
                                                                                                                                                                                                3/12/2007
 Healthcare Blue Chip (I USD)                                            71                             60                             45                            42                             40
                                                                                                                                                                                                11/9/2014
 Financial Opportunities (I USD Inc)                                     11                             25                             52                            59                             41
                                                                                                                                                                                                 3/5/2011
 Income Opportunities (I GBP)                                            59                              1                             26                             9                                 6
                                                                                                                                                                                                15/10/2009
 Global Insurance (I GBP)                                              1,752                            83                             37                            40                           25***
                                                                                                                                                                                                19/10/1998
 Global Technology (I USD)                                             6,338                            78                             23                            12                            13**
                                                                                                                                                                                                19/10/2001
 North American (I USD)                                                  847                            13                             70                            49                             29
                                                                                                                                                                                                15/11/2011
 Global Convertible (I USD Acc)                                          758                            62                             35                            26                             10
                                                                                                                                                                                                 2/9/2013
 Biotechnology (I USD)                                                 1,020                            25                             6                              7                                 4
                                                                                                                                                                                                1/11/2013
 European ex-UK Income (I EUR)                                           152                            72                             26                            24                             14
                                                                                                                                                                                                30/06/2015
 UK Value Opportunities (I GBP)                                        1,571                            20                             35                           N/A                             28
                                                                                                                                                                                                31/01/2017
 Automation & AI (I USD)                                                 505                            49                             5                            N/A                                 5
                                                                                                                                                                                                6/10/2017
 Emerging Markets Stars (R USD)                                          504                            40                            N/A                           N/A                                 6
                                                                                                                                                                                                  29/6/18
 China Stars (R USD)                                                     10                             49                            N/A                           N/A                             20
                                                                                                                                                                                                31/08/2018
 Asian Stars (I USD)                                                     89                             34                            N/A                           N/A                                 8
                                                                                                                                                                                                31/12/2018
 Global Absolute Return (I USD)                                          34                             55                            N/A                           N/A                             35
                                                                                                                                                                                                31/12/2018
 Healthcare Discovery (I USD)                                            46                              8                            N/A                           N/A                                 7
                                                                                                                                                                                                31/01/2020
 %AuM in top quartile (excl hedge funds,
 managed accounts & trusts)                                         £15,394m                           23%                           53%                            71%                            82%

Source: Lipper, 28 May 2021. Totals may not sum due to rounding. * JPY Share Class ** USD Share Class *** B GBP Acc Share Class. Past performance is not indicative or a guarantee of future results.

This presentation is for use with non-US professional investors only. Please refer to the Important Information at the end of this presentation.                                                             40
Alternative Strategies
As at 28 May 2021

                                                                                                                                                Annualised returns

  Strategies                                                             Inception date                        YTD                    3 years         5 years        Inception

  Forager (AX EUR)                                                       1 August 2003                        9.39%                   3.55%           4.29%           7.74%

  China Mercury (AX USD)                                                 1 August 2018                        4.10%                      -               -            5.95%

Source: Polar Capital. Basis: Net of fees. Currency as stated. Past performance is not indicative or a guarantee of future results.

This presentation is for use with non-US professional investors only. Please refer to the Important Information at the end of this presentation.                                 41
AuM Analysis

 AuM by strategy                                                                                       Investor mix by geography

     Long only                     95.1%                                                                    UK                              53.1%

     Alternative                    4.9%                                                                    Europe                          37.2%

                                                                                                            Asia                              7.1%

                                                                                                            USA                               2.5%
     Open Ended Funds              81.5%
     Investment Trusts             18.5%

 AuM by investment team                                                                                Investor mix by holdings
     Tech                    49.1%
                                                                                                           Bank                             24.5%
     Healthcare              14.1%
     Insurance                8.1%                                                                         Platform                         23.6%
     UK Value                 6.9%                                                                                                          18.9%
                                                                                                           Polar Investment Trusts
     Dalton                   5.9%
                                                                                                           Private Wealth Manager           15.3%
     North American           4.0%
     Convertibles             3.7%                                                                         Asset Manager                      9.3%
     Phaeacian                2.4%
                                                                                                           Fund of Funds                      3.3%
     Emerging Markets & Asia 2.0%
     Financials               1.6%                                                                         Other                              1.8%
     European (Long/Short)    0.7%                                                                                                            1.6%
                                                                                                           Insurance Company
     European Income          0.7%
                                                                                                           Family Office                      1.0%
     Japan                    0.6%
     Emerging Markets Income 0.2%                                                                          Pension Fund/Foundation            0.7%
Source: Polar Capital, 31 March 2021. Totals may not sum due to rounding. The Emerging Markets Income Fund merged into the Emerging Markets Stars Fund on 8 June 2021.

This presentation is for use with non-US professional investors only. Please refer to the Important Information at the end of this presentation.                         42
Important Information
                                                                                                                                                             Polar Capital, 16 Palace Street, London SW1E 5JD
House View This document has been produced based on Polar Capital research and analysis and represents our house view. All sources are Polar Capital unless otherwise stated.
Important Information The information provided in this presentation is for the sole use of those attending the presentation it shall not and does not constitute an offer or solicitation of an offer to make an investment into
any fund managed by Polar Capital. It may not be reproduced in any form without the express permission of Polar Capital and is not intended for private investors.

This presentation is only made available to professional clients and eligible counterparties. Shares in the funds should only be purchased by professional investors. Any other person who receives this presentation should
not rely upon it.
Statements/Opinions/Views All opinions and estimates in this report constitute the best judgment of Polar Capital as of the date hereof, but are subject to change without notice, and do not necessarily represent the
views of Polar Capital. Polar Capital is not rendering legal or accounting advice through this material; readers should contact their legal and accounting professionals for such information.
Third-party Data Some information contained herein has been obtained from other third party sources and has not been independently verified by Polar Capital. Polar Capital makes no representations as to the
accuracy or the completeness of any of the information herein. Neither Polar Capital nor any other party involved in or related to compiling, computing or creating the data makes any express or implied warranties or
representations with respect to such data (or the results to be obtained by the use thereof), and all such parties hereby expressly disclaim all warranties of originality, accuracy, completeness, merchantability or fitness for
a particular purpose with respect to any of such data.
Regulatory Status This document is Issued in the UK by Polar Capital.

Polar Capital LLP is a limited liability partnership number OC314700. It is authorised and regulated by the UK Financial Conduct Authority (”FCA”) and is registered as an investment adviser with the US Securities &
Exchange Commission (“SEC”). A list of members is open to inspection at the registered office, 16 Palace Street, London SW1E 5JD.
Information Subject to Change The information contained herein is subject to change, without notice, at the discretion of Polar Capital and Polar Capital does not undertake to revise or update this information in any
way.
Performance Performance is shown net of fees and expenses and includes the reinvestment of dividends and capital gain distributions. Many factors affect fund performance including changes in market conditions and
interest rates and in response to other economic, political, or financial developments. Investment return and principal value of your investment will fluctuate, so that when your investment is sold, the amount you receive
could be less than what you originally invested. Past performance is not a guide to or indicative of future results. Future returns are not guaranteed and a loss of principal may occur. Investments are not insured by the
FDIC (or any other state or federal agency), are not guaranteed by any bank, and may lose value.
Morningstar ©2020 Morningstar, Inc. All Rights Reserved. The information contained herein: (1) is proprietary to Morningstar and/or its content providers; (2) may not be copied or distributed; and (3) is not warranted to
be accurate, complete or timely. Neither Morningstar nor its content providers are responsible for any damages or losses arising from any use of this information. Past performance is no guarantee of future results. The
Morningstar Rating™ for funds, or “star rating”, is calculated for managed products (including mutual funds, variable annuity and variable life subaccounts, exchange-traded funds, closed-end funds, and separate
accounts) with at least a three-year history. Exchange-traded funds and open-ended mutual funds are considered a single population for comparative purposes. It is calculated based on a Morningstar Risk-Adjusted
Return measure that accounts for variation in a managed product’s monthly excess performance, placing more emphasis on downward variations and rewarding consistent performance. The top 10% of products in each
product category receive 5 stars, the next 22.5% receive 4 stars, the next 35% receive 3 stars, the next 22.5% receive 2 stars, and the bottom 10% receive 1 star. The Overall Morningstar Rating for a managed product is
derived from a weighted average of the performance figures associated with its three-, five-, and 10-year (if applicable) Morningstar Rating metrics. The weights are: 100% three-year rating for 36-59 months of total
returns, 60% five-year rating/40% three-year rating for 60-119 months of total returns, and 50% 10-year rating/30% five-year rating/20% three-year rating for 120 or more months of total returns. While the 10-year overall
star rating formula seems to give the most weight to the 10-year period, the most recent three-year period actually has the greatest impact because it is included in all three rating periods. Ratings are for the share class
shown only; other classes may vary.

This presentation is for use with non-US professional investors only. Please refer to the Important Information at the end of this presentation.                                                                              43
You can also read