RETAIL CHOICE IN ELECTRICITY: WHAT HAVE WE LEARNED IN 20 YEARS?
←
→
Page content transcription
If your browser does not render page correctly, please read the page content below
RETAIL CHOICE IN ELECTRICITY:
WHAT HAVE WE LEARNED IN 20 YEARS?

                      Prepared by:
                   Mathew J. Morey
                   Laurence D. Kirsch
      Christensen Associates Energy Consulting LLC

                     Prepared for:

                   February 11, 2016

                             Christensen Associates Energy Consulting, LLC
                                       800 University Bay Drive, Suite 400
                                                 Madison, WI 53705-2299
                                     Voice 608.231.2266 Fax 608.231.2108
©Copyright 2016
 This report is protected by copyright. Any publication in any form without the express written
                  consent of Electric Markets Research Foundation is prohibited.

Electric Markets Research Foundation
Christensen Associates Energy Consulting conducted this study for the Electric Markets
Research Foundation (EMRF). EMRF was established in 2012 as a mechanism to fund credible
expert research on the experience in the United States with alternative electric utility market
structures – those broadly characterized as the traditional regulated model where utilities have
an obligation to serve all customers in a defined service area and in return receive the
opportunity to earn a fair return on investments, and the centralized market model where
generation is bid in to a central market to set prices and customers generally have a choice of
electric supplier.
During the first few years of restructured markets, numerous studies were done looking at how
these two types of electric markets were operating and the results were mixed. But since those
early studies, limited research has been done regarding how centralized markets and
traditionally regulated utilities have fared. The Electric Markets Research Foundation has been
formed to fund studies by academics and other experts on electric market issues of critical
importance.

Christensen Associates Energy Consulting
CA Energy Consulting is a wholly owned subsidiary of Laurits R. Christensen Associates, Inc.,
whose multi-disciplinary team of economists, engineers, and market research specialists has
been serving the electric power industry (as well as other industries) since 1976. CA Energy
Consulting’s focus on energy markets covers a broad range of technical and regulatory policy
issues concerning wholesale and retail electricity market restructuring, market design, power
supply, asset evaluation, transmission pricing, market power, retail and wholesale rate design,
and customer response to price signals.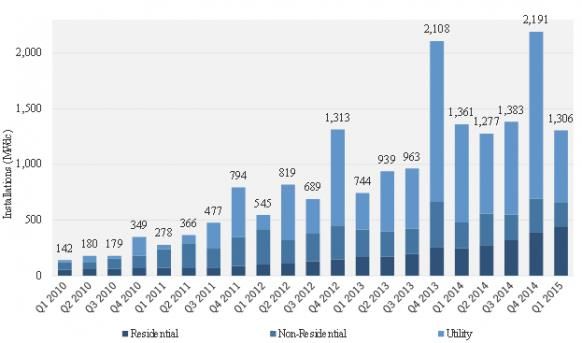
TABLE OF CONTENTS

EXECUTIVE SUMMARY ........................................................................................................... V
1. INTRODUCTION ............................................................................................................... 1
     1.1. Background ................................................................................................................... 1
     1.2. Purpose of This Report.................................................................................................. 2
     1.3. Organization of This Report .......................................................................................... 2
2. CURRENT STATUS OF RETAIL CHOICE ................................................................................ 3
    2.1. Status in the U.S. ........................................................................................................... 3
           2.1.1. Retail Choice .................................................................................................. 3
           2.1.2. Retail Competition Through Rooftop Photovoltaics ...................................... 7
    2.2. Status Elsewhere ........................................................................................................... 9
3. DRIVERS OF RETAIL CHOICE ............................................................................................ 13
    3.1. Reducing Retail Electricity Prices ................................................................................ 14
           3.1.1. Price Reductions Due to Efficiency Improvements...................................... 14
           3.1.2. Price Reductions Due to Capture of Economic Rents .................................. 15
    3.2. Wider Customer Choice in Service Conditions ........................................................... 16
    3.3. Promoting Alternative Resource Technologies .......................................................... 17
4. HISTORY OF RETAIL CHOICE IN THE U.S. ......................................................................... 17
5. CHALLENGES IN IMPLEMENTING RETAIL CHOICE ............................................................ 20
    5.1. Restructuring of Utility Organizations ........................................................................ 20
    5.2. Adaptation of Utility Power Operations ..................................................................... 21
    5.3. Adaptation of Utility Administrative Operations ........................................................ 21
    5.4. Institutional Challenges .............................................................................................. 22
6. RETAIL CHOICE OUTCOMES ............................................................................................ 24
    6.1. Impacts on Customer Service ..................................................................................... 24
           6.1.1. Retail Innovation .......................................................................................... 25
           6.1.2. Customer Satisfaction Surveys..................................................................... 30
           6.1.3. Fraudulent Advertising ................................................................................ 35
           6.1.4. Market Entry, Market Exit, and Bankruptcies ............................................. 36
    6.2. Impacts on Power System Costs ................................................................................. 36
    6.3. Impacts on Market Efficiency ..................................................................................... 37
    6.4. Impacts on Retail Prices .............................................................................................. 39
           6.4.1. Overview of Retail Price Histories in the U.S. .............................................. 39
           6.4.2. Prices in the EU’s Electricity Markets .......................................................... 45
           6.4.3. Review of Statistical Studies ........................................................................ 48
           6.4.4. Cost-Shifting Among Customers .................................................................. 50
    6.5. Impacts on Resource Adequacy .................................................................................. 51
           6.5.1. Investment Risk Impacts of Retail Choice .................................................... 51

Christensen Associates Energy Consulting, LLC                       i                                                           2/11/16
6.5.2. Other Impacts of Retail Choice .................................................................... 54
              6.5.3. Overview of Retail Choice Impacts .............................................................. 55
       6.6. Impacts on the Division of Financial Risks Among Stakeholders ................................ 55
              6.6.1. Division of Electricity Price Risk ................................................................... 55
              6.6.2. Division of Investment Risks ........................................................................ 56
       6.7. Impacts on Particular Demographic Groups ............................................................... 61
              6.7.1. Low-Income Customers ............................................................................... 61
              6.7.2. Residential Customers ................................................................................. 63
              6.7.3. Customers’ Geographic Locations ............................................................... 63
       6.8. Impacts on Regulation ................................................................................................ 64
7. SUMMARY AND CONCLUSIONS ...................................................................................... 64
    7.1. Expected Benefits and Costs of Retail Choice............................................................. 65
           7.1.1. Lower Retail Electricity Prices ...................................................................... 65
           7.1.2. Wider Range of Retail Customer Service Options ....................................... 66
    7.2. Actual Benefits and Costs of Retail Choice ................................................................. 66
           7.2.1. Lower Retail Electricity Prices ...................................................................... 66
           7.2.2. Wider Range of Retail Customer Service Options ....................................... 67
    7.3. Directions for Future Policy ........................................................................................ 68
8. REFERENCES .................................................................................................................. 69
APPENDIX A. ACRONYMS.................................................................................................... 76

Christensen Associates Energy Consulting, LLC                    ii                                                        2/11/16
LIST OF TABLES

Table 1 Years of Full Retail Market Opening................................................................................ 10
Table 2 Competition in Retail Electricity Service in the European Union, 2010 ........................... 12
Table 3 Timing of State Retail Choice Initiation and Suspension................................................. 19
Table 4 States Divesting Generation Assets ................................................................................. 23
Table 5 Numbers of Customers Participating in Dynamic Pricing Programs, by Customer
Segment, 2014 .............................................................................................................................. 26
Table 6 Demand Response Program Outcomes, 2014 ................................................................ 27
Table 7 Penetration of Smart Meters as a Percent of Total Meters............................................ 28
Table 8 Green Pricing Customers by State Type .......................................................................... 29
Table 9 Quality of Electricity Service and Consumer Satisfaction in the European Union, 2010 . 34
Table 10 Percentage Changes in Weighted Average Retail Prices, 1990-2014 ........................... 44
Table 11 Typical Bills per the LES Survey Results, 2015 ............................................................... 45
Table 12 Comparison of Net Revenue for Combustion Turbine Gas Plant ($ per MW-month) .. 53
Table 13 Estimated Returns on Equity for Selected Electric Industry Companies in PJM RTO ... 58

Christensen Associates Energy Consulting, LLC                         iii                                                           2/11/16
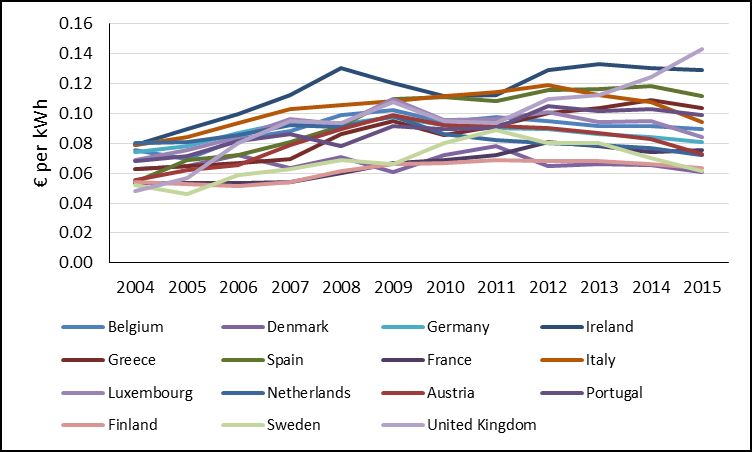
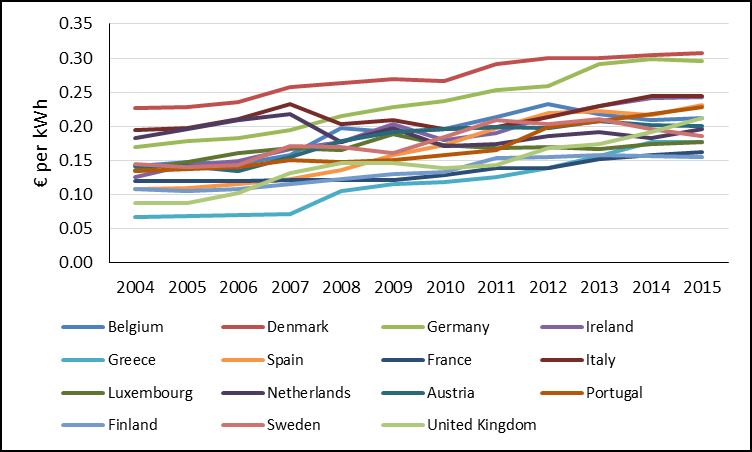
LIST OF FIGURES

Figure 1 Status of Retail Choice,...................................................................................................... 4
Figure 2 Competitive Retail Energy Suppliers' Retail Sales as Shares of Total MWh Sales, 2014 .. 5
Figure 3 Residential Customers Taking Competitive Electric Service as Shares of Eligible
Customers, 2014 ............................................................................................................................. 6
Figure 4 Percent of Eligible Commercial & Industrial Loads Taking Competitive Electric Service
from Non-Incumbent Providers, 2014 ............................................................................................ 7
Figure 5 U.S. Photovoltaic Installations, Q1 2010-Q1 2015............................................................ 8
Figure 6 Average Retail Prices by State, 1998 (cents per kWh) .................................................... 18
Figure 7 Shares of Electric Industry Mergers and Sales in Retail Choice States, 2007-2014....... 21
Figure 8 Smart Meter Installation in the United States, 2007 to 2014 ....................................... 28
Figure 9 Estimated Annual Green Sales by State Type (Millions of MWh), 2006-2013 ............... 30
Figure 10 Average ACSI Scores for Traditional and Retail Choice States IOUs, 2000 - 2014 ....... 32
Figure 11 Real Annual Henry Hub Natural Gas Spot Prices, 1991-2014 (2015 dollars)............... 40
Figure 12 Weighted Average Real Prices for Residential Customers, 1990 to 2014 (2015 dollars)
....................................................................................................................................................... 41
Figure 13 Weighted Average Real Prices for Commercial Customers, 1990 to 2014 (2015
dollars) .......................................................................................................................................... 42
Figure 14 Weighted Average Real Prices for Industrial Customers, 1990 to 2014 (2015 dollars)
....................................................................................................................................................... 42
Figure 15 Amounts by Which Average Revenues in Retail Choice States Exceeded Those in
Traditionally Regulated States, 1990 to 2014 ............................................................................... 43
Figure 16 Average Real Electricity Prices for Residential and Industrial Electricity Customers in
27 EU Countries, 2005-2015 (2015 € per kWh) ............................................................................ 46
Figure 17 EU-15 Nominal Residential Electricity Prices 2004-2015............................................. 47
Figure 18 EU-15 Industrial Electricity Prices 2004 - 2015 ............................................................ 48
Figure 19 Relationship of Michigan Retail Choice Participation to Wholesale Power Prices...... 51
Figure 20 Exelon Earnings, 2008 to 2013 ..................................................................................... 59
Figure 21 Relation of Exelon Generation Revenues and Natural Gas Spot Price ........................ 60

Christensen Associates Energy Consulting, LLC                              iv                                                                  2/11/16
RETAIL CHOICE IN ELECTRICITY:
                        WHAT HAVE WE LEARNED IN 20 YEARS?

                                           EXECUTIVE SUMMARY

Electric power industry restructuring in the United States in the 1990s was motivated by the
expectation that substantial benefits were available through increased competition at the
wholesale level – that is, in power sales among generators and utilities for resale to ultimate
retail consumers. These expected benefits were of two types. First, competition in generation
services would induce technological and management improvements in power production that
would reduce generation costs and improve generators’ performance. Second, the breaking
down of barriers to trade among utilities and other wholesale market participants would foster
competitive power trading that would substitute relatively cheap for relatively expensive
generation.
In contrast to the very real expected benefits of wholesale restructuring, the potential gains
from retail choice were speculative at best. By the time that restructuring occurred in the late
1990s, there was already a substantial body of evidence, from innovative retail electricity
programs dating back to the 1970s, that customers’ short-term response to electricity prices
was small and that customers’ willingness to be curtailed, even when they had promised to be
available for curtailment, was even smaller. Nonetheless, through a confluence of hopes from
disparate interest groups, particularly from industrial customers seeking lower electricity prices
and terms of service better tailored to their needs, retail choice was adopted alongside
wholesale restructuring in nearly half the states. Nearly two decades later, there is little
evidence that retail choice has yielded any significant benefits.

Current Status of Retail Choice
“Retail choice” refers to customers’ ability to choose the entity that provides them with
electrical energy through the traditional power network. Australia, Korea, New Zealand,
Turkey, and eight of the twenty-seven member states of the European Union (EU) appear to
have real retail choice options. Fourteen U.S. states and the District of Columbia presently have
retail choice, and eight states have suspended or rescinded retail choice. Because many states
allow limited retail choice, however, the dividing line among states is somewhat ambiguous.
In U.S. jurisdictions with retail choice, roughly half of commercial and industrial load has
switched to competitive suppliers, while under a tenth of residential load has done so. Because
the gross benefits of switching suppliers are roughly proportional to a customer’s size, larger
customers are better able to overcome the transaction costs of switching than are smaller
customers.

Christensen Associates Energy Consulting, LLC      v                                       2/11/16
Retail Choice Outcomes
Retail choice appears to have the following impacts on innovative service offerings:
Retail choice is extending the market penetration of dynamic pricing programs that
reflect power system conditions. All other things equal, this improves the efficiency of
use of power system resources, lowers the average costs of producing power, and tends
to improve resource adequacy.
Retail choice promotes renewable resources. To the extent that this raises the market
penetration of intermittent resources such as wind and solar, it may raise resource
adequacy issues because of the non-dispatchability of such resources.
Retail choice has a mixed record in promoting demand response.
Retail choice has not generally promoted smart metering.
The evidence indicates that retail choice has the following impacts on consumer prices:
Retail choice states, from the beginning of retail choice up to the present, have had
retail prices persistently higher than those in other states, with the price gap varying
over time with changes in fuel prices and other factors. The overall trend has been
toward a lower price gap, though that is at least partly due to the happenstance of
natural gas prices being low at the present time.
Retail electricity prices in retail choice states vary more immediately with current fuel
prices and other market factors than do retail prices in other states, and are therefore
less stable than retail prices in other states.
Retail electricity prices in retail choice states vary by location in a manner that mimics
locational variations in wholesale electricity market prices.
Neither price regulation nor the opening of retail markets seems to have had significant
impact on average residential prices in the EU. The EU experience gives no clear signal
about how retail choice affects retail electricity prices.
The numerous statistical studies of the relationship of electricity prices to restructuring
have reached contradictory conclusions about the price impacts of retail choice.
Implementation of retail choice has created some costs:
Retail choice exacerbates the resource adequacy problem by materially adding to the
financial uncertainties faced by investors in generating resources because it adds to
uncertainties in the revenues that a generator will receive for its services. With retail
choice, investors have sales contracts with durations that are only small fractions of the
lives of their investments, which means that their revenues depend upon uncertain
future market conditions. This uncertainty makes investment in new generation less
attractive and makes long-term fuel contracting less attractive for existing generators,
which may impinge upon resource adequacy and certainly raises the required returns on
investment capital. This increase in required returns must ultimately be paid by
consumers in the form of higher prices.
Christensen Associates Energy Consulting, LLC vi 2/11/16 The risk of retail supplier bankruptcies under retail choice is greater than under
traditional regulation, which may increase the costs borne by consumers.
Retail choice requires that billing procedures be adapted so that appropriate shares of
customer payments go to the utility (for non-competitive services) and to third-party
retail suppliers (for competitive services).
Retail choice requires metering that is compatible with new retail service offerings.
Under retail choice, retail suppliers incur marketing costs that must be recovered from
customers.
To facilitate the competition in generation services that is necessary for retail choice,
there must be functional unbundling of utilities’ generation function from its
distribution and transmission functions. In most retail choice states, government
encouraged or required utilities to divest generation assets or move them to separate
affiliates, which, due to bad timing, ultimately cost customers tens of billions of dollars.
There is also evidence of the following additional impacts of retail choice:
Some retail energy suppliers cherry pick customers. Some of the most attractive
customers, namely industrial and large commercial customers, take advantage of lower
prices in either the retail choice market or the regulated market, which may result in
other customers bearing disproportionate shares of utilities’ generation costs.
There does not seem to be a clear relationship between retail choice and customer
satisfaction. Results for U.S. residential customers are mixed. The EU experience
suggests that retail choice, when well implemented, improves customer satisfaction.
Retail choice decisions require business savvy that many consumers lack. Less educated
or low-income consumers are more likely than other consumers to make poor retail
supplier choices.
Directions for Future Policy
Policymakers should measure the success of retail choice according to the extent to which it
reduces customers’ bills relative to what they would have been for service from the incumbent
utility, and according to the extent to which it creates service options of real value to
consumers. Success should not be measured according to switching rates; and encouraging
greater switching should not be a goal of public policy. In particular, smaller electricity
consumers recognize that the transaction costs of switching are high relative to the prospective
benefits of lower bills and better customer service, and can therefore rationally remain with
their incumbent utilities.
Regulators in all states should encourage utilities to unbundle the pricing of generation services
from that of other services, particularly distribution services, and charge consumers for non-
competitive services when they choose an alternative generation supplier. Consumers should
be able to clearly compare the prices of the generation services offered by competing suppliers,
without the distraction of the prices of non-competitive services. Utilities should be able to
Christensen Associates Energy Consulting, LLC vii 2/11/16recover the costs of non-competitive services regardless of the customer’s choice of competing energy supplies whether obtained through the power system or outside of the power system. Subsequent to unbundling of generation services from other services, regulators in retail choice states should encourage utilities to offer real-time pricing to all customers willing to pay the costs of the associated metering and billing. All customers can then have access to the wholesale market if they are willing to pay for such access. To limit cherry-picking in retail choice states, customers who choose an alternative retail energy supplier should be ineligible to return to a conventional utility tariff. Instead, customers who want to return to the incumbent utility should be required to accept its real-time pricing rate or some other market-based rate. Regulation in retail choice states needs to vigilantly protect consumers against retail energy suppliers’ default and fraud. Christensen Associates Energy Consulting, LLC viii 2/11/16
RETAIL CHOICE IN ELECTRICITY:
                         WHAT HAVE WE LEARNED IN 20 YEARS?

1. INTRODUCTION

1.1. Background
Traditionally, electric power was provided to U.S. consumers by vertically integrated utilities
that owned generation, had exclusive retail franchises, and traded wholesale power through
bilateral contracts. Beginning in the late 1990s, a new “restructured” market model was
introduced under which regional transmission organizations (RTOs) or independent system
operators (ISOs) operate centralized competitive wholesale markets in certain regions of the
U.S. While about a third of the U.S. population continues to obtain electric power service based
on traditional institutional arrangements, about two-thirds of the population now obtains
electricity through restructured wholesale markets.
Although retail customers must obtain their power through transmission and distribution
facilities that are owned and operated by regulated monopolies, it is technically feasible for
them to obtain generation services (like electrical energy) and customer services (like special
billing plans) through suppliers other than their traditional utilities. The prices and terms of
transmission and distribution services thus continue to be determined through regulatory
processes; but in states wherein retail choice is available, the prices and terms of generation
and customer services can be set through market processes.
Retail choice – by which customers are allowed to choose their suppliers of generation and
customer services – is available primarily in states located within regions served by the
centralized wholesale markets, but they are also allowed such choice in a few states operating
under traditional wholesale market structures.1 In most states offering retail choice,
competition at the retail level may therefore be regarded as an extension of the new
competition at the wholesale level. Electricity markets with and without retail choice are thus
distinguished, in part, by the nature of the corresponding competition at the wholesale level:
retail choice states usually participate in restructured wholesale markets; while states without
retail choice fall into both traditional and restructured wholesale markets.2

1
  For example, under the traditional market structure in Georgia, new commercial and industrial customers with
loads of 900 kW or higher are eligible for one-time electricity supplier choice. In Oregon, commercial and industrial
customers that use at least 30 kW per month are eligible for electricity supplier choice.
2
  Borenstein and Bushnell [2015b, p. 4] note that “competitive generation is central to the retailer being able to
offer better procurement options, different generation sources, or alternative billing mechanisms, which the
retailer would likely want to balance with the wholesale contracts it has with producers.”

Christensen Associates Energy Consulting, LLC            1                                                  2/11/16
1.2. Purpose of This Report This report examines “retail choice,” which we define as competition in the supply of the generation and customer components of retail electricity service received through power systems. It looks at the reasons why retail choice has been adopted in many jurisdictions, how it has evolved over the past few decades, the challenges in its implementation, and how it has affected power supply reliability and costs. This examination relies, in part, upon a comparison of U.S. electricity markets that have retail choice with U.S. electricity markets that do not have such competition, recognizing that such a comparison is complicated by the many factors that distinguish electricity markets with and without retail choice. These factors include weather, access to and costs of fuel, labor market and other input market conditions, and the characteristics of state laws and regulations. Moreover, each of these factors encompasses a range of conditions. For example, most states have laws or regulations that subsidize distributed resources directly through tax credits or indirectly through net metering rules that pay retail electricity prices for customers’ self-generated electrical energy; but the states vary substantially in both the levels of the tax credits and the conditions that define net metering rules. It is thus a complex matter to determine the extent to which the reliability and cost differences among states are due to retail choice rather than to other factors. This report also takes a limited look at retail competition in general. “Retail competition” not only includes retail choice, but also includes electricity or electricity substitutes available to consumers through sources other than the power system. These alternatives include self- generation such as solar panels, energy efficiency measures such as more efficient motors and better insulation, and other energy sources such as natural gas for heating. Some forms of retail competition are occurring in almost all states regardless of the status of retail choice. Such competition has been stimulated by a variety of factors including falling natural gas prices, renewable portfolio standards, net metering policies, and tax and other incentives to electricity customers to adopt renewable energy technologies like rooftop solar. 1.3. Organization of This Report The first sections of this report are descriptive. Section 2 summarizes the current status of retail choice, with an emphasis on the U.S. and an overview of some other nations’ policies and retail market structures. Section 3 describes the major technological and institutional factors that have driven the movement toward retail choice. Section 4 briefly reviews the history of how those technological and institutional factors have in fact induced states to adopt or choose not to adopt a retail choice policy. Section 5 identifies the technical and institutional factors that must be addressed by those jurisdictions that adopt retail choice. Section 6 looks at what reliability agency reports, government agency reports and data, industry organization reports, and industry and academic literature tell us about the impacts of retail choice on customer service, power system costs, electricity market efficiency, retail electricity prices, power system resource adequacy, the division of financial risks among stakeholders, particular demographic groups, and electricity sector regulation. Section 7 interprets the analyses and data of Section 6, drawing inferences about how the actual net Christensen Associates Energy Consulting, LLC 2 2/11/16
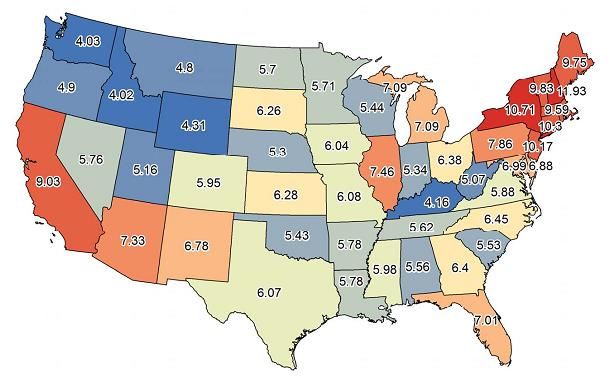
benefits of retail choice compare to the promised benefits, and offers suggestions for future
public policy.

2. CURRENT STATUS OF RETAIL CHOICE
This section provides a brief overview of the status of retail choice in the U.S. and elsewhere.

2.1. Status in the U.S.
Retail competition comes in two forms. First, customers can choose the entity that provides
them with electrical energy through the traditional power network, which we call “retail
choice.” Second, customers can procure part or all of their electrical energy through energy
alternatives available to consumers through sources other than the power system. In this
section, after looking at the status of retail choice, we look at one prominent energy
alternative, namely self-generated solar power through rooftop photovoltaics.

2.1.1. Retail Choice
Nearly half the states have allowed competitive suppliers to supply electrical energy and other
services to retail electricity consumers through the power network, though several of them
have suspended or rescinded this form of retail competition. Figure 1 shows the present state-
by-state status of retail choice. The fifteen green jurisdictions have retail choice, the eight red
states have suspended or rescinded retail choice, and the white states never pursued retail
choice. Four of the states that suspended or rescinded retail choice (California, Nevada,
Oregon, and Virginia) still allow large industrial customers and some commercial customers to
choose their suppliers.

Christensen Associates Energy Consulting, LLC    3                                          2/11/16
Figure 1
                                          Status of Retail Choice3,4

       Green – Retail Choice State, Red – Suspended State, White – Traditional State

Figure 2 shows the extent to which retail customers have switched to competitive suppliers in
sixteen states and the District of Columbia as of 2014. Shares are relative to total MWh sales
for each class in each state. Of the seventeen jurisdictions shown in the figure, retail energy
suppliers sold a majority of industrial load in eleven states and a majority of commercial load in
eight states. As simple unweighted averages, 58% of industrial load, 44% of commercial load,
and 7% of residential load in the seventeen jurisdictions have switched to competitive
suppliers. The District had the highest switching rates for industrial customers (100%) and
commercial customers (85%). While Texas had the highest switching rate (about 60%) for
residential customers because the state requires retail choice program participation by all
customers served by investor-owned utilities in the footprint of the Electric Reliability Council
of Texas, Connecticut has the highest switching rate for residential customers (29%) among the

3
 Figure 1 is based on a composite of information from Belmont Electricity Supply Study Committee [2004, p. 19],
http://www.eia.gov/electricity/policies/restructuring/restructure_elect.html, and U.S. Energy Information
Administration [2003, p. 3].
4
  The division among states is not entirely unambiguous. Georgia, which is denoted as lacking retail choice,
nonetheless allows retail choice for customers with more than 900 kW of load. Michigan, which is denoted as
having retail choice, caps allowable sales by non-utility suppliers at 10% of each utility’s previous year’s sales.
Arizona, Oregon, and Virginia, which are denoted as having suspended retail choice, nonetheless permit retail
choice for certain large electricity customers; and Virginia allows retail choice for residential customers seeking
100% renewable energy if the local utility does not provide that option.

Christensen Associates Energy Consulting, LLC           4                                                 2/11/16
states that lack such a mandate. Overall, 16% of the total electrical energy sold in the U.S. in
2014 was sold by competitive retail energy suppliers.
Figure 2
Competitive Retail Energy Suppliers' Retail Sales as Shares of Total MWh Sales, 20145
Figure 3 shows the extent to which residential customers have switched to competitive
suppliers, though in this figure switching shares are measured according to numbers of eligible
customers rather than according to MWh sales. For the fourteen jurisdictions shown in the
figure, 44% of 37.8 million eligible customers took service from competitive suppliers in 2014.
Only Illinois, Ohio, and Texas had majorities of residential customers taking service from
competitive suppliers. Excluding Texas, which skews the results because all its eligible
customers are required to shop, a more modest but still impressive 33% of eligible customers
switched.
For all fourteen jurisdictions shown in the figure, the aggregate number of customers taking
competitive supply fell 1.2% between 2013 and 2014, with half the states showing gains in
numbers of switching customers and half showing losses. Of the fourteen jurisdictions, eleven
rely primarily upon direct transactions between consumers and suppliers, while three rely
primarily upon municipal aggregators.
5
Sales shares are based on the most recently available state migration statistics obtained from state public utility
commission websites for calendar years close to 2014. Data for Montana are based on U.S. Energy Information
Administration [2012].
Christensen Associates Energy Consulting, LLC 5 2/11/16Figure 3
Residential Customers Taking Competitive Electric Service as Shares of Eligible Customers,
20146
Figure 4 shows the extent to which commercial and industrial customers have switched to
competitive suppliers, where the percentages, somewhat strangely, are “Percent of total
jurisdictional sales, including the residential sector.”7 In this figure, switching includes only
those loads that customers have chosen to take from entities other than the incumbent utility.
The simple average switching rate is 52%, with Illinois, Ohio, and Texas again taking the lead.
California and Michigan place limits on the extent of switching, which partly explains their
relatively low percentages.
Customer size is the main reason that residential customers have adopted retail choice at much
lower rates than commercial and industrial customers. The gross benefits of switching
suppliers are roughly proportional to a customer’s size. For a business, these benefits can be
large enough to warrant spending staff time investigating electricity supplier options, and even
large enough to justify having some staff dedicated to managing energy consumption decisions.
For a residential consumer, by contrast, the gross benefits warrant only minimal consideration
of options. Furthermore, businesses have abilities to manage information and financial risks in
ways that are generally unavailable to residential consumers; so risk aversion will quite
rationally induce residential consumers to stick with their low-risk incumbent supplier to a
greater extent than it will so affect businesses.
6
Distributed Energy Financial Group [2015, Table ES-1].
7
Distributed Energy Financial Group [2015, Table ES-3].
Christensen Associates Energy Consulting, LLC 6 2/11/16Figure 4
Percent of Eligible Commercial & Industrial Loads Taking Competitive Electric Service from
Non-Incumbent Providers, 20148
To some extent, competition has been discouraged by the ways in which some states have
required utilities to offer provider-of-last resort (POLR) service. This requirement has been
intended to protect consumers by assuring that they can obtain electricity from incumbent
utilities at reasonable prices. In addition to protecting consumers, however, state-mandated
ceilings on POLR service prices also interfere with the establishment of retail prices that
accurately reflect power system costs and reduce the profitability of offering competing retail
electricity services.9
2.1.2. Retail Competition Through Rooftop Photovoltaics
Residential rooftop solar has successfully competed for a growing share of residential electricity
consumption in recent years. Figure 5 shows that photovoltaic installations in general have
skyrocketed in the U.S. over the past few years, in terms of both numbers and MW. Utility
installations have been the majority of these installations, but residential and non-residential
installations have increased rapidly as well.
8
Distributed Energy Financial Group [2015, Table ES-3].
9
Electric Energy Market Competition Task Force [2006, p. 6].
Christensen Associates Energy Consulting, LLC 7 2/11/16Figure 5
U.S. Photovoltaic Installations, Q1 2010-Q1 201510
The growth in residential installations has been fueled by third-party financing of rooftop solar,
which has accounted for 72% of such installations in some jurisdictions in 2014.11 There are
two types of such financing.12 Under both types of financing, the developer builds the solar
facility on the customer’s property, covers specified costs (e.g., design, permitting, installation,
and maintenance), and owns the facility for a period of up to twenty years. The customer’s
payments to the developer, however, depend upon the type of financing.
Under a power purchase agreement, there is no up-front cost to the customer, and the
customer pays specified prices for energy consumed from the solar facility.
Under a traditional lease agreement, there may or may not be an up-front cost to the
customer, and the customer pays a monthly fee that is independent of energy
consumed.
Under either type of financing, there will be some agreement regarding the customer taking
over ownership after some period of time, perhaps for a buyout payment. The developer not
10
Munsell [2015b].
11
Munsell [2015a]. This source indicates that, in 2014, the leading companies in the U.S. residential solar
installation market were SolarCity (34%), Vivint Solar (12%), and Sunrun (10%).
12
Solar Energy Industries Association and U.S. Energy Information Administration [2013].
Christensen Associates Energy Consulting, LLC 8 2/11/16only receives revenue from the customers, but also receives substantial tax benefits as owner
of the installation.
At least twenty-six states and the District of Columbia allow power purchase agreements, while
seven states prohibit it.13 Similar numbers allow and prohibit traditional lease agreements.14
The economics of residential solar installations primarily depend upon three factors. First and
foremost, they depend upon tax incentives. The federal investment tax credit is critical, as it
accounts for 40% to 50% of developers’ net profit on residential solar installations. State
incentives are also critical: of the ten jurisdictions with the highest rates of return on
residential solar, only one (California) remains in the top ten without its state incentives.
Second, the economics of residential solar depend upon retail electricity prices. When tax
incentives are removed, the jurisdictions with the ten highest rates of return have residential
electricity rates that average 42% higher than those of the second ten jurisdictions, even
though their solar output is virtually identical. Third, residential solar economics depends upon
the availability and characteristics of state net metering programs. Net metering policies,
which are presently in place in forty-one states plus the District of Columbia,15 have customers
pay utilities for the electricity they consume net of the electricity that they produce. Net
metering in effect pays customers not only for the electrical energy that they provide but also
delivery and customer services that they do not provide, but instead use. The consequence is
that the delivery and customer service costs of residential customers with solar power are
heavily subsidized by customers without solar power. Somewhat ironically, solar irradiance –
that is, how much the sun shines in a particular place – is a lesser factor in determining the
profitability of investment in residential photovoltaic installations, even though it is a critical
factor in determining how much electricity is actually produced.16 The consequences of these
tax and regulatory subsidies are inefficiently high investment in costly solar facilities and
distortion of retail electricity prices.
2.2. Status Elsewhere
Liberalization of electricity markets began with Australia, Chile, and the United Kingdom in the
1980s, and reached the European Union (EU) in the 1990s.17 As shown in Table 1, New Zealand
was the first country to achieve full opening of its retail markets in which consumers have the
right to choose their retailer suppliers. Nonetheless, the table shows that full retail market
openings have occurred primarily in EU countries, with a smattering of other developed
13
Database of State Incentives for Renewables & Efficiency [2016a].
14
https://solarpowerrocks.com/solar-lease-map/.
15
Database of State Incentives for Renewables & Efficiency [2016b].
16
UBS [2015].
17
In the EU, market liberalization has been implemented through three directives, the first of which, adopted in
1996, mandated open access to transmission and distribution networks, allowed customers to change suppliers,
and promoted independent regulatory agencies. See European Commission [2012].
Christensen Associates Energy Consulting, LLC 9 2/11/16countries participating. In the U.S., only Maine (in 2000) and Texas (in 2002) have achieved
comparable market liberalizations.
Table 1
Years of Full Retail Market Opening18
Country Year Country Year
Australia 2002 Italy 2002
Austria 2001 Korea 2001
Belgium 2007 Netherlands 2001
Czech Republic 2006 New Zealand 1994
Denmark 2003 Norway 1997
Finland 1998 Poland 2007
France 2007 Portugal 2006
Germany 1998 Spain 2003
Greece 2007 Sweden 1996
Hungary 2000 Turkey 2003
Ireland 2000 United Kingdom 1999
Retail electricity market liberalization is different in different places. In several countries listed
in Table 1, the transition to liberalized electricity sectors was preceded by state ownership of
power systems and then followed by their privatization, with significant implications for the
differing ways in which retail choice has been implemented. Furthermore, the extent and
terms of retail choice often vary among the jurisdictions within a country.19
Table 2 summarizes the extent of competition in each of the member states of the EU in terms
of the numbers of “main suppliers” with market shares of at least 5%, the market shares of
those suppliers, and the market share of the largest supplier in 2010. The table divides EU
member states into categories that reflect inferred values for the Herfindahl-Hirschman Index
(HHI) of market concentration.20 Only four member states have unconcentrated markets, and
another four have moderately concentrated markets. These eight countries arguably have real
retail choice options. Another seven member states have highly concentrated markets, which
means that retail choice is limited at best. The last twelve countries basically have monopolies,
meaning that retail choice is not offered or is offered in name only.
According to one source:
18
Cook [2011, pp. 22-23].
19
See, for example, London Economics [2012, p. 33].
20
The table follows the U.S. Department of Justice and Federal Trade Commission Horizontal Merger Guidelines §
5.2 (2010) in using an HHI value of 1,000 to separate “unconcentrated” from “moderately concentrated” markets;
but it uses the relatively high HHI value of 2,500 to separate “moderately concentrated” from “highly
concentrated” markets.
Christensen Associates Energy Consulting, LLC 10 2/11/16…the moderately concentrated electricity retail markets of Denmark, Finland,
Germany, Great Britain, Italy, the Netherlands and Norway perform relatively
well, judged on the basis of key competition performance indicators (e.g. choice
of suppliers and offers; switching rates; entry-exit activity; consumers’
experiences; mark-up etc.)… Retail competition performance indicators show no
or weak signs of competition in MSs [member states] with highly concentrated
markets at the national level: in electricity in Bulgaria, Cyprus, Hungary, Latvia,
Lithuania, Malta and Romania… According to a data sample based on offers in
the capital cities, the electricity and gas markets of Germany, Great Britain,
Denmark and the Netherlands are the relative best performers in relation to the
number of offers and suppliers providing diversified products for electricity and
gas consumers, such as the type of energy pricing, green offers, additional free
services and/or dual fuel offers.21
The numbers of retailers in each country – and consequently, market concentration – vary over
time. For example, large drops in numbers of retailers have been experienced in Denmark
(from 113 retailers to 49) and Spain (from 375 to 162), both drops occurring mainly when retail
markets were opened to residential customers.22 Apparently, industry consolidation was
induced by the relatively high costs of reaching large numbers of small customers. On the other
hand, increases in numbers of retailers have occurred in other countries, like Germany, Italy,
and the United Kingdom. More generally, in many countries (including some of those just
named), numbers of retailers have risen and fallen over time.
Although the large numbers of retailers in some EU states suggests that retail markets are
fragmented, Table 2 shows that all EU markets are, in fact, dominated by no more than eight
main suppliers. Apparently, there is a large fringe of small suppliers in many EU states; and
although the numbers of these small suppliers vary considerably over time, the numbers of
main suppliers are fairly stable.
Customer switching behavior in the EU seems to be related to the degree of competition. In
the United Kingdom, the retail energy market (both electric and gas) has an impressively high
annual switching rate of 18%, with almost all consumers being aware of the right to change
energy suppliers.23 On the other hand, countries with weak competition have little product and
price differentiation and therefore little inducement for consumers to seek new suppliers. The
continuation of retail price regulation further discourages competition and switching.24
21
Agency for the Cooperation of Energy Regulators and Council of European Energy Regulators [2014, p. 9].
ACER/CEER’s characterization of Italy as “moderately concentrated” is belied by its largest supplier having 85% of
the market.
22
Rathke [2015].
23
Karan and Kazdagli [2011, p. 16].
24
Agency for the Cooperation of Energy Regulators and Council of European Energy Regulators [2014, pp. 6-7].
Christensen Associates Energy Consulting, LLC 11 2/11/16Table 2
Competition in Retail Electricity Service in the European Union, 201025
Mkt Share Mkt Share
# of Main
Member State of Main of Largest
Suppliers
Suppliers Supplier
Unconcentrated Markets:
Austria 8 69% 17%
Finland 4 45% 17%
Germany 3 25% 14%
Sweden 3 45% 19%
Moderately Concentrated:
Denmark 3 59% 46%
Netherlands 4 79% 32%
Slovenia 5 99% 36%
United Kingdom 6 85% 24%
Highly Concentrated:
Belgium 4 89% 61%
Czech Republic 3 87% 52%
Hungary 4 99% 45%
Ireland 3 98% 60%
Luxembourg 2 85% 68%
Slovakia 4 98% 35%
Spain 3 92% 41%
National or Regional Monopolies (RM):
Bulgaria 3 100% RM
Cypress 1 100% 100%
Estonia 1 94% 94%
France 1 92% 92%
Greece 1 100% 100%
Italy 1 85% 85%
Latvia 1 99% 99%
Lithuania 2 94% RM
Malta 1 100% 100%
Poland 6 88% RM
Portugal 1 93% 93%
Romania 4 100% RM
25
ECME Consortium [2010].
Christensen Associates Energy Consulting, LLC 12 2/11/16Although the EU mandated retail choice as a means of breaking up monopolies and improving
the efficiency of the electricity sector, the various member states have chosen different
methods for implementing retail choice, yielding a diversity of outcomes. The result is that only
eight of the EU’s twenty-seven member states have real retail choice options. It is notable that
these eight countries tend to be wealthier EU members, and that the twelve countries that
have maintained monopolies tend to be poorer EU members. Breaking up old monopolies thus
appears to be a luxury that is easier for the wealthy to afford.
3. DRIVERS OF RETAIL CHOICE
At the height of the restructuring movement in the 1990s in the U.S., industrial electricity
consumers led the charge for retail choice, primarily in the hope that it would provide them
with opportunities to get lower electricity prices, secondarily in the hope that they could
negotiate terms of service that would better be tailored to their needs. In this effort, industrial
customers were supported by entities, most notoriously Enron but also including many utilities,
that hoped to profit by selling into or trading in newly deregulated wholesale and retail
electricity markets.
For example, John Anderson, executive director of the Electricity Consumers Resource Council,
an industrial electric consumers’ lobbying group, expected lower prices for his members:
We think competition in any industry brings about not only lower prices but also
increased innovation and technological stimulation.26
Steve Burton, President of the Electric Power Supply Association and of Sithe Energies, an
independent power producer (IPP), foresaw lower prices and more services:
Consumers will have choice as well as lower prices… They will be able to choose
the type of service they want, how they want it delivered, and there will be a
wider range of services.27
Another group of IPPs also foresaw low prices and innovation:
Consumers will benefit. According to the US Energy Information Administration,
the average price of electricity is projected to decline by one percent a year
between 1996 and 2020 as the result of competition among electricity suppliers.
As retail competition becomes more widespread and more customers
throughout the country are allowed to choose their power suppliers, these
suppliers can be expected to work harder and smarter to keep prices down,
attract and retain customers, and provide better service. More than 70 percent
of consumers surveyed by the Americans for Affordable Electricity, a coalition
that supports giving customers the power to choose their electricity supplier,
said they would prefer to have a choice when buying electricity.28
26
Jost [1997].
27
Jost [1997].
28
Competitive Power Supply Industry [2000, p. 10].
Christensen Associates Energy Consulting, LLC 13 2/11/16The Chairman of the nation’s largest power trading firm was able to put a number on the
benefits that consumers would enjoy:
Enron's chairman, Kenneth L. Lay, says that consumers could save $60 billion-$80
billion per year if the electric power market were completely opened to
competition.29
The extent to which these hopes were realized is the topic of Section 6 of this report. The
present section focuses on the benefits of retail choice that were expected by the advocates of
retail choice as restructuring was initiated. We divide these benefits into three categories:
reducing retail electricity prices; offering customers a wider range of choices in service
conditions; and promoting alternative resource technologies.
3.1. Reducing Retail Electricity Prices
The movement toward retail choice was partly driven by the hope that competition would
result in retail electricity prices that are lower than they would otherwise be. Indeed, as later
described in Section 4, the states with retail choice are generally those that had relatively high
retail prices in the late 1990s, when restructuring activity was at its peak. The hope for lower
prices was partly based upon the expectation that competition would drive improvements in
the efficiency of electricity production and delivery, but was also driven by consumer groups
hoping to capture economic rents from utility shareholders.
3.1.1. Price Reductions Due to Efficiency Improvements
In theory, retail choice can potentially lead to efficiency improvements in the provision of
generation services and in retail electricity prices themselves.
With respect to improving generation services, competition in the provision of retail services
may enhance the competitive positions of non-utility generators by expanding the market
opportunities for these generators’ services.30 Such opportunities might increase the market
shares of those generation firms that are most efficient, ultimately resulting in lower costs of
providing electricity to final customers. These potential benefits of retail choice are different
and much smaller than the benefits of wholesale competition, which has led to significant
improvements in the commitment and dispatch of generation and transmission resources in
regions with balkanized resource ownership. Nonetheless, retail choice may provide benefits
that complement those of wholesale competition.
29
Jost [1997].
30
Borenstein and Bushnell [2015b, p. 4+ note that “a merchant generator would be in a very weak position if there
were only one retail electricity provider to which it could sell its output. A monopoly retail provider (a distribution
utility) could still engage in competitive procurement, but that creates a narrower spectrum for competitive
generation and it means that the monopoly retailer is the single determinant of the range of products that might
be procured for retail. For instance, the monopoly retailer might not pursue low-carbon sources even if there are
many retail customers who would be willing to pay a premium for greener energy. Thus, retail competition
potentially makes competitive generation more viable.”
Christensen Associates Energy Consulting, LLC 14 2/11/16With respect to improvements in electricity prices, retail choice may drive retail prices toward the market’s marginal costs. Utilities’ retail electricity prices have traditionally been determined according to the average costs of the generation, transmission, distribution, and customer services that are required to produce electricity and deliver it to customers. These average cost-based cost-of-service rates partly depend upon the quality of utility management and partly upon the legacy of past cost commitments, such as decisions to build particular types of power plants or to commit to particular long-term fuel supplies. In a market setting, by contrast, the retail prices of electricity services subject to competition, particularly generation services like electrical energy, may move closer to the market’s marginal costs of these services. These marginal costs are the costs of obtaining new supplies of these services, given current technologies and input prices, and are not dependent upon legacy costs. Retail prices based upon marginal costs could encourage customers to consume more power when power supplies are relatively abundant and to consume less power when power supplies are relatively scarce. This better match between retail prices and wholesale market conditions may improve resource adequacy through peak load reduction and may reduce the average costs of providing power to consumers, which could ultimately result in lower retail prices. Utilities have long recognized the benefits of retail prices that reflect marginal costs. Consequently, they have offered time-of-use rates since the 1970s, real-time pricing rates since the 1980s, and other dynamic pricing programs in more recent years. Retail choice may potentially further this movement toward more efficient retail pricing. Regardless of whether retail choice makes prices more efficient, it is likely to change the relative prices paid by different customer groups. As just noted, retail choice may move prices away from a cost-of-service basis toward short-run marginal costs. But it may also change the relative bargaining power of different customer groups. Under regulation, utilities’ retail electricity prices have traditionally reflected not only their average costs of service but also the relative political power of different groups of electricity consumers. Under retail choice, prices will be influenced by the relative economic power of different customer groups, with relatively mobile customers or relatively large customers able to negotiate price discounts that are not available to less mobile or smaller customers. 3.1.2. Price Reductions Due to Capture of Economic Rents Sometimes the marginal costs of generation services are lower than utilities’ average costs, and sometimes they are higher. Marginal costs are higher than average costs during periods of high inflation, when the capital costs, fuel costs, and other operating costs of generators are higher than expected. Marginal costs are lower than average costs during periods of low inflation or when technological advances are greater than expected. During years when marginal costs are lower than average costs, there is political pressure to open electricity markets to competition so that consumers can obtain lower-priced electricity. At such times, retail choice allows non-utility suppliers to attract customers away from utilities. During years when marginal costs are higher than average costs, by contrast, there is little or no Christensen Associates Energy Consulting, LLC 15 2/11/16
You can also read


