Rising Temperatures, Falling Ratings: The Effect of Climate Change on Sovereign Creditworthiness
←
→
Page content transcription
If your browser does not render page correctly, please read the page content below

BENNETT INSTITUTE WORKING PAPER

Rising Temperatures, Falling Ratings:
The Effect of Climate Change on Sovereign Creditworthiness*

By
Patrycja Klusakab
Matthew Agarwalabc†
Matt Burkeab
Moritz Kraemerde
Kamiar Mohaddesf

a
  University of East Anglia, UK
b
  Bennett Institute for Public Policy, University of Cambridge, UK
c
  Centre for Social and Economic Research on the Global Environment, UEA, UK
d
  Centre for Sustainable Finance, SOAS, UK & Goethe-University, Frankfurt, Germany
f
  Judge Business School & King’s College, University of Cambridge, UK

18 March 2021

* We are grateful for helpful comments and suggestions from Franklin Allen, Kevin Aretz, Diane Coyle, Naoki Funada,
Stephany Griffith-Jones, Zeina Hasna, Raphael Markellos, Ellen Quigley, Nick Robbins, Nina Seega, Richard Tol, Uli Volz,
Dimitri Zenghelis, and colleagues across the INSPIRE network. This work is possible due to funding from INSPIRE.
Matthew Agarwala acknowledges financial support for the Bennett Institute Wealth Economy Programme from LetterOne.
† Corresponding author. E-mail address: mka30@cam.ac.uk

This research has been funded by the International Network for Sustainable Financial Policy Insights, Research and
Exchange (INSPIRE). INSPIRE is a global research stakeholder of the Network for Greening the Financial System (NGFS);
it is philanthropically funded through the ClimateWorks Foundation and co-hosted by ClimateWorks and the Grantham
Research Institute on Climate Change and the Environment at the London School of Economics.
Abstract
Enthusiasm for ‘greening the financial system’ is welcome, but a fundamental challenge
remains: financial decision makers lack the necessary information. It is not enough to know
that climate change is bad. Markets need credible, digestible information on how climate
change translates into material risks. To bridge the gap between climate science and real-world
financial indicators, we simulate the effect of climate change on sovereign credit ratings for
108 countries, creating the world’s first climate-adjusted sovereign credit rating. Under various
warming scenarios, we find evidence of climate-induced sovereign downgrades as early as
2030, increasing in intensity and across more countries over the century. We find strong
evidence that stringent climate policy consistent with limiting warming to below 2°C,
honouring the Paris Climate Agreement, and following RCP 2.6 could nearly eliminate the
effect of climate change on ratings. In contrast, under higher emissions scenarios (i.e., RCP
8.5), 63 sovereigns experience climate-induced downgrades by 2030, with an average
reduction of 1.02 notches, rising to 80 sovereigns facing an average downgrade of 2.48 notches
by 2100. We calculate the effect of climate-induced sovereign downgrades on the cost of
corporate and sovereign debt. Across the sample, climate change could increase the annual
interest payments on sovereign debt by US$ 22–33 billion under RCP 2.6, rising to US$ 137–
205 billion under RCP 8.5. The additional cost to corporates is US$ 7.2–12.6 billion under
RCP 2.6, and US$ 35.8–62.6 billion under RCP 8.5.
Keywords: Sovereign credit rating, climate change, counterfactual analysis, climate-economy
models, corporate debt, sovereign debt.
1. Introduction

Climate change is “the biggest market failure the world has seen” (Stern 2008), with wide-
ranging implications for stability – financial, economic, political, social, and environmental.
Leading climate-economy models estimate economic losses from climate change of between
2% and 22% of gross world product by 2100 (Burke et al., 2015; Dell et al., 2014 and Kahn et
al, 2019). Beyond impacts on aggregate output, the environmental, social and policy
consequences of climate change will directly impact firms, investors, and regulators. Possible
transmission pathways include physical damages from extreme weather events, consumer
movements (including boycotts, protests, in reputational risks), transition risks (e.g., from
regulations and asset stranding), and litigation risks (e.g., lawsuits over environmental
damages). Dietz et al. (2016) estimate that the ‘climate value at risk’ of global financial assets
amounts to US $2.5 trillion. Financial markets face growing pressure to factor these climate
impacts into decision making and to mobilise trillions of dollars of capital in pursuit of a Just
Transition towards a low carbon future (Fiedler et al., 2021). Whilst enthusiasm for ‘greening
the financial system’ is welcome, a fundamental challenge remains: investors and businesses
lack the necessary information.

To green the financial system, it is not enough to know that climate change is bad. Firms,
investors, financial institutions, and regulators need scientifically credible information on how
climate change translates into material financial risks, how to price those risks, and how to
manage them. Growing demand for climate risk disclosures comes from private investors,
activist shareholders, universal owners, public regulators, treasuries and central banks
(Deutsche Bundesbank 2019). Investor-led demand for climate risk disclosures has sparked a
rapid expansion of the Environmental, Social, and Corporate Governance (ESG) ratings
market, which by some estimates may reach $1 billion in 2021, with approximately $30 trillion,
or one-third of all professionally managed assets now subject to ESG criteria (Opimas 2020;
Howard-Grenville 2021). Regulator-led demand for climate disclosures includes the
development of the Task Force on Climate-related Financial Disclosures (TCFD) to improve
risk assessments, support better informed capital allocation decisions, and improve short-,
medium-, and long-term strategic planning (TCFD 2017). Globally, more than 1,340
companies with a market capitalization of $12.6 trillion and financial institutions responsible
for assets of $150 trillion have expressed support for the TCFD (TCFD 2020).

                                                1
However, the credibility and usefulness of existing climate disclosures is mixed (Mathiesen
2018; Siew 2015). A chief concern is the lack of scientific foundations in climate risk
disclosures. Climate models typically operate at the global or national scale, and assess changes
in temperature and precipitation over decades or centuries. Translating these projections into
material risk assessments on the spatial and temporal scale needed for business and investment
decisions remains a challenge (Fielder et al., 2021). Beyond the lack of scientific
underpinnings, further limitations include a narrow focus on firm behaviour to the exclusion
of crucial systemic and macroeconomic context, short-term assessments that fuel the “tragedy
of the horizon” (Carney 2015), and the incomparability of disclosures from different firms and
ESG ratings methods (Fiedler et al., 2021; Mathiesen 2018). The result is an overall failure to
translate climate science into credible metrics for conveying risks to financial decision makers.

We contribute to closing the gap between climate science and real-world financial indicators.
Specifically, we simulate the effect of climate change on sovereign credit ratings for 108
countries under three different warming scenarios, reporting results for the years 2030, 2050,
2070, and 2100. The conceptual framework described in Figure 1 outlines our process for ‘soft-
linking’ climate science with climate economics, leading sovereign credit ratings methods, and
existing evidence on the effects of sovereign downgrades on the cost of public and corporate
debt. Our goal is to remain as close as possible to climate science, economics, and real-world
practice in the field of sovereign credit ratings. To the best of our knowledge, we are the first
to simulate the effect of future climate change on sovereign credit ratings, and our approach
enables us to evaluate these impacts under various policy and warming scenarios. 1

In Figure 1, blue boxes (top row) represent the status quo in three domains: climate science,
climate-economics, and sovereign credit ratings. Climate science projects changes in
temperature and precipitation. Climate economics translates these into impacts on output and
growth (white box). However, a significant gap remains between climate-adjusted GDP
estimates and sovereign ratings. The green boxes and arrows represent our novel approach to
closing this gap. 2 First, we develop a random forest machine learning model to predict
sovereign credit ratings, training it on sovereign ratings issued by S&P (2015-2020) to

1
  S&P (2015a,b) represent the first investigations into the effect of extreme weather and natural disasters on
ratings. However, they only include direct damage to property and infrastructure resulting from 1-in-250 year
natural disastsers. For an extended review of literature see Appendix A.
2
  Climate-economy model literature is vast. See extended literature review in Appendix A.

                                                      2
maximise its predictive accuracy. Second, we combine climate economic models and S&P’s
own natural disaster risk assessments to develop a set of climate-adjusted macroeconomic data
(government performance variables) to feed the ratings prediction model created in step 1. We
feed our model with climate-adjusted macroeconomic inputs under a range of policy and
warming scenarios to simulate the effect of climate change on sovereign ratings, reporting
results for 2030, 2050, 2070, and 2100. 3 Finally, using existing research on the effect of
sovereign downgrades on yields, we calculate the additional cost of corporate and sovereign
capital due to climate-induced sovereign downgrades (purple).
Figure 1. Conceptual Framework: Bridging the gap between climate science and financial
indicators
We focus on sovereign ratings for several reasons. First, they are readily interpretable and
familiar indicators creditworthiness, already used by investors, portfolio managers, financial
institutions and regulators in a range of decision contexts. For instance, ratings are ‘hardwired’
into decisions over which securities investors can hold (e.g., institutional investors may be
committed by their charter not to hold debt below a certain rating (Fuchs & Gehring 2017)).
Similarly, under Basel II rules, ratings directly affect the capital requirements 4 of banks and
insurance companies (Almeida et al., 2017). Moreover, approximately US$ 66 trillion, global
sovereign debt accounts for a large share of total assets under management (PRI 2019). As
3
Results for other years available on request
4
Basel II ‘hardwires’ ratings into the capital requirements imposed on banks and insurance companies holding
specific sovereigns or firms. The rating bins on sovereign claims and their corresponding risk weights are as
follows: AAA to AA− (0%), A+ to A− (20%), BBB+ to BBB− (50%), BB+ to B− (100%), and below B− (150%)
(Almeida et al., 2017).
3measures of the creditworthiness of this debt, sovereign ratings act as ‘gatekeepers’ to global
markets, significantly influencing the cost and allocation of capital across countries (Cornaggia
et al., 2017).
Sovereign downgrades increase the cost of both public and private debt, influencing overall
economic performance and with potentially significant implications for business across all
sectors (Chen et al., 2016). If the economic effects of climate change reduce sovereign
creditworthiness, there could be indirect impacts on other asset classes. One potential
mechanism is the ‘sovereign ceiling effect,’ 5 whereby sovereign ratings implicitly place an
upper bound on ratings in other asset classes (Adelino & Ferrera 2016; Almeida et al., 2017;
Borensztein et al., 2013). A second and closely related mechanism is the observed ‘sovereign
spill-over effect’, whereby sovereign downgrades are quickly followed by downgrades in other
asset classes (Augustin et al., 2018; Baum et al., 2016; Gennaioli et al., 2014). Because both
the ceiling and spillover effects are more pronounced for firms and financial institutions whose
ratings are closest to the sovereign’s, any climate-induced downgrades are likely to have a
greater impact on the highest rated firms.
A further motivation for focusing on sovereign ratings is the observation that climate change
does not just affect firms individually, it affects countries and economies systemically. Narrow,
firm-level assessments that ignore broader climate impacts are necessarily incomplete. For
instance, major floods, storms, and fires have impacts across sectors rather than just hitting
individual firms. Combined, the sovereign ceiling, spillovers, size of the sovereign bond
market, and the indiscriminate nature of climate change means no corporate climate risk
assessment is complete without also considering the effect climate on sovereigns. Finally,
because sovereign ratings impact bond yields (i.e., the cost of public borrowing), understanding
how they might be affected by climate change is central to long-term fiscal sustainability.
5
For example, following a sovereign downgrade of Italy on the 28th April 2020, Fitch downgraded four Italian
banks: UniCredit S.p.A.'s, Intesa Sanpaolo's (IntesaSP), Mediobanca S.p.A.'s , and Unione di Banche Italiane
S.p.A.'s (UBI). https://www.fitchratings.com/research/structured-finance/covered-bonds/fitch-downgrades-four-
italian-banks-following-sovereign-downgrade-12-05-2020. Similarly, Moody’s downgraded 58 sub-sovereign
entities after UK's sovereign action 16th October 2020.
https://www.moodys.com/touupdated.aspx?isAnnual=true&lang=en&cy=global&ru=%2fresearch%2fMoodys-
has-taken-rating-actions-on-58-sub-sovereign-entities--PR_434579
4Our results document three key findings. First, we show that under various warming scenarios,
climate change could induce sovereign downgrades as early as 2030, with larger downgrades
across more countries to 2100. For instance, in absence of climate policies (i.e., RCP 8.5 6
scenario), 63 sovereigns experience downgrades of approximately 1.02 notches by 2030, rising
to 80 sovereigns facing a downgrade of 2.48 notches by 2100. Second, our data strongly
suggests that stringent climate policy consistent with the Paris Climate Agreement will result
in minimal changes to the current ratings profile. We find that an average reduction is sovereign
rating of 0.65 notches remains unchanged over time between 2030-2100. The additional costs
to sovereign debt – best interpreted as increases in annual interest payments due to climate-
induced sovereign downgrades – in our sample is US$ 22–33 billion under RCP 2.6, rising to
US$ 137–205 billion under RCP 8.5. The additional costs to corporates reach US$ 7.2–12.6
billion under RCP 2.6, and US$ 35.8–62.6 billion under RCP 8.5. This suggests that early
investments in climate mitigation and adaptation can ultimately improve long-run fiscal
sustainability and reduce corporate costs of debt. We find qualitatively similar results using
two independent climate-economy models; Burke et al. (2015) and Kahn et al. (2019). Results
are robust to changing the time series of ratings used to train the prediction model, restricting
the model to only those sovereigns with investment grade ratings, and varying assumptions
about the degree of temperature volatility within the baseline climate-economic model.
These results are of interest to finance ministries and central banks, regulators (e.g., ESMA and
the SEC), banks, insurers, and institutional investors. Climate-induced sovereign downgrades
provide a direct and immediate financial incentive for sovereigns to pursue climate-smart
investments, (e.g., boosting resilience and adaptive capacity) to improve their current rating
and reduce the cost of borrowing. The research is timely, as governments seek to balance fiscal
stimulus following the Covid-19 pandemic against the need to manage the public finances in
the long run. That public investment in low-carbon climate resilient infrastructure presents an
attractive long-run growth opportunity is firmly established (Hepburn et al., 2020; Zenghelis
et al., 2020). Our results add further support by demonstrating that earlier action improves
fiscal positions through two channels: (i) reducing the cost of corporate debt, thereby enhancing
6
RCPs are Representative Concentration Pathways and describe different potential scenarios of future emissions
trends. RCP 2.6 is the ‘stringent climate policy’ scenario and is most consistent with limiting warming to below
2°C. RCP 8.5 is the high emissions scenario and is more consistent with a 5°C warming world. See extended
literature review, Appendix A.
5competitiveness, and (ii) reducing future interest rates on sovereign debt, thereby maintaining
fiscal operating space and reducing future tax burdens.
Our results are of central importance to the regulation of CRAs and development of ESG
standards. Although the European Securities and Markets Authority (ESMA, which regulates
credit ratings agencies (CRAs) in Europe) has called for greater transparency and disclosure
around ESG factors they have refrained from introducing formal requirements (ESMA 2019).
Existing climate disclosures and ESG ratings remain largely voluntary and are not standardised.
CRAs recognise that climate and environmental factors “could have significant implications
for sovereign ratings in the decades to come… [although they] pose a negligible direct risk to
sovereign ratings in advanced economies for now, on average, ratings on many emerging
sovereigns (specifically those in the Caribbean or Southeast Asia) will likely come under
significant additional pressure” (S&P 2018). One potential obstacle is a lack of credible
methods for assessing the impact of climate on creditworthiness (Buhr et al., 2018). Our
research represents a first step in providing such a method.
The remainder of this paper is as follows. Section 2 describes data and methodology. Section
3 provides empirical results of climate-adjusted sovereign credit ratings. Section 4 discusses
additional cost sovereign and corporate borrowing due to climate-induced downgrades. Finally,
Section 5 offers some concluding remarks.
2. Data and methodology
2.1. Rating data
Our sample consists of 1385 annual long-term foreign-currency sovereign ratings for 108
countries, issued by S&P between 2004 and 2020, obtained from S&P Ratings Direct database.
Alphabetical ratings are translated into a 20-notch scale widely used in the literature (Correa et
al., 2014; see Table B.1). Although several agencies issue sovereign ratings, we use S&P’s
because they have the widest country coverage over the assessment period and their ratings
actions have the strongest own-country stock market impact (Almeida et al., 2017; Brooks et
al., 2004; Kaminsky & Schmukler 2002).
62.2. Macroeconomic data
Our ratings prediction model is parsimonious, incorporating just six macroeconomic
indicators. 7 This approach is motivated by a desire to avoid overfitting, and most importantly,
to ensure our model inputs remain as close as possible to the underlying climate science and
economic models. Our baseline climate-economy model (Kahn et al., 2019) provides estimates
of climate-adjusted real GDP growth rates and levels up to 2100. Table 1 presents our
determining factors and highlights a range of cross-sectional descriptive statistics. Data comes
from S&P Ratings Direct Sovereign Risk Indicators (SRIs). Countries in the sample display a
wide range of income levels, growth rates, and macroeconomic performance indicators.
Table 1. Summary Statistics
Variable Mean St. Dev. Min Max
Log GDP per capita (US $) 8.98 0.19 8.47 9.20
Real GDP Growth 0.78 2.77 -0.09 11.19
Net General Government Debt/GDP 29.87 6.13 19.09 37.94
Narrow Net External Debt/CARs 51.96 11.89 28.91 66.58
Current Account Balance/GDP -1.42 1.01 -3.64 0.81
General Government Balance/GDP -2.01 1.38 -4.36 0.16
Notes: Table 1presents summary statistics for the natural logarithm of nominal GDP per capita in US $ (Log GDP
per capita (US$)), the annual nominal growth rate (GDP Growth), net general government debt/GDP, narrow net
external debt/current account receipts (CARs), current account balance/GDP, and general government
balance/GDP. Data sample covers period between 2004 and 2020.
Variable selection is based on several factors: relevance for predicting ratings, the availability
and quality of scientific evidence describing how they respond to climate change, and country
coverage. Our commitment to climate-science underpinnings entails a trade-off: we are unable
to include some important determinants of ratings (e.g., political stability and government
transparency, see Table 2) because we do not have credible science-based descriptions of how
they vary with climate. The method is readily extendable when such information becomes
available. Furthermore, we provide evidence that these variables lose predictive importance as
we move up the ratings scale, instilling further confidence in our results because the impact of
climate on ratings is most substantial for highly rated sovereigns.
7
For example, De Moor et al. (2018) and Ozturk et al. (2016) employ 23 and 16 variables to predict ratings. See
the literature review in Appendix A.
72.3. Methods
We create a parsimonious, six-variable model to reconstruct sovereign credit ratings based on
S&P’s published methodology. 8 The twin objectives are (i) to remain as close as possible to
S&P’s ratings method to ensure good predictive capacity, and (ii) maintain the greatest possible
scope for incorporating science-based climate-adjusted macroeconomic variables. 9
Two of these (climate-adjusted GDP and its growth rate) come directly from climate-economic
models (Kahn et al., 2019; Burke et al., 2015). Beyond GDP, sovereign ratings include a range
of government performance indicators including net general government debt/GDP, narrow net
external debt/current account receipts, current account balance/GDP, and general government
balance/GDP. To construct climate-adjusted versions of the four government performance
variables in our model, we construct statistical models based on data from S&P’s own
assessments (see SM, Appendix B for details). For example, S&P (2015b) produce estimates
of the effect of various climate and natural disasters on our set of government performance
indicators presented in column 1 of Table 1.
Finally, we feed our newly created climate-adjusted macroeconomic indicators to our
sovereign ratings model to simulate the effect of climate on ratings. For comparability with the
literature and to demonstrate the effect of strict climate policies that are consistent with meeting
the Paris Agreement, we present results under four warming scenarios: RCP 2.6, RCP 8.5, and
both of these, but allowing the variability of temperature around its long-run average to rise
with temperature.
2.3.1. Reconstructing sovereign credit ratings
We develop a two-step strategy to simulate the effect of climate change on sovereign ratings.
Using S&P’s sovereign rating method as a template, step one constructs a sovereign ratings
prediction model using supervised machine learning methodologies (Breiman 2001). Step two
8
Sovereign credit ratings incorporate a wide range of objective macroeconomic data and subjective assessments
by ratings agencies. Although the science, economics, and politics of climate change are widely studied, we do
not have a reliable source of information on how climate change will impact every variable included in the
sovereign ratings methodology.
9
Due to the nature of macroeconometric climate models, our results focus primarily on economic losses arising
from physical impacts of climate change. That is, we do not capture transition or litigation risks, including the
possibility of climate refugees, civil unrest, or political instability. However, our approach can be readily extended
to incorporate these impacts when credible quantitative estimates are available. As such, our results may be
considered lower-bound estimates of the effect of climate change on sovereign ratings.
8identifies or constructs climate-adjusted versions of macroeconomic performance indicators to
feed the prediction model from Step 1. The two most prominent climate-adjusted indicators are
log per capita GDP and real GDP growth, which we take directly from Kahn et al. (2019) under
two warming scenarios, RCP 2.6 and RCP 8.5. The remaining four are termed the ‘government
performance indicators’ and are identified by S&P as important inputs into sovereign ratings.
These include: net general government debt/GDP, narrow net external debt/current account
receipts (CARs), current account balance/GDP, and general government balance/GDP.
Traditional approaches to modelling credit ratings rely on parametric estimations (such as
ordered response models or OLS; see for example, Cantor & Packer 1996; Afonso et al., 2009;
2011; Baghai et al., 2016). However, due to the non-linearity of ratings and their distributional
properties, and to address multicollinearity, researchers have considered non-parametric
approaches to model sovereign ratings (Bennell et al., 2006; De Moor et al., 2018; Fioramanti,
2008; Markellos et al., 2016; Ozturk et al., 2016). The central benefits associated with these
approaches are much better handling of non-linear outcomes in the data (Markellos et al., 2016)
and the potential for superior fit (De Moor, 2018). Because sovereign ratings may be subject
to thresholds in country-level predictors, such as GDP per capita (S&P 2017), methods capable
of handling non-linearities are essential.
Random forest algorithms are the primary machine learning technique in the application of
credit rating prediction (Ozturk et al., 2016; De Moor et al., 2018). Decision tree algorithms
operate by constructing a series of nodes (see SM, Appendix A, Figure A.2). At each node the
algorithm selects the feature which provides the best split of the data. Once the data has been
split on the first feature, it then attempts to split the data again such that the subsequent splits
are as different from the previous split as possible, but as similar to each other as possible. This
process continues until the data can no longer be split on the features provided.
Random forest algorithms can be thought of as extensions of decision trees. However, whereas
decision tree algorithms can be highly sensitive to the data on which they have been trained,
random forests reduce this sensitivity by enabling each tree within the forest to be trained upon
a randomly selected sub-sample of the data, with replacement. Moreover, in an ordinary
decision tree process, the algorithm selects the feature (from all available features) which
provides the best split. A random forest algorithm enables the tree to select from only a random
subset of features. The intuition behind each of these two modifications is that the prediction
9made by a forest is an average of the decision made by each tree, and as a consequence is much
more reliable and robust as a collection.
2.3.2. Random forest estimation, variable importance, and partial plots
A key advantage of using machine-learning approaches is their ability to model non-linearities.
Figure 2 shows the partial effect of increases in standardised GDP per capita and the growth
rate on the sovereign credit rating. The left panel demonstrates that as ln GDP per capita (US$)
increases, the sovereign meets the threshold criteria for increasing rating scores. Furthermore,
this panel demonstrates that GDP per capita has various empirical limitations with regards to
the ratings it will impact. For instance, the graph suggests that at a certain point, ln GDP per
capita (US$) can continue to decrease with no resulting impact on the rating. This may partially
explain the effect of the estimations on poorer countries observed in the previous sections.
Other variables may be more important at predicting ratings at the lower end of the scale. The
second panel to the right demonstrates the relationship GDP growth has on the rating. This
variable seems to have its greatest impact over a much smaller range than per capita GDP.
Furthermore, the relationship is clearly non-linear. Increases in the growth rate are beneficial
in pushing the sovereign further into the investment grade ratings. However, beyond a certain
point this effect is lost almost entirely.
Figure 2. Marginal Effects of per capita GDP and Growth on Ratings
10An important consideration is whether the variables considered important by our random forest
procedure are consistent with those identified in the empirical literature on estimating
sovereign ratings (Cantor and Packer 1996; Afonso et al., 2009; 2011; Baghai et al., 2016).
Table 2 confirms this is the case, reporting variable importance in the random forest analysis
across various subsamples. This analysis iterates through the list of predictor variables,
imputing the values with random figures, and reassessing the estimation accuracy. The loss in
accuracy (formally, increase in the mean square error) during this procedure is gauges the
importance of each variable for predicting ratings. Table 2 provides estimates of the percentage
increase in mean square error associated with the loss of variables commonly used to predict
ratings.
Table 2. Variable importance (% increase in MSE)
G20 subsample Rest of the world Investment Speculative
grade grade
GDP per capita (US$) 12.20 29.32 40.47 17.16
Real investment growth 2.93 14.15 16.81 7.15
Investment/GDP 12.85 32.76 28.31 14.04
Unemployment 18.41 28.15 32.32 16.82
CPI growth 15.27 17.63 15.97 18.58
Real exports growth 0.08 6.55 6.39 6.88
Current account 8.79 27.88 17.69 17.52
balance/GDP
General government 8.57 28.41 23.78 8.54
balance/GDP
Voice and accountability 17.86 23.99 18.05 18.59
Political stability 13.39 15.49 22.96 14.02
Government 13.75 25.69 27.68 14.72
effectiveness
Regulatory quality 16.45 30.05 31.26 19.13
Control of corruption 15.69 13.92 23.31 18.13
Notes: Table presents the percentage increase in mean squared error attributable to the random forest prediction
when the corresponding variable is imputed with random values. Column 2 presents the results for the G20
subsample, Column 3 corresponds to the rest of the world subsample, Column 4 contains investment grade only,
and Column 5 relates to speculative grade only. Data sample covers period between 2004 and 2020.
11Key economic indicators demonstrate substantial value in this analysis, justifying their
inclusion. However, notably a selection of World Bank governance indicators also provides
reasonable explanatory power. This is especially true for countries outside of the G20 where
e.g. political stability may be a greater constraint on ratings. Furthermore, columns 4 and 5
show the variation between countries with investment grade and speculative grade ratings.
Amongst investment grade countries GDP per capita and associated economic indicators are
the clear empirical driver of the rating. However, amongst speculative grade this is less clear.
World Bank governance metrics play a much more important role alongside primary economic
variables. This finding perhaps explains aspects of the see-saw effect observed in the main
result. Countries at the lower end of the scale rely, to a greater extent, on qualitative, factors
for a reliable rating prediction.
3. Empirical results
3.1. Step 1: Reconstructing ratings
Table 3 demonstrates our model’s ability to predict sovereign existing sovereign ratings (i.e.,
before we incorporate climate change). Rows 2-5 indicate the deviation (in notches) between
ratings issued by S&P and our predictions, starting with N=0 (exact match) to N=3 (our model
is off by three notches). Columns 3-5 indicate increasingly restrictive slices of the data, starting
with the whole sample in column 3, and providing results for out of sample tests (using 80%
of the data to predict the remaining 20%) for all countries in column 4, and for only those
countries with investment grade ratings in column 5.
Table 3. Predictive accuracy of our ratings prediction model
Whole sample Out of sample Investment grade
80/20% split only. Out of sample
80/20%
% predicted N=0 67.92 31.75 34.78
within n notches N=1 96.24 76.19 63.77
N=2 99.69 90.48 81.16
N=3 - 94.44 92.75
Observations 639 513 / 126 276 / 69
Countries 108 108 62 / 42
Notes: Table presents the results of the predictive capacity for our benchmark random forest model. Columns 3-
5 show the percentage accuracy of our model corresponding to the number of notches in Column 2. Columns 3,
124 and 5 present the results for the whole sample, out of sample and investment grade only respectively. Data
sample covers S&P ratings issued 2015-2020.
Our benchmark model (column 4) yields exact matches between predicted and observed ratings
31.75% of the time, increasing to over 90% accuracy within two notches. The literature
indicates that eliminating countries that have recently defaulted can improve predictive
accuracy. To test this, column 5 restricts the analysis to only those countries with investment
grade ratings. Although we see a minor increase in exact matches, we see a loss of accuracy
within two notches in out of sample tests. One potential reason is that focusing only on
investment grade sovereigns reduces the sample for training the model by nearly half. A further
concern is that vulnerability to climate change may be correlated with low sovereign ratings,
for instance if developing countries rely more heavily on climate-sensitive industries such as
agriculture, have less climate resilient infrastructure (e.g., poor road quality or flood defences),
and have lower quality governance and institutions associated with the resource curse.
Eliminating these countries from the sample would make our results less representative. As
such, our baseline model includes all 108 countries in the sample and is trained on S&P’s
ratings issued between 2015 and 2020.
Figure 3 presents graphical interpretations of the out of sample accuracy of sovereign rating
predictions given in Table 3 (column 4). The solid line depicts accuracy of the estimated rating
compared to the actual rating. Each observation is accompanied by the predicted rating (dot)
and its error. Out of sample predictions yield exact matches for up to 31.75% of the data and
are within 2 notches over 90% of the time. Standard errors are produced using the jackknife
methodology summarised in Wager et al. (2014).
Figure 4 demonstrates the geographical spread of our predictions model. The key observation
is that high predictive accuracy does not appear to be concentrated in any particular region,
climate, size, development status, or political system. Exact matches appear for countries as
diverse as Brazil, Finland, Uganda, Germany, Honduras, and Mongolia. Most of the G20
countries are predicted within one notch. Argentina, Colombia, Ecuador and Iraq are the least
well predicted by our model, which may be expected due to the history of debt crises, defaults,
civil unrest, war, and government instability in these countries. This explanation is consistent
with Table 2, column 5, which indicates the higher predictive weight placed on governance
quality, corruption, and political stability for speculative grade countries. Because we do not
13have credible quantitative data on the effect of climate change on these governance indicators,
they are not included in our ratings prediction model.
Figure 3. Out of sample accuracy of our ratings prediction model (2015 - 2020 data, all
countries)
Figure 4. Out of sample predictive accuracy of our sovereign ratings model
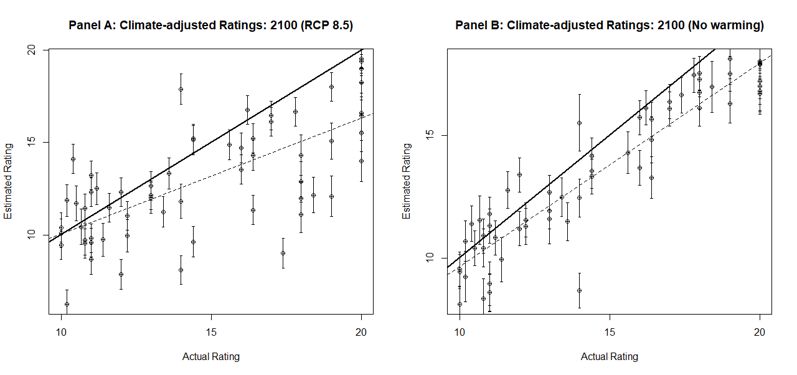
143.2. Step 2: Climate adjusted sovereign ratings: baseline model
We next present the results from our baseline model 10 under two warming scenarios (RCP 2.6
and RCP 8.5) for the years 2030, 2050, 2070, and 2100. 11 All results presented here rely on the
same macroeconometric climate model from Kahn et al. (2019). Panels A and B of Figure 5
present simulated, climate-adjusted sovereign ratings under RCP 8.5 and RCP 2.6 for the year
2030 respectively. As in Figure 3, the horizontal axis indicates current ratings by S&P and the
thick black line represents exact matches between current and predicted ratings. Here, however,
our predicted ratings are inclusive of climate change under RCP 8.5, with the dotted line
indicating best fit. The results indicate that climate-induced sovereign downgrades may be
expected within the next decade and are most likely to impact the highest rated countries.
Figure 5. Climate-adjusted Ratings: 2030 (RCP 8.5 versus RCP 2.6)
The concentration of downgrades at the top end of the ratings scale may appear
counterintuitive, given that wealthier countries tend to have more diversified economies with
greater capacity to respond to shocks. It may be expected that poorer countries (and therefore
lower-rated sovereigns) are relatively more exposed and less able to respond to climate shocks.
However, the underlying climate-economic model (Kahn et al., 2019) anticipates economic
losses for countries at all development levels. For interpreting our results, it is important to
remember that not all notches are created equal: a downgrade from AAA to AA+ reflects
10
108 countries, using ratings from 2015 to 2020, 6-variables, Kahn et al. (2019) for the climate-economy model.
11
Figures for 2050, 2070, 2100 are available upon request.
15smaller reduction in creditworthiness than a downgrade from investment grade to speculative
grade, or a rating downgrade within the range of speculative ratings. This nonlinear relationship
between rating and default frequency is demonstrated by the agencies’ annual rating default
and transition studies. Moreover, our objective is to identify the effect of climate change on
sovereign ratings, not national economies. The fact that AAA rated countries may suffer worse
downgrades than B rated ones does not imply that these wealthy countries will also suffer worse
economic damages from climate change. Our result is consistent with the nature of sovereign
ratings, which provide information about both the ability and willingness of sovereigns to
service their debt. Countries with low ratings often already face a range of political, economic,
and social challenges that indicate a low ability or willingness (or both) to service debt. Whilst
we expect climate to have severe consequences for low-income countries, this may not further
affect the rating if the country is already considered a high credit risk.
Finding downgrades just 10 years into the future is significant, as a common critique of the use
of climate science in developing climate-finance metrics is that the timescales are
incompatible: climate impacts accrue in the distant future, whereas financial decisions take
place over a much shorter period. This conflict has been dubbed the ‘Tragedy of the Horizon”
(Carney 2015). Our findings indicate that climate could impact ratings within the standard 10-
year ratings horizon.
Figure 5, Panel B presents results for the same simulation under RCP 2.6. Although some
downgrades are still predicted at the top end of the scale, these are fewer in number and
intensity than under RCP 8.5. This demonstrates the potential for stringent climate policy to
reduce the downward effect of climate change on sovereign ratings within the next decade.
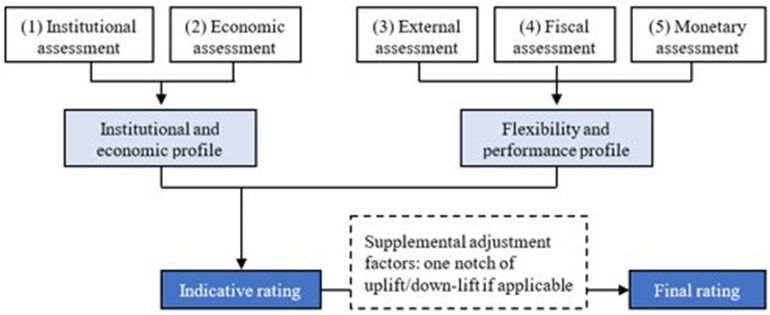
Figure 6 presents the best fit lines for our climate-adjusted ratings under RCP 8.5 and 2.6,
respectively, for 2030, 2050, 2070, and 2100 (Panels A and B). Axes and the bold lines are
interpreted in the usual way. Data points indicate current observed and predicted ratings,
excluding climate change. Fig. 6, Panel A demonstrates climate-induced sovereign downgrades
of increasing magnitude and across more countries as we look further into the future under
RCP 8.5. Again, downgrades are largest at the top end of the ratings scale, but we begin to see
impacts across the full range of investment grade sovereigns. In contrast, Panel B indicates that
stringent climate policies consistent with RCP 2.6 continue to protect against substantial
16climate downgrades over the assessment period. 12 T-tests indicate that ratings predicted over
any period to 2100 under RCP 2.6 are not statistically significantly different from each other
or from current ratings predicted without climate change.
Figure 6. Climate-adjusted ratings to 2100 (RCP 8.5 versus 2.6)
Figures 7-8 depict the magnitude and geographical distribution of sovereign ratings changes
predicted by our model by 2100 under RCP 2.6 and RCP 8.5, respectively. Under RCP 2.6, 62
sovereigns experience downward pressure on ratings by 2030, with an average reduction of
0.66 notches. The number of downgraded sovereigns drops to 55 by 2100, with the intensity
of the downgrade virtually unchanged (average of 0.65 notches). Countries mostly affected by
the downgrades are Chile and China with 2.56 and 2.05 notches respectively. Amongst other
sovereigns we see Morocco, India and Colombia in the range 1.39 to 1.52 notches. This
suggests that limiting warming to well below 2°C could greatly reduce the effect of climate
change on sovereign ratings.
In contrast, under RCP 8.5, 63 sovereigns experience climate-induced downgrades by 2030,
with an average reduction of 1.02 notches, rising to 80 sovereigns facing an average downgrade
of 2.48 notches by 2100. The most affected nations include Chile, China, Slovakia, Malaysia,
12
The tight bunching of best fit lines for 2030, 2050, 2070, and 2100 under RCP 2.6 around the bold line makes
the time series difficult to discern graphically. T-tests confirm that they are not statistically significantly different
from each other.
17Mexico, India, Peru and Canada all exceeding 5 notches downgrades. The least affected by
downgrades are Oman, Cyprus and Honduras with results under 0.3 notches.
Figure 7. Global climate-induced sovereign ratings changes (2100, RCP 2.6)
Figure 8. Global climate-induced sovereign ratings changes (2100, RCP 8.5)
Combined, the maps indicate a now familiar story: stringent climate policy under RCP 2.6 and
largely consistent with the Paris Climate Agreement is associated with only minor downgrades
18across most of the world. In both figures, some countries (Argentina, Iraq, and Ecuador) appear
to receive upgrades. We urge extreme caution against over-interpreting these counterintuitive
findings, as our model’s predictive capacity for these countries is relatively low (see Figure 4).
This is likely because factors not included in our model such as political stability and default
history in these countries mean that current ratings are relatively low for their GDP (see Table
2 and surrounding text). Our model does not include governance and political stability metrics
because we do not have authoritative quantitative data on how these measures are likely to
change as a result of climate change.
3.3. Increased temperature variability
Our baseline model relies on Kahn et al. (2019) to describe the impacts of warming on real
GDP and GDP growth rates. They explicitly model changes in the distribution of weather
patterns; that is not only averages of climate variables that the climate-macro literature focuses
on but also their variability. Therefore, this model enables us to incorporate varying degrees of
temperature volatility within the overall warming trend. Put simply, we can choose whether
warming is characterized by high and low temperatures that cluster tightly around their 30-year
moving averages, or whether they deviate with increasing volatility as temperature rises.
Lower volatility could reduce shocks and means adaptation costs can be spread over time.
Higher volatility may require more upfront investments and lead to asset stranding. Beyond
rises in the average, rises in the volatility of temperature are increasingly recognised as
economically important. For instance, Kotz et al. (2021) find that increased temperature
volatility reduces economic growth “independent of and in addition to changes in annual
average temperature.”
To incorporate the effects of increased temperature volatility in our model, we allow
temperature increases to affect the variability of temperature shocks commensurately, or in
other words we keep the coefficient of variation unchanged. On average, this increases the
costs of climate change by 80% globally under the RCP 8.5 scenario, with the size of these
income effects varying across countries depending on the pace with which temperatures
increase and historical variability of climate conditions in each country.
Compared to Panel B of Figure 6, Panel B of Figure 9 indicates that climate change will have
a larger impact on sovereign ratings if temperature volatility rises, even under RCP 2.6.
19However, although the effect is marginally larger, it remains the case that stringent policies
consistent with RCP 2.6 will limit the effect of climate on sovereign ratings. In contrast, Fig 9,
Panel A demonstrates that increased temperature volatility leads to far more substantial
climate-induced sovereign downgrades, sooner, and along a much wider range of the ratings
scale.
Figure 9. Climate-adjusted ratings with increased temperature volatility (RCP 8.5 versus 2.6)
4. Additional cost of sovereign and corporate borrowing due to climate-induced sovereign
downgrades
Previous research demonstrates that sovereign downgrades increase sovereign spreads (Afonso
et al., 2012; Gande and Parsley 2005). Estimates of the effect of a 1-notch downgrade in
sovereign rating on increases in yield spreads range from 0.08-0.112% (Afonso et al., 2012) to
0.12% (Gande and Parsley 2005). Taking these as lower and upper bounds (respectively)
enables us to calculate ranges for the increase in annual interest payments on public debt due
to climate-induced sovereign downgrades. Table 4 reports these costs for the G7 plus China
under RCP 2.6 scenario by 2100. Columns 2-3 present climate-induced sovereign downgrades
(in notches) and total outstanding sovereign debt as of 2019. Columns 4-5 report lower and
upper bound estimates of the additional cost of sovereign debt due to climate downgrades.
Climate-induced sovereign downgrades could increase the cost of sovereign debt across our
sample by US$ 22.47 billion to US$ 34.11 billion under RCP 2.6. These costs are more than 6
times larger under RCP 8.5, with a lower-bound of US$ 136.68 billion and an upper-bound of
US$ 205.02 billion (see Table 5).
20Table 4. Additional cost of sovereign borrowing due to climate-induced sovereign
downgrades (RCP 2.6, 2100)
Cost of Cost of
sovereign sovereign
Sovereign Outstanding borrowing ($ borrowing ($
downgrade sovereign debt bn) (lower bn) (upper
Sovereign (notches) ($ bn) bound) bound)
Canada 0.58 557.10 0.26 0.39
China 2.05 2464.40 4.04 6.06
France 0.83 2026.10 1.35 2.02
Germany 0.23 1254.30 0.23 0.35
Japan 0.36 10396.20 2.99 4.49
United Kingdom 0.92 2710.70 2.00 2.99
United States 0.55 16673.40 7.34 11.00
G7 + China 0.79 36082.20 18.18 27.27
Full sample total 0.65 42716.80 22.74 34.11
Notes: Translating climate-induced sovereign downgrades into increased sovereign cost of borrowing by 2100
under RCP 2.6 scenario for G7 plus China. Italy is not downgraded under this scenario. Full sample results for 55
downgraded sovereigns available in Appendix D, Table D.1. Outstanding sovereign debt figures for 2019 obtained
from S&P SRIs. Conversion between sovereign downgrades into yields for lower bound is based on Afonso et al.
(2012) and for upper bound on Gande & Parsley (2005), whereby 1 notch sovereign downgrade increases
sovereign bond spread by 0.08% and 0.12% respectively.
Table 5. Additional cost of sovereign borrowing due to climate-induced sovereign
downgrades (RCP 8.5, 2100)
Cost of Cost of
Sovereign Outstanding sovereign sovereign
Sovereign downgrade sovereign debt borrowing ($ borrowing ($
(notches) ($ bn) bn) (lower bn) (upper
bound) bound)
Canada 5.15 557.10 2.30 3.44
China 6.55 2464.40 12.91 19.37
France 2.43 2026.10 3.94 5.91
Germany 3.65 1254.30 3.66 5.49
Italy 0.30 2225.30 0.53 0.80
Japan 2.39 10396.20 19.88 29.82
United Kingdom 3.48 2710.70 7.55 11.32
United States 4.74 16673.40 63.23 94.84
G7 + China 3.59 38307.50 113.93 170.89
Full sample total 2.48 47326.70 136.68 205.02
Notes: Translating climate-induced sovereign downgrades into increased sovereign cost of borrowing by 2100
under RCP 8.5 scenario for G7 plus China. Full sample results for 80 downgraded sovereigns available in
Appendix D, Table D.2. Outstanding sovereign debt figures for 2019 obtained from S&P SRIs. Conversion
between sovereign downgrades into yields for lower bound is based on Afonso et al. (2012) and for upper bound
21on Gande & Parsley (2005), whereby 1 notch sovereign downgrade increases sovereign bond spread by 0.08%
and 0.12% respectively.
Translating sovereign rating changes into impacts on corporate cost of capital is more
challenging, as no such direct translation exists in the literature. However, Almeida et al (2017)
quantify a sovereign spillover effect from sovereign to corporate ratings, whereby a one
percentage point increase in sovereign yields increases corporate yields by a factor of 0.6-0.7.
We follow three-step procedure to calculate the effect of climate-induced sovereign ratings on
the cost of corporate capital (see Tables 6 and 7 for RCP 2.6 and 8.5 respectively). 13 First, we
translate sovereign downgrades into sovereign yield spreads as described above and reported
in Tables 4-5. Second, we multiply these values (0.08% versus 0.12%) by the magnitude of the
spillover effect from sovereign to corporate yields identified in Almeida et al (2017), treating
0.6 (0.7) as the lower (upper) bound. 14 Finally, we calculate the resulting costs of outstanding
corporate debt in all countries in which we have data. Using data from the Bank of International
Settlements (BIS), Table 6, column 3 reports outstanding corporate debt in US$ billion for the
G7 + China as of June 2020. The availability of BIS data on corporate debt restricts our
calculations to a sub-sample of 28 (34) countries under RCP 2.6 (8.5).
Lower- and upper-bound estimates of increases in the cost of corporate debt due to climate-
induced sovereign downgrades are reported in columns 4-5. Under RCP 2.6, the lower (upper)
bound estimates of the additional annual interest payments due to spillover of sovereign
downgrades onto corporations will reach US$ 7.21 (12.62) billion by 2100 across all 28
sovereigns for which BIS data is available. It is worth noting that this is the indirect effect of
increased sovereign credit risk induced by climate change and passed onto corporates. These
costs can be considered in addition to the direct effects of climate change on corporates (e.g.
physical, transition, and litigation losses). The magnitude of the sovereign downgrades
increases corporate interest outlays significantly (almost 5 times) under the RCP 8.5 scenario
and exceeds 35.76 (62.59) $ billion for lower (upper) bound, respectively.
13
As before in these tables we report G7 countries plus China but results for the full sample are available in
Appendix D, Tables D.1.-D.4.
14
Authors estimate the effect around the investment versus speculative grade threshold. These results are for
illustrative purposes only and should be considered with caution. We realise taking this measure and applying it
to all corporate debt held by a sovereign is conservative since not all firms will be rated around that threshold.
22Table 6. Additional cost of corporate debt due to climate-induced sovereign downgrades
(RCP 2.6, 2100)
Sovereign Outstanding Increase in cost Increase in cost
downgrade corporate debt of debt ($ bn) of debt ($ bn)
Sovereign (notches) ($ bn) lower bound upper bound
Canada 0.58 515 0.14 0.25
China 2.05 4061 4.00 6.99
France 0.83 777 0.31 0.54
Germany 0.23 241 0.03 0.05
Japan 0.36 845 0.15 0.26
United Kingdom 0.92 564 0.25 0.44
United States 0.55 7126 1.88 3.29
G7 + China 0.79 14129 5.35 9.36
Total BIS 0.73 15356 7.21 12.62
Notes: Translating climate-induced sovereign downgrades into increased corporate cost of debt by 2100 under RCP 2.6
scenario. G7 plus China results presented here. Italy is not presented as it is not downgraded under this scenario. Data
availability from BIS on corporate debt restricts our sample to 28 countries. Sub-sample results for the remaining 21
sovereigns calculated using BIS database available in Appendix D, Table D.3. To calculate the value of corporate debt
affected by sovereign downgrades we first convert the sovereign rating changes into sovereign yield which we then
convert into corporate sovereign yield. To translate sovereign ratings into yields we use lower bond (0.08%) from
Afonso et al. (2012) and higher bound (0.12%) from Gande & Parsley (2005). To then convert these into corporate
spreads we use Almeida et al. (2017)’ conversions, with 0.6 for lower bound and 0.7 for higher bound. We multiply
sovereign rating changes (see column 2) by an amount of outstanding debt at end-June 2020 (column 3) and 0.00048
for a lower bound (0.08%*0.6) and 0.00084 (0.12%*0.7) for a upper bound respectively.
Table 7. Additional cost of corporate debt due to climate-induced sovereign downgrades
(RCP 8.5, 2100)
Sovereign Outstanding Increase in cost Increase in cost
downgrade corporate debt of debt ($ bn) of debt ($ bn)
Sovereign (notches) ($ bn) lower bound higher bound
Canada 5.15 515 1.27 2.23
China 6.55 4061 12.77 22.34
France 2.43 777 0.91 1.59
Germany 3.65 241 0.42 0.74
Italy 0.3 152 0.02 0.04
Japan 2.39 845 0.97 1.70
United Kingdom 3.48 564 0.94 1.65
United States 4.74 7126 16.21 28.37
G7 + China 3.16 10220 20.75 36.31
Total BIS 3.28 15561 35.76 62.59
Notes: Translating climate-induced sovereign downgrades into increased corporate cost of debt by 2100 under
RCP 8.5 scenario. G7 plus China results presented here. Data availability from BIS on corporate debt restricts our
sample to 34 countries. Sub-sample results for the remaining 26 sovereigns calculated using BIS database
available in Appendix D, Table D.4. To calculate the value of corporate debt affected by sovereign downgrades
we first convert the sovereign rating changes into sovereign yield which we then convert into corporate sovereign
yield. To translate sovereign ratings into yields we use lower bond (0.08%) from Afonso et al. (2012) and higher
bound (0.12%) from Gande & Parsley (2005). To then convert these into corporate spreads we use Almeida et al.
(2017)’ conversions, with 0.6 for lower bound and 0.7 for higher bound. We multiply sovereign rating changes
(see column 2) by an amount of outstanding debt at end-June 2020 (column 3) and 0.00048 for a lower bound
(0.08%*0.6) and 0.00084 (0.12%*0.7) for a higher bound respectively.
23The above calculations show that impacts of climate-induced sovereign downgrades on debt
servicing costs are large in magnitude for both sovereigns and corporates. With maturities of
debt products extending 15 and meaningful economic implications of climate change drawing
nearer, investors will progressively need more reliable credit opinions beyond the relatively
short-term 5-10 years horizon 16 offered by CRAs today. This research has set the foundations
for such a longer-term view. Based on the methodology applied here, future research could
focus on the development of ultra-long ratings that investors could consider when assessing
long-dated sovereign credit exposures. Currently CRAs apply the same “long-term” rating to a
2-year bond as they do to a 50-year or century-bond. This equalisation of risk is clearly
implausible. A transparent and scientifically grounded truly long-term rating will help support
better investment decisions today, expose stranded assets earlier and create incentives for
public policies and investments that contribute to containing and mitigating climate change.
Such an instrument would therefore promote the global public good of climate protection and
diminish the market failure that has created the climate crisis in the first place. Truly long-term
credit views can help make climate risks visible within mainstream financial indicators, thus
supporting investors to take decisions that are environmentally and financially sustainable for
the long haul. 17,18
Our research has strong policy implications for CRAs’ regulators including ESMA and SEC.
Significant changes due to climate change and aging societies are inevitable and sovereign
credit ratings are not designed to reflect those ultra-long-term risks. Additionally, the “up to
ten-year” horizon that CRAs pursue is not credible. Credit reports on sovereigns will include
forecasts that typically only reach three years into the future, at most, and exceptionally to five.
Regulators could therefore insist that CRAs document how they fulfil their current claim of a
5 to 10-year time horizon. In a second step regulators should require CRAs to demonstrate how
15
For instance, governments issue ever-longer dated bonds as long as 100 years (e.g., Argentina, Austria, Belgium,
Ireland).
16
CRAs issue what they refer to as “long-term” ratings but the time horizon extends to no more than 5-10 years,
which is a fraction of the length of some of the bonds now being sold, and a relatively short period compared to
the process of climate change.
17
This will alleviate concerns raised by many in relation to climate service providers who “operate outside of the
bounds of scientific merit” (Keenan 2019) and misuse climate models (Nissan et al., 2019).
18
One important concern is whether predicting climate-induced downgrades in the future may increase the cost
of debt today. This is particularly concerning for low-income countries where evidence suggests that climate-
related natural disasters are already hitting bond yields (Beirne et al., 2020; Buhr et al., 2018; Kling et al., 2018).
If investors believed that e.g., India is not a climate-safe investment, the perverse result could be to starve India
of the access to capital it needs to increase resilience.
24You can also read