RIU Explorers Conference 2022 - High-grade Bellevue Gold Project in WA fully funded to first production - Loom.ly
←
→
Page content transcription
If your browser does not render page correctly, please read the page content below
RIU Explorers Conference 2022
High-grade Bellevue Gold Project in WA fully funded to first production

Disclaimers & Compliance Statements
This Presentation has been prepared by Bellevue Gold Limited (Company) and is authorised by the Managing Director of Bellevue Gold Limited.

DISCLAIMER
This Presentation has been prepared by the Company based on information from its own and third party sources and is not a disclosure document. No party other than the Company has authorised or caused the issue, lodgement, submission, despatch or provision of this
Presentation, or takes any responsibility for, or makes or purports to make any statements, representations or undertakings in this Presentation. Except for any liability that cannot be excluded by law, the Company and its related bodies corporate, directors, employees, servants,
advisers and agents disclaim and accept no responsibility or liability for any expenses, losses, damages or costs incurred by you relating in any way to this Presentation including, without limitation, the information contained in or provided in connection with it, any errors or
omissions from it however caused, lack of accuracy, completeness, currency or reliability or you or any other person placing any reliance on this Presentation, its accuracy, completeness, currency or reliability. Information in this Presentation which is attributed to a third-party
source has not been checked or verified by the Company. This Presentation is not a prospectus, disclosure document or other offering document under Australian law or under any other law. It is provided for information purposes and is not an invitation nor offer of shares or
recommendation for subscription, purchase or sale in any jurisdiction. This Presentation does not purport to contain all the information that a prospective investor may require in connection with any potential investment in the Company. It should be read in conjunction with,
and full review made of the Company’s disclosures and releases lodged with the Australian Securities Exchange (ASX) and available at www.asx.com.au. Each recipient must make its own independent assessment of the Company before acquiring any shares in the Company.

NOT INVESTMENT ADVICE
This Presentation does not provide investment advice or financial product advice. Each recipient of the Presentation should make its own enquiries and investigations regarding all information in this Presentation including but not limited to the assumptions, uncertainties and
contingencies which may affect future operations of the Company and the impact that different future outcomes might have on the Company. Information in this Presentation is not intended to be relied upon as advice to investors or potential investors and has been prepared
without taking account of any person’s individual investment objectives, financial situation or particular needs. Before making an investment decision, prospective investors should consider the appropriateness of the information having regard to their own investment
objectives, financial situation and needs and seek legal, accounting and taxation advice appropriate to their jurisdiction. The Company is not licensed to provide financial product advice in respect of its securities.

INVESTMENT RISK
There are a number of risks specific to the Company and of a general nature which may affect the future operating and financial performance of the Company and the value of an investment in the Company, including and not limited to the Company's capital requirements, the
potential for shareholders to be diluted, risks associated with the reporting of resources and reserves estimates, budget risks, underwriting risk, risks associated with the COVID-19 pandemic and operational risk. An investment in Shares is subject to known and unknown risks,
some of which are beyond the control of the Company. The Company does not guarantee any particular rate of return or the performance of the Company. Investors should have regard to the risk factors outlined in the Company’s FS2 presentation announced to the ASX on
2 September 2021 under the section titled “Risks” when making any investment decision.

FORWARD LOOKING INFORMATION
This Presentation contains forward-looking statements. Wherever possible, words such as “intends”, “expects”, “scheduled”, “estimates”, “anticipates”, “believes”, and similar expressions or statements that certain actions, events or results “may”, “could”, “would”, “might” or
“will” be taken, occur or be achieved, have been used to identify these forward-looking statements. Although the forward-looking statements contained in this Presentation reflect management’s current beliefs based upon information currently available to management and
based upon what management believes to be reasonable assumptions, the Company cannot be certain that actual results will be consistent with these forward-looking statements. A number of factors could cause events and achievements to differ materially from the results
expressed or implied in the forward-looking statements. These factors should be considered carefully and prospective investors should not place undue reliance on the forward-looking statements. Forward-looking statements necessarily involve significant known and unknown
risks, assumptions and uncertainties that may cause the Company's actual results, events, prospects and opportunities to differ materially from those expressed or implied by such forward-looking statements. Although the Company has attempted to identify important risks and
factors that could cause actual actions, events or results to differ materially from those described in forward-looking statements, there may be other factors and risks that cause actions, events or results not to be anticipated, estimated or intended, including those risk factors
discussed in the Company’s public filings. There can be no assurance that the forward-looking statements will prove to be accurate, as actual results and future events could differ materially from those anticipated in such statements. Accordingly, prospective investors should not
place undue reliance on forward-looking statements. Any forward-looking statements are made as of the date of this Presentation, and the Company assumes no obligation to update or revise them to reflect new events or circumstances, unless otherwise required by law. This
Presentation may contain certain forward-looking statements and projections regarding:
•   estimated resources and reserves;
•   planned production and operating costs profiles;
•   planned capital requirements; and
•   planned strategies and corporate objectives.
The Company does not make any representations and provides no warranties concerning the accuracy of the projections, and disclaims any obligation to update or revise any forward looking statements/projects based on new information, future events or otherwise except to
the extent required by applicable laws

                                                                                                                                                                                                                                                                                       2
Disclaimers & Compliance Statements
JORC COMPLIANCE STATEMENTS
It is a requirement of the ASX Listing Rules that the reporting of ore reserves and mineral resources in Australia comply with the Joint Ore Reserves Committee’s Australasian Code for Reporting of Mineral Resources and Ore Reserves ("JORC Code"). Investors outside Australia
should note that while ore reserve and mineral resource estimates of the Company in this document comply with the JORC Code (such JORC Code-compliant ore reserves and mineral resources being "Ore Reserves" and "Mineral Resources" respectively), they may not comply
with the relevant guidelines in other countries and, in particular, do not comply with (i) National Instrument 43-101 (Standards of Disclosure for Mineral Projects) of the Canadian Securities Administrators (the "Canadian NI 43-101 Standards"); or (ii) Industry Guide 7, which
governs disclosures of mineral reserves in registration statements filed with the SEC. Information contained in this document describing mineral deposits may not be comparable to similar information made public by companies subject to the reporting and disclosure
requirements of Canadian or US securities laws. In particular, Industry Guide 7 does not recognise classifications other than proven and probable reserves and, as a result, the SEC generally does not permit mining companies to disclose their mineral resources in SEC filings. You
should not assume that quantities reported as “resources” will be converted to reserves under the JORC Code or any other reporting regime or that the Company will be able to legally and economically extract them.

This Presentation contains references to Mineral Resource and Ore Reserves estimates, which have been extracted from the Company’s ASX announcements on 8 July 2021 titled “Bellevue Increases Total Resources to 3.0Moz at 9.9g/t” and on 2 September 2021 titled “Feasibility
Study 2 - Fully Funded to Production”. See page 51 for a summary of the Project’s Mineral Resources and Ore Reserves. This Presentation also contains references to Exploration Results which have been extracted from various ASX announcements dated as indicated throughout
this Presentation. For full details of previously announced metallurgical test results, refer ASX announcements on 24 June 2020 titled “Metallurgical Tests Return Exceptionally High Recoveries”. The Company notes that these metallurgical results have been updated to correct an
immaterial calculation error. While the overall gravity recoveries are still high and there are no material changes in the metallurgical testwork results as the testwork hardness, final tails residue and reagent consumptions remain unchanged) and on 15 April 2021 titled “Global
Resource increases to 2.7Moz at 9.9g/t”.

The Company confirms that it is not aware of any new information or data that materially affects the information included in the said announcements, and in the case of estimates of Mineral Resources and Ore Reserves, that all material assumptions and technical parameters
underpinning the estimates in the relevant market announcements continue to apply and have not materially changed. The Company confirms that the form and context in which the Competent Persons’ findings are presented have not materially modified from the original
market announcements. The Company first reported the production targets and forecast financial information derived from its production targets in accordance with Listing Rules 5.16 and 5.17 in its ASX announcement on 2 September 2021. The Company confirms that all
material assumptions underpinning the production targets and the forecast financial information derived from the production targets continue to apply and have not materially changed.

FINANCIAL DATA
All dollar values are in Australian dollars (A$ or AUD) unless otherwise stated. The information contained in this Presentation may not necessarily be in statutory format. Amounts, totals and change percentages are calculated on whole numbers and not the rounded amounts
presented. The pro forma historical financial information provided in this Presentation is for illustrative purposes only and is not represented as being indicative of the Company’s views on its future financial condition and/or performance. The pro forma historical financial
information has been prepared by the Company in accordance with the measurement and recognition requirements, but not the disclosure requirements, of applicable accounting standards and other mandatory reporting requirements in Australia.

                                                                                                                                                                                                                                                                                    3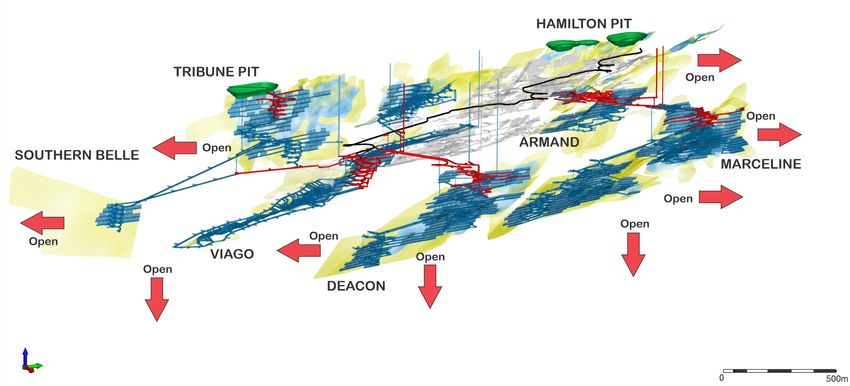
Investment Highlights
 The recently completed funding solution now see BGL fully funded into production with total liquidity of $373m to fund the
 $254m capex from FS2 and a budget of $21m-$26m for further exploration over the coming 18 months

           One of the highest-grade, lowest cost mines in Australia with the first 5 years expected to produce over 200kozpa and a life of mine production
           of 183kozpa for over 8 years, 1Moz Reserve with grade of 6.1g/t and an All In Sustaining Cost of A$1,014/oz

           Expected to deliver sector leading EBITDA margins of 66% and A$1.8b of pre-tax free cash flow1 and will be one of only 8 assets in Tier 1
           jurisdictions that produce over 180kozpa at a head grade over 5g/t gold

           Significant upside potential with multiple drill rigs turning, low delivery costs of A$18 per Resource oz and a Resource that is growing at a
           Compound Annual Growth Rate (CAGR) of 81%; one of the fastest growing gold developments globally in a Tier 1 mining jurisdiction with a
           future focus of converting the other 1.5Moz (50% of total Resources) that sit outside the current 1.5Moz life of mine

            Committed to sustainable mining practices and forecast to be the lowest GHG emitting gold mine on a per ounce basis in Australia, with a
            vision to be one of Australia’s best-in-class ‘Green and Gold’ miners generating A$2.3b of economic value

           Significantly de-risked with over 4,060m of underground development already completed, 5 independent mining areas by first production and
           over 464,000m of diamond drilling completed at the project and with simple metallurgy

           Fully funded to production with total liquidity of $373m to fund the dual track strategy of project development and exploration with $254m
           capex from the updated FS2 study and $21m-$26m budgeted for exploration

The production targets in this Presentation are underpinned by approximately 29.8% Inferred Mineral Resources. There is a low level of geological confidence
associated with Inferred Mineral Resources and there is no certainty that further exploration work will result in the determination of Indicated Mineral
Resources or that the production target itself will be realised.
                        1. Assuming a A$2,400/oz gold price                                                                                                  4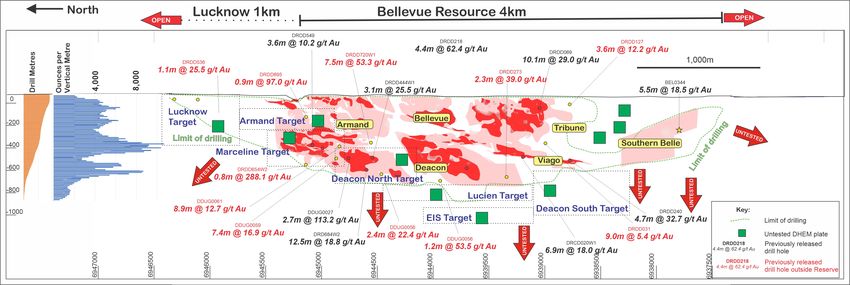
The BGL Value Proposition: Exploiting Our Competitive
       Advantages
         One of Australia’s highest-grade gold mines, with exciting exploration potential and an accelerated development
         timeline that is fully funded to production: “Real People, Real Profits, Real Growth”

                                                                      3.0Moz                          2.4 MozFCF
                                                                                                      A$1.8b  +
                                                                     10.0g/t
                                                                     at 9.9g/t                         72% IRR

VALUE ACCRETION FROM                     GROWTH                     GRADE & SCALE                    PROFITABILITY               STRATEGIC ESG FOCUS
  CONSTRUCTION TO                 Only 50% of the 3Moz BGL        One of the highest-grade,       The project is forecast to       Forecast to be the lowest
    PRODUCTION                     Resource sits within the     lowest cost mines with an All   deliver sector leading EBITDA     GHG emitter per ounce on
                                  1.5Moz mine plan. Further         in Sustaining Cost of        Margins of 66% and A$1.8b        the ASX with a vision to be
    Comparable single asset
                                     upside potential from       A$1,014/oz; and one of the        of free cashflow pre-tax        one of Australia’s best-in-
    development companies
                                    conversion drilling, low        fastest growing gold        (assuming a A$2,400/oz gold         class ‘Green and Gold’
 experienced on average share
                                  discovery costs of A$18/oz     developments globally in a      price) over the initial 8.1yr   miners and well insulated for
  price appreciation of +163%
                                                                  Tier 1 mining jurisdiction                                         any future carbon tax
between announcing the start of and a resource that has grown                                              mine life
                                       at a CAGR of 81%                                                                                    legislation
   construction and reaching
commercial production (Slide 7)

                                                                                                                                                                 5
BGL joining an exclusive gold club
• There are only 7 other assets globally in Tier 1 jurisdictions that produce over 180kozpa with a head grade over 5g/t
• FS2 will see the project produce over 200kozpa for the first 5 years and a LOM average of 183kozpa for 8.1 years
• Further Resource conversion and Resource growth will also see the potential for the project to continue to grow the
  production and mine life as only 50% of the 3Moz Resource currently sits within the mine plan
                                   800
                                                    Gold Deposits in Tier 1 jurisdictions greater than 180kozpa production, over 5g/t head grade
                                                                                                                                                                                                                                         10g/t
                                   700                                                                            In the last 6 months 5 of the 7 assets have been involved in
                                                                                                                  mergers leaving the Bellevue project as the only project with
                                                                                                                                                                                                                                   Size of bubble denotes
                                   600                                                                                 these characteristics not owned by a global major                                                          CY2020 head grade (g/t)
                                                                                                  Fosterville
                                                                                                   Agnico
         CY2020 Production (Koz)

                                   500                                                                                                                                Tanami
                                                                                                                                                                     Newmont

                                   400
                                                                                                                                                                                                            Brucejack
                                                                                                                                                                           Meliadine                        Newcrest
                                   300                                                                               LaRonde                                                Agnico
                                                                                                                      Agnico                   FS2
                                                                                                                                             Bellevue
                                                                                                                                                                                                                  Agnew/Lawlers
                                   200
                                                                                                                                                                                                                    Gold Fields

                                                                                              21% increase in production in 6 months                                      FS1
                                   100                                                                                                                                  Bellevue                    Macassa
                                                                                                                                                                                                    Agnico
                                                                                                                                             6% decrease in AISC to A$1,014/oz
                                    0
                                         0              200                     400                     600                     800                     1,000                   1,200                   1,400                   1,600

                                                                                         CY2020 All-in Sustaining Costs (AISC) (A$/oz)

                                             Source: Bellevue Gold Project Stage 1 & 2 Feasibility Studies (LOM metrics shown), SNL, Company Filings. AISC for Agnico Eagle Mines shows ‘Total Cash Cost’ given AISC not disclosed.
                                             Companies shown based on SNL screen with CY2020 production >180koz, CY2020 head grade >5g/t and located in Tier 1 Frazer Institute rated jurisdictions of Australia, Canada or USA                         6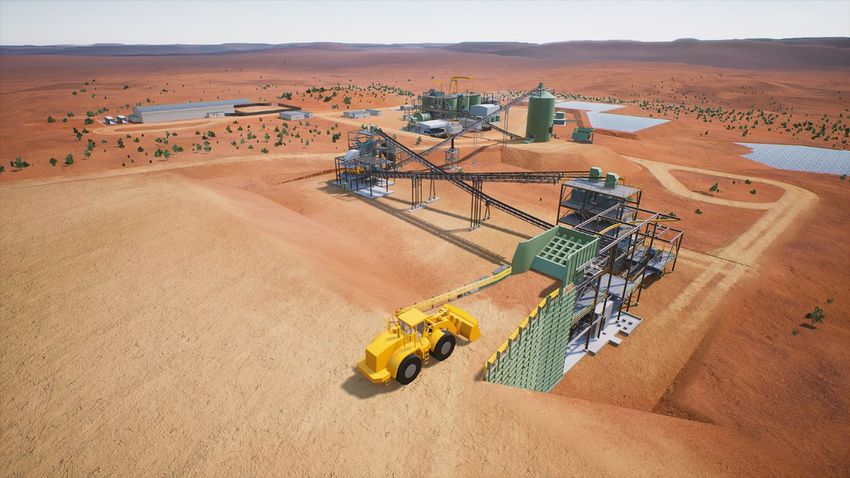
BGL on the cusp- Share Price Performance During Construction
• Post the announcement of construction development, the selected comparable companies experienced a significant re-
  rate or an average increase of 163% over this period
• With the commencement of the camp construction this puts BGL on the construction period timeline
                                                              Share Price Performance of Selected Comparable Single Asset Development Companies During Construction            West African Resources
                                                     350                                                                                                                        Declares Commercial
                                                                                                                                                                               Production (June 2020)
     Indexed Relative Share Price Performance (%)

                                                     300
                                                             The commencement of the                                                                                        Roxgold Declares Commercial
                                                     250     330 man camp puts BGL on                                                                                        Production (October 2016)
                                                             the pathway to production
                                                     200
                                                                                                                                                                                Atlantic Gold Declares
                                                                                                                                                                               Commercial Production
                                                     150                                                                                                                            (March 2018)

                                                     100                                                                                                                    Capricorn Declares Commercial
                                                                                                                                                                             Production (September 2021)
                                                      50

                                                      0.0
                                                                                                                                                                            Pretium Declares Commercial
                                                                                                                                                                               Production (July 2017)
                                                    (50.0)                                       Construction Period (average 18 Months)
                                                                   Capricorn Metals    Pretium           Roxgold         West African Resources   Atlantic Gold   Average

     Single asset development companies experienced on average +163% share price appreciation between announcing construction and reaching commercial production

   Source: Company Filings, Bloomberg. Notes: See slide 52 for backing data

                                                                                                                                                                                                            7
Board and management – a proven team of mine builders
Kevin Tomlinson Steve Parsons Fiona Robertson Shannon Coates Michael Naylor
Non- Executive Independent Managing Director Non-Executive Independent Non-Executive Independent Chief Financial Officer and
Chairman Director Director Executive Director
.
Investment Banking Geologist Finance Lawyer
25yrs experience Chartered Accountant
35yrs experience 40yrs experience 25yrs experience in corporate law
Founder Gryphon Minerals 24yrs experience across corporate
Previously Centamin Plc, Orbis Gold, Previously Chase Manhattan and and compliance across publicly listed
discovered 3 million oz Banfora advisory and public company
and Cardinal Resources prior Chief Financial Officer of Delta companies and Chartered Secretary.
(Wahgnion) gold Project, that management
Chair of Health, Safety and Gold. Current Co-Sec at Mincor Resources
was acquired by Endeavour Senior roles with Resolute Mining,
Sustainability Committee and a Chair of Audit & Risk Management (MCR)
Mining Dragon Mining and Gryphon Minerals
member of the Nomination and Committee and a member of the Chair of Nomination and
Remuneration Committee and Audit & Member of the Health, Safety Nomination and Remuneration Remuneration Committee and a
Risk Management Committee and Sustainability Committee Committee and Health, Safety and member of the Audit & Risk
Sustainability Committee Management Committee
Darren Stralow Rod Jacobs Bill Stirling Amber Stanton Sam Brooks Luke Gleeson Daina Del Borrello
Chief Executive Project Director General Manager General Counsel and Chief Geologist Corporate Development GM People and
Officer Bellevue Project Joint Co-Sec & Chief Sustainability Company Culture
Mining Engineer Mining Engineer Mining Engineer Corporate lawyer Geologist
Officer 18yrs experience working in
20yrs experience 30yrs experience 15yrs experience 20yrs experience 20yrs experience Finance & Mineral Economics mining related HR Roles
Previous role of Chief Previous roles included Previously Northern Star Previously General Led the discovery of the 3 20yrs of experience in equity Supported CITIC Pacific and a
Development Officer and GM optimising the Nova Nickel Resources (NST) GM Jundee, Counsel/Company Secretary million oz Bellevue Gold markets and Sustainability lithium miner from
of Operations at Northern project for Independence GM Kalgoorlie Operations, at Resolute Mining (RSG) project. Raised over $1.3B in the last development to pre-
Star Resources (NST) Group (IGO) and bringing and GM of Bronzewing Prior was a partner at Other discoveries include 4yrs at Bellevue and at production
Led integration of NST’s the Deflector gold-copper Specialising in operational international legal firms the 3 million oz Banfora Northern Star Resources.
Australian business units project into production productivity and contract specialising in M&A and (Wahgnion) gold Project.
negotiations. capital markets
8
Exploration development strategy delivering outperformance
 • BGL’s outperformance has been delivered by exploration growth and also by expanding the mining inventory
 • This process is set to continue in 2022 with further growth and optimisation studies occurring
             4. BGL outperformance vs GDXJ index                                                                                                         1. Resource/Reserve Growth (koz) †
                  BGL outperforming GDXJ by
                                                                                                                                                                                                   3,000 koz
               2,758% over the last 5 yrs through
                     exploration success                                                                                                                                       2,410 koz          1,040 koz
       .                                                                             2,758%                                                                                    690 koz

                                                                                                                                                                   1,040 koz

                                                                                                                                                                               1,800 koz          1,960 koz
                                                                                                                                                     500 koz

2017          2018              2019              2020                2021                                                                           Maiden        Q4 2018     Q1 2021           Current R&R
 Increase in value                                                                                                                                  Resource                                      Increased Resources
creates share price           BGL AU Equity         GDXJ US Equity
                                                                                                                                                           Resources (koz)         Reserves (koz)    convert to Ore
  outperformance                                                                                                                                                                                         Tonnes
           3. Net free cash flow from Feasibility Studies                                                                                                      2. Ore Tonnes Mined          8.1Mt
                                                                 1.78B                                                                                45% increase in
               65% increase in
                just 6 months                                                                                                                          just 6 months
                                                                                                                                                           5.6Mt

                                                                                                                                   Million Tonnes
                      1.08B                                      FS2                                                                                                                       FS2

                       FS1                                                                                                                               FS1

                                                                                                                                                                                                                  9
                         † Resources are reported inclusive of Reserves. Refer to page 50 for the current breakdown of Inferred and Indicated Resources.
A deposit that continues to grow in every direction
• Since the Tribune discovery hole in November 2017, the Resource has grown at a compound annual growth rate of 81%
• The recent Lucknow discovery extends the strike to over 5km and the Lucien discovery sits 300m beneath the Deacon lode;
  and the deposit remains open in every direction

                     Source: Refer to ASX announcements dated 22 August 2016, 22 March 2018, 22 October 2018, 21 May 2019, 10 September 2019, 19 November 2019, 17 December 2019, 7 July 2020, 8 October
                             2020, 18 February 2021, 23 June 2021, 3 August 2021 and 15 February 2022 for full details of previous exploration results.
                                                                                                                                                                                                           10
Further growth potential- Mining Shape Optimiser shapes
NOT currently in mine plan
• Of the 3Moz Global Resource only 50% of the Resource is in the current 1.5Moz mine plan
• The areas in red highlight the immediate conversion potential based on the same economics from the Stage 2 Feasibility Study
that are forecast to be converted into the mine plan with further infill drilling to convert to the Indicated category
• The entire system remains open in every direction and exploration drilling will continue on the pathway to production
North
Source: Refer to ASX announcements dated 21 September 2021
11Bellevue Gold project Feb 2022 Fly-through click here
12Optimising FS2 – Further enhancing the project economics
Key de-risking events achieved on the project, focus shifted to optimisation and further de-risking, productivity and
cost benefits
Study
FS2 Optimisation Outcome Potential Benefit
Parameters
Less up-front development
MINING De-risks ramp-up, improves
Bottom Up Top Down Simplified top-down retreat mining
SEQUENCE project economics (cost)
= Immediate access to stoping
Removal of major cost driver
BACKFILL Cemented De-risks ramp-up, improves
No Fill Removal of step in sequence
(Year 1 & 2) Rock Fill project economics (cost)
= Vastly improved productivity
Larger & more efficient loader in ore De-risks ramp-up, improves
4.5mH x 4.5mH x
ORE DRIVES Standardised fleet project economics
4.2mW 4.5mW
= Vastly improved productivity (productivity)
Larger drill, Improved accuracy
De-risks ramp-up, improves
LEVEL SPACING 10m 15-20m Less levels required same ore
project economics (cost)
= less metres per stope tonne
Vastly improved success rate De-risks ramp-up, improves
Longhole Mechanical
STOPE SLOTS Less production drill metres required project economics
Rise boxhole
= Vastly improved productivity (productivity)
6mth ramp 12mth ramp Less reliant on up front development
ADVANCE De-risks ramp-up, improves
up to up to Ability to open further mining areas
RATES project economics (cost)
1,600m/mth 1600m/mth = Vastly improved productivity
SUB- Sequence facilitates access to
HORIZONTAL stoping De-risks ramp-up, improves
13% 0%
AREAS Ability to remove sub vertical project economics (cost)
(first 3 years) = simplified & efficient mining
13Positioned for high margin, low capital intensive growth beyond 1Mtpa
• The current 1Mtpa plant was designed for the potential for further growth above the 1mtpa nameplate capacity
• The 33% upscaling to 1Mtpa from 750ktpa nameplate capacity was achieved for a total spend of $12m
Processing Plant
• Total LOM recoveries forecasted at 96.7%
• Process plant designed to recover high gravity component at
the front end. Test work indicates between 58% and 85% is
recoverable through gravity recovery methods.
• Cyanide destruction circuit designed and costed to meet
Global Tailings Standards
• Designed for 1.0Mtpa – opportunity to increase throughput as
design has allowed for readily expandable growth
• Simple process flow sheet:
o 3 stage crushing
o Single ball mill grinding, p80 @ 75um
o Gravity separation and intensive leaching
o Thicken prior to leaching with standard CIL processes
o Thicken final tail with cyanide detoxification
o Transfer to TSF (which has been located away from lake)
o Recover water from TS
Plant Upgrade designed for future growth
• A$12m expansion to 1Mtpa from 750ktpa
• Possible future expansion above 1Mtpa planned for in
infrastructure design layout
14A consistent delivery of the project since July 2020
• The company is continually delivering into the dual track development and exploration strategy by adding value
through growth in the Resource and an upgraded study that has increased the value of the project by $701m in 6mths
• Current development timetable with targeted first gold production June Q 20231
2020 2021 2022 2023
Qtr 3 Qtr 4 Qtr 1 Qtr 2 Qtr 3 Qtr 4 Qtr 1 Qtr 2 Qtr 3 Qtr 4 Qtr 1 Qtr 2 Qtr 3
Existing Decline Rehabilitation
Development
Underground Exploration Access
Project
Approvals and Permitting Upcoming catalysts
Early Works Infrastructure • Reserve upgrade
• Preferred Power provider
Feasibility Studies FS1 and FS2 • Preferred EPC Mill build
• Preferred Mining contractor
Resource
Growth
Resource Drilling
Updated Reserve/Resource
Financing, Documentation and (First Draw down)
FEED, Tendering & Detailed Design
Construction
Mill Delivery
Stage 2 Underground Development
Mill Construction
Ramp Up & Commissioning
1 This timetable is indicative only and may change. Please refer to key risks that may cause changes to the timetable.
15BGL - Forecast to be Australia’s lowest greenhouse gas emitter/oz
• Bellevue is forecast to become the lowest emitter on a per ounce basis in Australia; the Stage 2 Feasibility Study shows a
forecasted greenhouse gas intensity of 0.202 t CO2e / oz. This has improved by ~30% due to the planned integration of
renewable energy and the increased plant throughput to 1 Mtpa
• Bellevue is forecast to have the least total Scope 1 emissions of any major off-grid gold mine in Australia and to have one
of the cleanest power supplies for any gold mine in Australia
• For the same carbon emissions, Bellevue is forecast to produce 3.6 ounces compared to 1 ounce for the average Australian gold mine
1.6
Greenhouse Gas Intensity (CO2e/oz) for major Australian gold mines Costerfield
1.4 Mt Rawdon
KCGM
Bellevue’s GHG Intensity is forecast Ravenswood
1.2 Boddington
Telfer
GHG Intensity (t CO2e / oz Au)
to be 0.202 t CO2e / oz over the LOM Matilda-Wiluna Cadia Valley
1
Tomingley
Cowal
S&P Global estimated the 2020 emissions intensity for
Mt Morgans
0.8 Peak
Australian gold mines to be 0.73 t CO2e / oz
Darlot Cracow
0.6
Bellevue (FS2)
Gruyere
Mt Carlton
Kalgoorlie
Paddington
Plutonic
Westgold
Ramelius
Sunrise Dam
Bellevue (FS1) Thunderbox
Tropicana
Duketon
Mungari
0.4
Carosue Dam
St Ives
Jundee
Agnew
Granny
Fosterville Tanami
Smith
0.2
Gwalia
0
0 1,000,000 2,000,000 3,000,000 4,000,000 5,000,000 6,000,000 7,000,000 8,000,000 9,000,000
Cumulative Gold Production per Year (oz)
Source: All data sourced from public company disclosures, with GHG emissions and annualized production averaged over the last 2-6 years of available reported data. Since the Stage 1 Feasibility Study, the
16
Bellevue Gold figures have decreased, and recent data points from other mines have been added. S&P Global issued a report on 18 August 2021 which stated the average 2020 GHG emissions
intensity in Australia to be 0.73 t CO2e / oz.Appendices Click here for the 3D Inventum model
Bellevue gold project - Fully funded to production
•   Fully funded to production with total liquidity of $373m to fund the dual track strategy of project development and exploration
    with $254m capex from the updated FS2 study and $21m-$26m budgeted for exploration
•   Macquarie was Bellevue’s first institutional investor and has elected to take the majority of upfront fees in Bellevue shares
•   Due to the forecast strong free cash flow generation, Bellevue will be in the enviable position to be able to consider capital
    allocation decisions early in the project’s mine life of; further aggressive exploration, retaining cash on balance sheet or
    distributing to shareholders

                                                                          Forecast Free Cashflow Before Tax and after Debt Repayments (A$m)
                                                                                                                                                                                            $1,853 m
                                                                                           Cumulative excess free cash for capital
                                                                                                                                                                              $1,623 m
                                                                                            allocation after all debt repayments
                                                                                                                                                                $1,364 m

                                                                                                                                                  $1,130 m

$200m Debt            Total Liquidity                    $173m Cash                                                                   $832 m
                          $373M                                                    Payback 1.4 years                    $600 m

                                                                                                          $376 m

                                                                                            $155 m

                                                                                               Y1            Y2            Y3            Y4            Y5           Y6            Y7            Y8

                     Cash Balance   Macqaurie Facility                                                             Debt Repayments including interest             Free Cash Flow
                                                                      Outcomes are based on Feasibility Study 2 results and assumes A$2,400/oz gold price as per the results from the Feasibility Study document

                                                                                                                                                                                                             18
BGL – Forecast to deliver sector-leading financial returns
• BGL’s production is forecast to commence in FY23 and set to deliver sector-leading profitability compared to its ASX
listed peer group
• BGL will be leading the peer group in EBITDA Margin and AISC margin on a per ounce basis
LTM EBITDA Margin vs BGL LOM EBITDA Margin % LTM AISC Margin vs BGL LOM AISC Margin † %
66%
58%
54% 58%
49% 49% 49%
49%
42% 41% 45% 43%
40% 38% 38% 33%
Ramelius
Silver Lake
Gold Road
St Barbara
Bellevue
Regis
Evolution
Northern Star
Ramelius
Silver Lake
Gold Road
St Barbara
Bellevue
Regis
Evolution
Northern Star
Source: Public company disclosures for 12 months ended 30 June 2021 or 31 December 2020 where FY21 full year data was not available. Bellevue EBITDA margin based on gold price of A$2,400/oz.
† AISC Margins derived from gold price of A$2,400/oz consistent with the base case assumption in the Bellevue Gold Project Stage 2 Feasibility Study.
19BGL – Forecast to become a Top 20 Australian gold mine
• The updated Stage 2 Feasibility Study shows BGL is forecast to enter the Top 20 largest producing gold mines in Australia
• 21% uplift in LOM average production compared to the Stage 1 Feasibility Study released in February 2021
• BGL is forecast to average 200koz pa of production over the first five years and 183koz pa over the LOM
698
LTM production (koz) of Australian gold mines and forecast production of developers†
592
481 478
416
390 385 Production growth of +21% in only 6 months
286 271 257 257 246 240 239 234
211
183
161 153 151 146 142 140 136
118 116 111 107 103 101
KCGM
Gwalia
Mount Monger
Boddington
Telfer
Tropicana
St Ives
Thunderbox
Kalgoorlie
Granny Smith
Cowal
Sunrise Dam
DFS 2
Fosterville
Agnew Lawlers
Carosue Dam
Bardoc Gold
Edna May
Murchison
Deflector
Jundee
Gruyere
Mt Magnet
Karlawinda
Mungari
Mt Morgans
Tanami
Duketon South
DFS 1
KOTH
Source: Public company disclosures for 12 months ended 30 June 2021. Producer Developer
Note: Companies with production below 100koz and / or a material by-product credit were removed for comparison purposes.
† Companies that have released a PFS or Feasibility study with LOM Average production used for comparison purposes.
20BGL – Forecast to enter the bottom quartile on AISC vs peers
• The Stage 2 DFS positions BGL in the bottom cost quartile with a forecast LOM All In Sustaining Cost (AISC) of A$1,014/oz
• In the first 5 years of production the project will average an AISC of A$922/oz
2,104
2,034
1,942 1,964
1,744 1,769
1,672
1,629
1,552
AISC reduced (6)% 1,453 1,483 1,496 1,507 1,513
1,415 1,420 1,436 1,437
vs Stage 1 DFS 1,368 1,385
1,278 1,290 1,304 1,311
1,221 1,229 1,230
1,165 1,174 1,188 1,195
1,079 1,094
1,014 1,042
924
473
KCGM
Mt Rawdon
Mount Monger
Gwalia
Thunderbox
Cowal
St Ives
Fortnum
Duketon North
Granny Smith
Boddington
Cue
Tropicana
Telfer
Kalgoorlie
Sunrise Dam
Fosterville
Cracow
Bardoc Gold
Deflector
Carosue Dam
Agnew Lawlers
Murchison
Jundee
Gruyere
Edna May
Mungari
Bellevue DFS 2
Bellevue DFS 1
Karlawinda
Mt Magnet
Mt Morgans
Plutonic
Tanami
Warrawoona
Duketon South
KOTH
Developer
Source: Public company disclosures for 12 months ended 30 June 2021.
† Companies that have released a PFS or Feasibility study with LOM Average AISC used for comparison purposes.
21FS2 vs FS1 – optimisation study post FS2 will add more value
Stage 2 Study delivers a significant improvement in all key project metrics, including production, life of mine, costs, free
cash flow, profit and return metrics; all without a material change in capital costs
Key LOM Production Statistics FS1 FS2 Δ Key LOM Financial Statistics FS1 FS2 Δ
Life of Mine 7.4 years 8.1 years +9% Gold price A$2,300/oz A$2,400/oz +4%
Ore tonnes mined 5.6Mt 8.1Mt +45% Free cash flow (FCF) sensitivity to
A$100m A$140m +40%
$100/oz variation in gold price
Ore processing rate 750,000tpa 1,000,000tpa +33%
Revenue A$2,551m A$3,554m +41%
Average gold production (recovered) – 160koz per 200koz per
+25%
years 1 - 5 annum annum All in sustaining costs – LOM A$1,079/oz A$1,014/oz (6%)
Average gold production (recovered) – 151koz per 183koz per Cost escalation factor (annualised) n/a 6.6% +7%
+21%
LOM annum annum
Net free cashflow (pre-tax) A$1,081m A$1,782m +65%
Recovered gold 1.1 Moz 1.5Moz +36%
Net free cashflow (post-tax) A$795m A$1,289m +62%
Pre-Production Capital Costs Average free cashflow (pre-tax) - LOM A$171m A$259m +51%
Feasibility Start Date (construction and January July EBITDA – LOM A$1,648m A$2,412m +46%
n/a
development spend) 2022 2022
Payback period (post-tax) 1.7 years 1.4 years +19%
Pre-production capital costs A$255m A$252m (1%)
NPV5% (pre-tax) A$876m A$1,311m +50%
Pre-production contingencies A$14m A$15m +7%
NPV5% (post-tax) A$562m A$943m +68%
Total capital costs (included in study) A$269m A$267m (1%)
Internal Rate of Return (pre-tax) 58% 72% +24%
Internal Rate of Return (post-tax) 35% 62% +74%
22Organic growth set to deliver further outperforma
• Since the discovery hole in November 2017, the Resource has grown at a compound annual growth rate of 81% at a
discovery cost of A$18/oz
BGL Resource Growth (koz) † BGL Resource per Share (oz/Msh) † †
.
3,000 koz
2,410 koz
1,040 koz
3,493
690 koz
2,831
2,589
1,040 koz
1,960 koz 1,254
1,800 koz
500 koz
Maiden Resource Q4 2018 Q1 2021 Current R&R Maiden Resource Q4 2018 Q1 2021 Current R&R
Resources (koz) Reserves (koz)
† Resources are reported inclusive of Reserves. Refer to page 50 for the current breakdown of Inferred and Indicated Resources.
† † Shares on issue based on pre-raising unadjusted issued capital.
23Bellevue Gold Project Fly-through Click Here
24Development & de-risking continues a rapidly growing Resource
• FS2 further de-risks the project with 5 independent mining areas accessed prior to production (Deacon, Viago, Armand,
Marceline and Tribune) with the total A$1,502m of capital and operating costs incorporated into the A$1,014/oz AISC
• Over 4,060m of development has occurred to date; the study incorporates A$12m of grade control pre-production and A$55m LOM
• The 3Moz deposit remains open in every direction and underground infrastructure will allow for further underground exploration
Combined 4,060m
development to date
Current Viago Decline Current Armand & Marceline
Location ~260m below surface Decline ~215m below surface
Additional increase in
Resources to FS1
Red Development shown prior
to first ore production
25Dual track strategy delivering Value with the FS2 study
• Bellevue’s dual track strategy of exploration and a pathway to production continues to unlock value
• In only 6 months FS2 has added A$701m, or a 65% increase in free cash flow and increased the IRR to 72% (pre-tax)
• Further exploration will continue to add value towards the pathway to production
SEEKING TO MAXIMISE VALUE AT ALL TIMES
P/NAV STOPS EV/EBITDA BEGINS
Dual track Development and
Exploration Strategy Production
Value
Feasibility Study 2
Feasibility Study 1 Construction commenced this quarter
Commissioning
Bulk of abnormal returns
are generated at the
discovery phase Resource Financing/construction
Expansion & conversion
During this period, the correlation
Slower news flow as between share price performance
studies completed can and underlying commodity tends
Initial see share prices stagnate to increase
discovery
Explorer Developer Producer + Growth
Time
Bellevue’s dual track pathway of development and exploration is designed to capture the gains achieved by a company in
exploration phase but also benefit from creating the pathway to production
26BGL – Lowest capital intensity vs global developer peer group
• BGL’s capital intensity of A$1,459/oz ranks it as the least capital intense development gold projects of scale
Capital Intensity (A$/koz) of key large scale development projects
13,080
7,800
5,825
4,867
4,346
3,427 3,602
2,740 2,941
2,096 2,103 2,107 2,458
1,523 1,548 1,846 1,862
1,459
Bellevue Volta KOTH Nyanzaga Namdini Eskay Mallina Busitica Windfall Mt Todd Black River Springpole Hardrock Gramalote Cote Stibnite Donlin KSM
Grande Creek
Global Australian
Source: All data sourced from public company disclosures. Developers’ production and capital cost forecasts were based off the most recent publically disclosed study. Capital
intensity calculated by dividing preproduction development capex by average LOM annual gold production.
27BGL – FS2 delivers substantial production growth
• Updated Stage 2 Feasibility Study provides for a forecast production increase of 21% over the life of the project
• Significant increase to production demonstrated within six months of previous study, with significant cashflow generation from
year 2 and a production profile of 200koz in the first 5 years at an impressive A$922/oz AISC and LOM of A$1,014/oz
Feasibility Study 1 & 2 Production (koz)
First 5 years of production avg 200koz at a bottom quartile AISC of A$922/oz
211 214 209
195
171 174
168 165 165 165
155 157
147
131
112
28
Y1 Y2 Y3 Y4 Y5 Y6 Y7 Y8
Feasibility Study 1 Feasibility Study 2
Source: Bellevue Gold Project Stage 1 & 2 Feasibility Studies.
28Outstanding forecast EBITDA and free cash flow generation
The Bellevue mine design and project has been optimised on profitability and free cash flow and not grade and the
project generates an average LOM FCF/oz of A$1,405/oz (pre tax and post commissioning)
Pre-tax and at a spot gold price scenario of A$2,400/oz, the project delivers consistent earnings of over A$2.4B at an
EBITDA Margin of 66% over life of mine
1,800 Cumulative Gold Production and EBITDA 3,000 Free Cash Flow (A$m) and Free Cash Flow per Ounce
$350 $2,500
1,600 $ 2,397 $ 2,412
$313m
$ 2,118 2,500 $291m $296m
$300
1,400
Free Cash Flow per Ounce ($ / oz)
$271m $2,000
Gold Production (oz)
$ 1,859 $259m
Free Cash Flow ($)
1,200 2,000 $250 $234m $1,757/oz
EBITDA ($M)
$ 1,620 $230m
1,000 $1,494/oz $1,488/oz $1,500
$200 $1,379/oz $1,382/oz $1,385/oz $1,373/oz
$ 1,254 1,500 $177m
800
$1,054/oz
$ 937 $150
$1,000
600 1,000
$ 558 $100
400
500 $500
$ 243
200 $50
0 - $0 $0
Y1 Y2 Y3 Y4 Y5 Y6 Y7 Y8 Y9 Y1 Y2 Y3 Y4 Y5 Y6 Y7 Y8
Cumulative Gold Produced Cumulative EBITDA @ A$2,400/oz Free Cash flow Free cash flow per ounce
Outcomes are based on Feasibility Study 2 results and assumes A$2,400/oz gold price as per the results from the Feasibility Study document.
29
This is pre-tax and debt repayment free cash flowA Robust, Independent Feasibility Study
On the pathway to production Bellevue has engaged industry leading experts to assist and drive the Feasibility Studies
Studies, mine design, scheduling Non-processing infrastructure Process plant and infrastructure Geotechnical engineering
Metallurgical testwork Metallurgical testwork advice Tailings deposition and storage Gravity circuit testwork
Regulatory and permitting process Power supply strategy and analysis Geochemical characterisation Hydrology and hydrogeology
Assistance with taxation Thickener and rheology testwork Communications and IT Mineral Resource estimation
International Resource Solutions Pty Ltd
30Fully Funded to Production
Pre-Production Capital Expenditure (A$M)
Site and Sustaining Capital 66
Processing Plant 82
Open Pit 14
Underground1 132
Capitalised operating costs 19
Capitalised revenue (61)
Sub Total 252
Contingency2 15
Total 267
Variations to FS1 include optimisation of underground capital development designs, removal of evaporation ponds and inclusion in tailings storage facility, increase
in processing facility capital costs, optimisation of OP designs, increased capitalised revenue generation. Six-month difference in start date of feasibility requires
early works to continue with exploration development.
(1) No contingency applied to the underground mining costs as mining costs have been escalated by an annualized rate of 6.6%.
(2) A$8.8m of contingency is applicable to the processing plant (10.6%) and A$6.4m (11.6%) of contingency relates to site capital.
31Conventional mining methods
Sub Horizontal Lodes (13% LOM Ounces)
• Areas with footwall dips < 45o utilise a modified
cut and fill method with sub level stoping
• Primary development is driven along strike of the
ore zones, the ore is then stripped out (up to
4.2m)
• The primary drive is filled with CRF as high as
practical to support the wall of the secondary
development drive
• The ore is then stripped out using long hole
Operations with similar mining methods techniques (up to 8m) into the secondary drive
• Sub Vertical: Whirling Dervish (Northern Star), • High pressure mechanical washing of the stripped
Wattle Dam (Ramelius), Andy Well (Latitude) out foot wall will be employed to ensure high
• Sub Horizontal: Wallaby (Goldfields), Golden Age recovery rates
(Wiluna), Miitel (Mincor) • A reduced mining recovery has been applied to
this mining method (85%)
Sub Vertical Loades (62% LOM Ounces) Development (25% LOM Ounces)
• Areas with footwall dips > 45o utilise long hole open stoping with placement of consolidated rock fill (CRF) • Sourced from both sub vertical and sub horizontal
for support mining areas
• An underhand method will be employed, stopes are opened up with a slot and blasted ore is bogged to a • Highly productive source of ore tonnes available
level stockpile. CRF is placed in the void from the level above and the next firing occurs against the still from multiple mining fronts providing consistent
curing material delivery of material to surface ROM Pad
32Project Operating Costs
Operating Costs
A$M A$/T Milled A$/oz Produced Operating Costs
(post-production)
• Underground & Open Pit Mining – Rates supplied by
UG & OP Mining 649 81.99 438 competitive Request for Quotation (RFQ) processes. Costs
include recovery of ore and delivery to surface ROM Pad,
Grade Control 58 7.29 39 associated ground support and backfilling and ancillary
Processing 241 30.40 162 services including movement of waste to stockpiles.
G&A 72 9.05 48 • Grade Control – includes two dedicated rigs and all
associated costs for sampling, assaying and consumables.
Royalties 165 20.84 111
• Processing– includes all power, maintenance spares and
Sub Total 1,185 149.57 799 materials, reagents and consumables, labour (including
Sustaining Capital technical and direct management support) and other minor
316 40.56 217 miscellaneous allowances.
(captured in AISC)
Total 1,502 190.13 1,016 • G&A – includes all site management, accommodation and
travel, light and heavy vehicles, communications and IT and
* The A$2/oz difference between total operating costs and AISC relates to stockpile movements at the
commencement of commissioning and AISC does not include closure costs. The associated AISC is A$1,014/oz
site compliance and licencing charges.
• Royalties – Includes WA State Government royalty of 2.5%
and an additional third-party royalty was also applied based
on existing agreements.
33BGL – Site Updated 3D Inventum video & Site Flyover Video
3D Inventum Link Click Below Project Flyover Link Click Below
https://inventum3d.com/c/BGL/Bellevue https://bellevuegold.wistia.com/medias/w9cw1f5wk2
34Corporate Summary
Building Strong Foundations
ASX Code Current Share Price A$0.87
BGL
ASX 300
Market Capitalisation ~ A$897M
Shares on issue ~1,031m
Cash1 ~ A$173m
Management & consultant options &
~34m
performance rights unlisted
Top 20 Shareholders ~ 63%
Shareholder Summary2
Total Global & Australian Institutions ~ 66%
Substantial shareholders
- Blackrock 13.4%
- 1832 Asset Management LP 9.1%
- Van Eck 7.5%
Board & Management (on a fully diluted basis) ~6%
Footnotes: 1. Unaudited as at 31 Dec 2021
2. As at 11 February 2022
3. Graph as at 14 February 2022
35Tier 1 location in world-class gold belt
Bellevue has Major Landholding of Over 2,780km²
Excellent infrastructure: Historically significant producing region:
• Services at Leinster, Leonora and Wiluna • Major gold deposits & producing gold mines in
proximity to Bellevue’s Projects (Agnew Gold
• Daily flights - Perth to Leinster (only 40km
Fields, Jundee NST, Thunderbox NST, Gwalia SBM)
south)
• Wiluna Belt endowment second only to
• Sealed roads Bellevue Mining
Kalgoorlie globally (+40Moz endowment) Licence
• Water
• Bellevue has major landholding of over 2,780km²
• Close proximity to grid power
Globally recognised Tier 1 mining Past production with outstanding geology:
jurisdiction: • Granted Mining Licenses
• Western Australia ranked Top 4 in Fraser • Previously produced ~0.8Moz at ~15g/t gold
Institute 2020 Mining Investment between 1987 and 1997
Attractiveness Index
• Underexplored and undeveloped for over 20
• Significant mines, infrastructure, Local & years
Government support for mining
• Excellent gold recoveries from recently released
testwork averaging 97.3% and gravity recoveries
from 58% - 85%
36A$21-26m exploration budget: An organic pipeline of growth
Bellevue discovery to resource growing at a compound annual growth rate of 81%. Armand Lode discovered August
2020, Marceline Lode discovered recently post the first Feasibility Study, multiple advanced targets ready for further
Resource growth and definition drilling throughout 2021 and 2022
37Bellevue’s economic contributions to society to grow with FS2
• Since the ‘discovery hole’ in November 2017, Bellevue has injected over A$88m into the Australian economy
• During construction and operation, our Stage 1 Feasibility Study forecasts to generate A$2.3 billion into the economy, including
capital and operating expenditure, such as goods and services procured, taxes and fees (incl. corporate tax, payroll tax,
tenement rent and rates), royalties, employee salaries, donations and community contributions
• BGL is forecast to employee up to 380 personnel over construction and 275 on a steady-state basis
Over our Life of Mine,
we project to provide Procurement (goods and services)
A$2.3b
Bellevue salary and wages
A$2.3b State and Federal taxes and government fees
Royalties, donations and community
investmemt
in economic contributions
The A$2.3b economic contributions does not factor in any multiplier effect 38BGL’s approach to ESG = no greenwashing
• Our Stage 1 Feasibility Study estimated that the gas power station would contribute 73% of the mine’s overall emissions
• The latest plans for the Bellevue power station will further reduce emissions, whilst maintaining reliability and meeting power demands
• Current plans are based around a substantial emission reduction compared to gas-only; and a ~50% emission reduction compared to diesel
• Over 90% of water used is from hypersaline underground water (an uncontested resource). No water will be discharged to the environment
• Bellevue is forecast to be a low-water consumption mine, at ~0.6 m3 of water consumed per tonne processed - which is leading-practice
• Climate change is a serious consideration; hence Bellevue is taking a science-based approach to reducing emissions and mitigating impacts
Annual power station GHG emissions (t CO2e)
45,000
Bellevue is forecast to have the
GHG / ounce least GHG emissions per oz
of any gold mine in Australia
30,000
Bellevue is forecast to have
the least total Scope 1 emissions
Total emissions of any major off-grid
15,000 gold mine in Australia
Bellevue is forecast to have
GHG / GJ one of the cleanest power supplies
for any gold mine in Australia
0
Diesel-only power station Gas-fired power station Renewables with gas
39ESG & the opportunity to be ‘best in class’ corporate citizens
BGL is evaluating all options on the pathway to development
- Smart blasting ✓ - Use of renewable electricity (eg. Climate consideration examples:
- Energy efficient grinding ✓ solar, batteries) to power - Bushfires ✓
- Running compressors at full load operations ✓ - Flooding ✓
and with cooler air intake - Using battery-powered electric - Groundwater scarcity ✓
- Waste heat recovery vehicles instead of petrol, diesel - Heatwaves ✓
- Variable speed drive motors/high or gas-powered vehicles
efficiency motors ✓ General efficiency considerations:
- Improving driver practices ✓
- Future consideration: above- - Internal and external lighting ✓
ground hydrogen powered haul
- Automation ✓
- HVAC optimisation
trucks ✓ - Building design ✓
- Maintenance procedures ✓
Efficiency Fuel switching New infrastructure
Bellevue is undertaking further assessments to identify additional risks
and opportunities and develop best business cases
40Bellevue is an industry leader in diversity
Bellevue has a Cultural Heritage Management Plan and a Diversity Policy
• Bellevue is leading the Australian mining sector for gender diversity and has a 0% gender pay-gap for like-for-like roles
• Key metrics of our diversity results include:
o 40% female directors, which is well above the WGEA mining sector average1 of 19.6%
o 35.7% females in leadership positions, which is well above the WA mining sector average2 of 22%
o 48% female employees, which is well above the WGEA mining sector average1 of 18%
• We are maintaining strong relationships with Traditional Owners, such as through employment and providing Cultural Awareness training to our staff.
Bellevue’s employment percentage of Aboriginal and Torres Strait Islanders people is 6.4%, which is 36% above the WA mining industry average2 of 4.7%
Overall female Overall Aboriginal
employment is 48%, employment is Mental health initiative Aiming for Cultural
aiming to be rolled out to Awareness training for
which is
6.4% 100% 100%
+166% which is 36% above the
above industry average WA industry average of our staff within 12mths of our staff
Female Aboriginal Mental Health Cultural Awareness
Employment Training Training Leonora schools lunch program
Employment
1 – WGEA (2021) WGEA Data Explorer – Mining
2 – CME (2019) Diversity in the Western Australian Resources Sector 2019 Report 41Why Bellevue?- Click Here
42Values and Vision
“To create a standout gold mining and exploration company that is an industry benchmark”
At Bellevue we believe we have a unique opportunity to develop a standout gold mining company that is the benchmark for others
to be measured against. We believe our four key values are fundamentally important to the success of Bellevue. These values
underpin the standards that we hold each other accountable to each and every day.
PASSION
Each day we will pursue our mission with passion and belief – a fierce determination to succeed and
an excitement about what we do.
ACCOUNTABILITY
We are all accountable for our success – our people, our community and our stakeholders. We will
always act with the highest level of integrity and respect to sustainably grow Bellevue.
COMMUNITY
The health, safety and wellbeing of our community is critical to our success. This includes respect for
our people, stakeholders and the environment.
EXCELLENCE
We aim for the highest standards of performance, behaviour and conduct in everything we do and
support everyone in our team to achieve this in everything they do. 43The sustainability pathway – a vision to be best in class
Begin TCFD TCFD gap Develop climate Climate considerations
analysis and risks and for new infrastructure, TCFD phase 3:
phase 1: integrate
identify Refresh TCFD staged action opportunities efficiency options and
benchmarking plan register fuel usage options Construction
Develop Power Stage 1
Check if NPI or Refined Stage 2 TCFD phase 2: Operation Investigate a
Sustainability supply Feasibility power Feasibility climate scenarios Science Based
NGER thresholds
Committee study Study supply Study Target
triggered
Charter (Feb 2021) study (Sep 2021)
NOW FY21 FY22 FY23
1 This timetable is indicative only and may change. Please refer to key risks that may cause changes to the timetable.
44Bellevue’s leading commitment on efficient energy use
• The Bellevue Gold Project has been designed to optimize energy use and reduce environmental impact
• Modeling places the project as of one of the most efficient gold mines, based on forecast energy use (GJ) per ounce produced
• Since the Stage 1 Feasibility Study, our forecasted energy intensity has improved from 5.108 GJ/oz to 3.483 GJ/oz
30
Energy Use (GJ / oz) for major Australian gold mines Telfer
25
Energy Intensity (GJ / oz Au)
20
Bellevue’s Energy Use Intensity Matilda-Wiluna
15
is forecasted to be 3.483 GJ/oz Plutonic
Costerfield
Tomingley KGCM
Mt Morgans
Ravenswood
10
Tropicana Saracen
Sunrise Dam
Boddington
Mt Rawdon
Jundee
Duketon
Peak
Ramelius
Cracow
Cowal
Kalgoorlie
Paddington
5 Cadia Valley Tanami
Gawlia
Mungari
Mt Carlton
Fosterville
0
0 1,000,000 2,000,000 3,000,000 4,000,000 5,000,000 6,000,000 7,000,000
Cumulative Gold Production per Year (oz)
45
Source: All data sourced from public company disclosures, with energy (GJ) statements and annualized production averaged over the last 2-6 years of available reported data.
Since the Stage 1 Feasibility Study, the Bellevue Gold figures have decreased, and recent data points from other mines have been added.You can also read