METHODOLOGY FOR THE REDUCTION OF ENTERIC METHANE EMISSIONS FROM RUMINANTS THROUGH THE USE OF 100% NATURAL FEED SUPPLEMENTADDITIVE - VM0041
←
→
Page content transcription
If your browser does not render page correctly, please read the page content below

VCS Methodology

VM0041

METHODOLOGY FOR THE REDUCTION OF
 ENTERIC METHANE EMISSIONS FROM
 RUMINANTS THROUGH THE USE OF
 100% NATURAL FEED
 SUPPLEMENTADDITIVE

 Version 1.01

 22 November 20192020

 Sectoral Scope 15
VM0041, Version 1.0
 Sectorial Scope 15

This methodology was developed by

 Document Prepared by MOOTRAL SA

 Author: Elsa Zoupanidou (Mootral SA)

Mootral would like to acknowledge the many contributions by colleagues at Mootral SA: Maria Sünkel,
Deepashree Kand, Hilde Vrancken, Matthias Miller, and Oliver Riede. Appreciation is extended to
Isabelle Botticelli (Mootral SA) and Michael Mathres (Mootral SA) who provided useful suggestions and
support over the entire period of the development of the Methodology. We are grateful to Silvana
Claassen (Climate Neutral Group), Sergi Cuadrat (Allcot AG), and Mercedes Garcia Madero (Allcot AG)
for their contribution and suggestions for improvements. Finally, we thank our reviewers, whose
comments and suggestions contributed to greatly increase the clarity and effectiveness of this
manuscript.

 2
VM0041, Version 1.0
 Sectorial Scope 15

Revisions to include xyz were prepared by abc.

 3
VM0041, Version 1.0
 Sectorial Scope 15

 Table of Contents
1 Sources ................................................................................................................ 6

2 Summary Description of the Methodology........................................................ 6

3 Definitions.............................................................................................................7

4 Applicability Conditions ..................................................................................... 9

5 Project Boundary ............................................................................................... 10

6 Baseline Scenario .............................................................................................. 12

7 Additionality ...................................................................................................... 13

8 Quantification of GHG Emission Reductions and Removals .......................... 13
 8.1 Baseline Emissions ......................................................................................................... 14
 8.2 Project Emissions ........................................................................................................... 17
 8.2.1 Enteric methane emissions reduction factor .................................................................... 18

 8.2.2 GHG emissions from feed additive manufacturing and transport ....................................19

 8.2.3 GHG emissions from manure decomposition due to application of feed additive ............ 21

 8.3 Leakage......................................................................................................................... 22
 8.4 Net GHG Emission Reductions and Removals ........................................................... 22

9 Monitoring .......................................................................................................... 23
 9.1 Data and Parameters Available at Validation .......................................................... 23
 9.2 Data and Parameters Monitored ................................................................................ 31
 9.3 Description of the Monitoring Plan.............................................................................. 44

10 References ......................................................................................................... 45

APPENDIX I: Justification for Activity Method ........................................................ 49
 1. Positive List ......................................................................................................................... 49

APPENDIX II: Background Information on Project Activity .................................. 55
 2. Direct enteric methane measurements ......................................................................... 56

 4
VM0041, Version 1.0
 Sectorial Scope 15

APPENDIX III: Ym Percentage of gross energy in feed converted to methane for
a specific animal group ......................................................................................... 59

 5
VM0041, Version 1.0
 Sectorial Scope 15

1 SOURCES
 This methodology was developed based on the requirements and guidelines of the
 following:
 ● VCS Standard, v4.0

 ● VCS Methodology Requirements, v4.0

 ● VCS Guidance: Guidance for Standardized Methods, v3.3

 ● 2006 IPCC Guidelines for National GHG Inventories. Volume 4: Agriculture,
 Forestry and Other Land Use. Chapter 10: Emissions from livestock and manure
 management

 The following have informed the development of this methodology:
 ● VCS module VMD0027: Estimation of domesticated animal populations, v1.0

 ● VCS module VMD0028: Estimation of emissions from domesticated animals, v1.0

 ● “Quantification Protocol” approved by the Alberta Offset System: Quantification
 protocol for reducing greenhouse gas emissions from fed cattle (version 3.0)

 ● ACR Methodology for Grazing Land and Livestock Management, v1.0

2 SUMMARY DESCRIPTION OF THE
 METHODOLOGY
 This methodology provides procedures to estimate enteric methane (CH 4) emission
 reductions generated from the suppression or inhibition of methanogenesis due to the
 introduction of a natural feed supplementadditive into ruminants’ diets. This methodology
 considers only emission reductions from enteric fermentation.

 Feed supplements additives applicable under this methodology reduce CH 4 emissions by
 directly acting on the population of methanogenic archaea in the rumen, or by suppressing
 CH4 production through modification of the rumen environment, thus limiting the growth of
 methanogenesis. This methodology focuses on application of natural plant-based feed
 supplements, which along with inhibiting methanogenesis, may also have advantageous
 effects on rumen bacteria, thereby improving fermentation in the rumen.

 Depending on the location where a project is implemented and data availability, this
 methodology provides three approaches for the quantification of baseline emissions and
 two approaches for the quantification of project emissions. Specifically, the quantification of
 baseline emissions may be performed using data from either on-site direct measurements,

 6
VM0041, Version 1.0
 Sectorial Scope 15

 or by applying one of two different Intergovernmental Panel on Climate Change (IPCC)-
 approvedrecommended methods to model emissions using country-specific or peer-
 reviewed biometric data. The quantification of project emissions may be performed using
 data from either on-site direct measurements, or by applying an empiricallymeta-
 analytically-derived and published regional emission reduction factor provided by the feed
 supplement manufacturer.

 Table 21: Additionality and Crediting Baseline Methods

 Additionality and Crediting Method

 Additionality Activity method

 Crediting Baseline Project Method

3 DEFINITIONS
 In addition to the definitions set out in VCS document Program Definitions, the following
 definitions apply to this methodology:

 Animal Group
 Animals at each farm grouped based on a homogenous ruminant population
 characterization such as animal type, weight, production phase (e.g., pregnant or lactating
 cow) and feed regimentype

 Diet
 Feed ingredients or mixture of ingredients including water, which is consumed by animals

 Dry Matter Intake (DMI)
 All nutrients contained in the dry portion of the feed consumed by animals

 Emission Reduction Factor
 Percent reduction of enteric methane emissions per animal per day due to project feed
 supplementadditive

 Enteric Fermentation
 A natural part of the digestive process of ruminants where microbes decompose and
 ferment food present in the digestive tract or rumen. Enteric methane is one by-product of
 this process and is expelled by the animal mostly through eructation.

 Enteric Methane
 Methane emissions from ruminants, due to enteric fermentation, as part of the digestion of
 feed materials

 7
VM0041, Version 1.0
 Sectorial Scope 15

 Enteric Fermentation
 A natural part of the digestive process of ruminants where microbes decompose and
 ferment food present in the digestive tract or rumen. Enteric methane is one by-product of
 this process and is expelled by the animal through burpingeructation.

 Feed(s)
 Edible material(s) which are consumed by animals and contribute energy and/or nutrients
 to the animal’s diet

 Feed Supplement
 A feed added to an animal’s regular diet to improve the nutritive balance of the total mixed
 ration (or any other purpose, such as reduction of methane emissions) and intended to be
 (i) fed undiluted as a supplement to other feeds; (ii) offered free-choice with other parts of
 the feed; or (iii) further diluted and mixed to produce a complete feed

 Feed Additive

 Any intentionally added ingredient not normally consumed as feed by itself, whether or not
 it has nutritional value, which affects the characteristics of feed, animal productivity or
 emissions. Microorganisms, enzymes, acidity regulators, trace elements, vitamins,
 phytogenic substances, functional ingredients and other products fall within the scope of
 this definition depending on the purpose of use and method of administration - Codex
 Alimentarius Code of Practice on Good Animal Feeding CAC/RCP 54 (FAO and WHO,
 2004) and FAO (2020)

 Gross Energy
 The total caloric energy contained in feed

 Livestock Production Operation
 An agricultural setting, permanent or semi-permanent facility or non-grazing area, where
 domesticated animals are kept or raised either indoors or outdoors to provide traction or for
 livestock commodities purposes1

 Methanogenesis
 The formation of methane in the rumen anaerobically by microbes known as methanogens

 Neutral Detergent Fiber (NDF)
 A measure of total structural components (i.e., lignin, hemicellulose, cellulose, tannins and
 cutins) within the cells of plants that provides an estimate of fiber constituents of feedstuffs
 and indicates maturity; the higher the value, the more mature and lower quality the forage.

 Rumen

1 FAO. Shaping the Future of Livestock. Berlin, 18–20 January 2018 http://www.fao.org/3/i8384en/I8384EN.pdf

 8
VM0041, Version 1.0
 Sectorial Scope 15

 The large first large compartment of the stomach of a ruminant where fermentation occurs,
 which allows for the digestion of fiber and other feeds.

 Ruminant
 A mammal that has a different digestive system to monogastric (single stomach) animals.
 The primary difference is that ruminants' “stomach” consists of four compartments. The
 ruminants are able to acquire nutrients from plant-based food by fermenting it in the
 biggest compartment, the rumen, prior to digestion. Ruminating mammals include species
 like cattle, goat, sheep, deer, giraffes and antelopes.

4 APPLICABILITY CONDITIONS
 This methodology applies to project activities which reduce enteric methane (CH 4)
 emissions through the inhibition or reduction of methanogenesis due to the introduction of
 a natural feed supplementadditive into ruminants’ diets.

 The methodology is applicable under the following conditions:

 1. Livestock producers must feed their animals a natural feed supplementadditive
 which reduces enteric CH4 emissions by direct inhibition or suppression of
 methanogens in the rumen or by modifying the rumen environment.

 2. Only ruminant animals shall be included in the project.

 3. The project feed supplementadditive must meet the following conditions:

 a. The active ingredients of the feed supplement must be 100% natural plant-
 based or macroalgae-based and non-GMO. This includes extracted
 components of plants. The feed manufacturer must provide a non-GMO
 certificate based on lab analysis.

 b.a. The feed supplementadditive must have been demonstrated to comply with all
 feed and food regulations in each national or subnational (including local)
 jurisdiction in which it is consumed. Where conflict arises between regulations,
 the most stringent standard must apply.

 c.b. The feed supplementadditive must have no significant negative animal welfare,
 health or performance impacts on the animal to which it is fed. Where conflict
 arises between regulations, the most stringent standard must apply.This
 canmust be shown through regulatory approval and the submission of
 published evidence demonstrating no negative impacts on animal welfare. . .

 d.c. The feed supplementadditive must be used as per feeding instructions provided
 by the manufacturer. The instructions provide critical defining conditions to

 9
VM0041, Version 1.0
 Sectorial Scope 15

 secure the default level of reduction of the enteric methane emissions, such as
 the feeding routine and dose of supplementadditive per kg of DMI to the animal.

 4. Emission reductions generated by the use of other feed supplementadditives
 and/or activities (e.g., improving animal productivity or nutritional and management
 strategies), the objective of which does not lead to the inhibition or suppression of
 methanogenesis, cannot be claimed through this methodology. This is to prevent
 overestimation of emission reductions achieved.

 5. The implementation of project activities must confirm that the herd of ruminants in a
 given operation is fed the project feed supplementadditive. For this purpose, the
 project proponent must be able to trace the feed supplementadditive fed to
 livestock from the producer to on-farm consumption.

 6. Evidence must be provided that there will be no increase in the manure emissions
 due to the feed supplementation additive (e.g., evidence-based literature, peer-
 reviewed publications, study reports). This can be demonstrated with data showing
 no significant differences in manure composition due to feed additive consumption.
 Where there are significant differences, the additive may still be used but the
 project must account for CH 4 and N2O emissions from manure using IPCC default
 factorsTier 2 recommended estimation method.

 6.
 7. Baseline emissions included in this methodology are CH 4 production from enteric
 fermentation and are determined as the average activity over at least three
 continuous years prior to project implementation. Therefore, the project activities
 are required to meet the following conditions:

 a. Where project areas involve livestock farms that were operating prior to the
 start of project activities, reliable data (e.g., gross energy intake and dry
 matterfeed intake in the form of energy or dry matter, nutrient composition of
 feed) per animal group must be available for a minimum of two years where
 using baseline emissions Option 1 and three years where using baseline
 emissions Option 2. See Section 8.1 below for further details on options for
 quantifying baseline emissions.

 b. Where project areas involve livestock farms for which no farm records or
 farming data are available, the project proponent must be able to provide
 evidence to substantiate the animal group to which each new project area is
 allocated according to the average group as described in national or regional
 statistical accounts (i.e., the baseline emissions will be considered as the
 average activity of where the project is located).

5 PROJECT BOUNDARY
 10
VM0041, Version 1.0
 Sectorial Scope 15

The spatial extent of the project boundary encompasses all geographic locations of
supplementadditive production, supplementadditive transport, and project activity locations
where natural feed supplementadditive is part of the livestock production operation.

Table 32 below indicates the emission sources and GHGs included in the project boundary
and the GHGs to be monitored.

Table 32: GHG Sources Included In or Excluded From the Project Boundary

 Source Gas Included? Justification/Explanation

 Baseline CO2 No No changes in biogenic CO 2 emissions are
 expected due to the project activity.

 CH4 Yes CH4 emissions from enteric fermentation, prior to
 Enteric the project technology implementation,
 Fermentation represent the major source of emissions in the
 baseline scenario.

 N 2O No No changes in biogenic N 2O emissions are
 expected due to the project activity.

 Project CO2 No No changes in biogenic CO 2 emissions are
 expected due to the project activity.

 CH4 Yes CH4 emissions from enteric fermentation are the
 Enteric
 major source of emissions in the project
 Fermentation
 scenario.

 N 2O No No changes in biogenic N 2O emissions are
 expected due to the project activity.

 CO2 Yes CO2 emitted from supplementadditive
 transportation and production.
 SupplementAd
 ditive CH4 Yes CH4 may be emitted from combustion of fossil
 Production and fuels during the processing.
 Transport N 2O No N2O emissions are not expected during the
 production process.

 CH4 Yes Changes in CH4 production may be emitted via
 manure decomposition may occur due to project
 Manure activity.
 decomposition
 N 2O Yes Changes in N2O may be emitteproduction d via
 manure decomposition may occur due to project
 activity.

As indicated in the table aboveTable 23, the project boundary includes CH 4 emissions from
enteric fermentation. The dominant pathway for CH 4 emissions from enteric fermentation is

 11
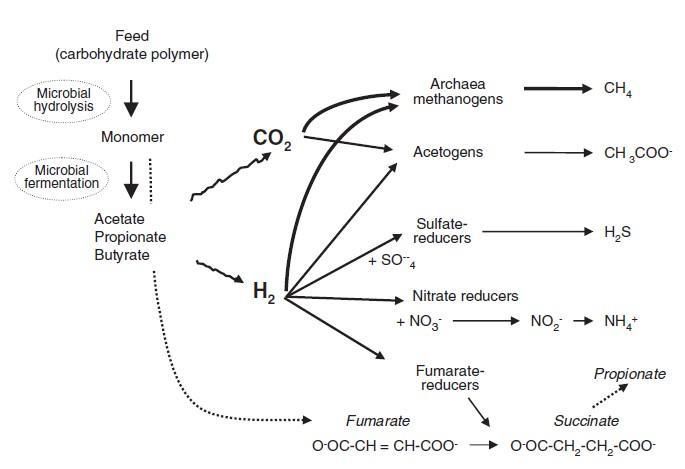
VM0041, Version 1.0
 Sectorial Scope 15

 exhalationeructation, and therefore CH 4 emissions need only be monitored via exhalation.
 The project boundary does not include CH 4 emissions from flatulence, because changes in
 methanogenesis will not impact the fixed ratio of methane released between exhalation
 and flatulence due to physiology of the rumen (i.e., a decrease in exhaled methane
 corresponds to a decrease in methane flatulence). Further, due to rumen physiology, In
 some casescases, the feed additive could have an effect on digestibility parameters, which
 will affect manure nutrient composition and potential CH4methane emissions during
 storage and field application. changes in methanogenesis does not impact manure
 decomposition. For this reasonIf the feed additive is demonstrated to shift manure
 composition, then the project boundary also does notmust include CH4 or N2O emissions
 from decomposing manure.

 Ruminants release methane CH4 by exhaling the gas mainly through their mouth and
 nostrils. Enteric CH 4 is produced mainly in the rumen (9087%) and, to a smaller extent
 (130%), in the large intestine (Murray et al., 199976; Dini et al., 2012). However, 89% of
 the hind gut produced methane is exhaled through lungs (Murray et al., 1976). Feed
 supplementadditives that inhibit rumen methanogenesis cannot influence the ratio of
 enteric methane emissions in exhaled air compared to methane emissions in extracted
 feces due to the ruminants’ physiology. The specific and direct inhibition of the
 methanogenesis in the rumen is not demonstrated to cause a major change in the overall
 rumen fermentation as this process is downstream of these metabolic processes.

 Consequently, most feed supplementadditives will not impact digestion in a way that would
 lead to an increase in the CH 4 or N2O emissions in thefrom manure decomposition.
 However, as Keuzer et al. (2006) concludedreported, in fact, that some feed additives
 designed to limit methane CH4 emissions reduced methane CH4 emissions from both the
 digestive trackt and manure decomposition. Another study by Nampoothiri et al. (2015)
 reports that, in general, dietary manipulations have very little effect on manure N 2O
 production. Further studies (Aguerre et al, 2011; Aguerre et al, 2012; Hristov et al, 2012)
 verifiedshowed that methane CH4 reduction achieved by manipulating the rumen
 fermentation had no change in manure emissions. The emissions from this element are
 expected to be equal or lower in the project as compared to the baseline scenario.
 Avoidance of increase in the manure emissions due to feed supplementation additives is
 dealt with by the applicability condition 6 of this methodology.

6 BASELINE SCENARIO
 At the project start date, the most plausible baseline scenario must be identified as the
 continuation of livestock operations following business as usual practices (i.e., typical

 12
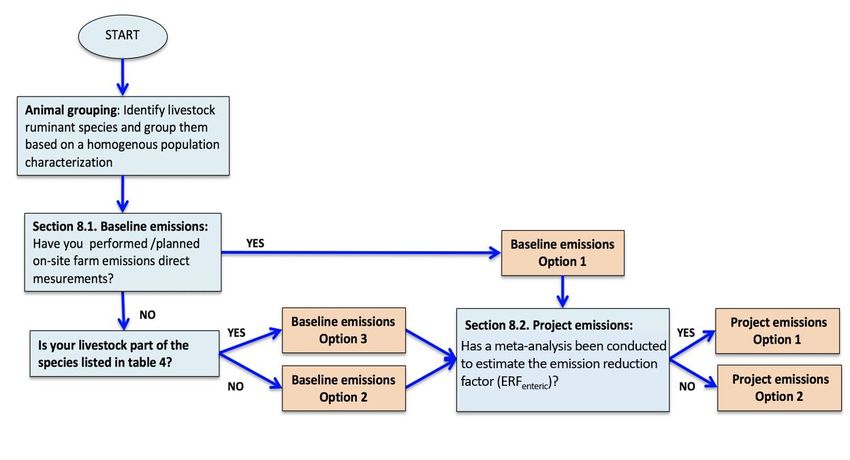
VM0041, Version 1.0
 Sectorial Scope 15

 feeding regime without using a natural feed supplementadditive to reduce CH4 enteric
 fermentation). There are no plausible alternatives to this baseline scenario.

7 ADDITIONALITY
 This methodology uses an activity method for the demonstration of additionality. Project
 proponents applying this methodology must determine additionality using the procedure
 below:

 Step 1: Regulatory surplus

 The project proponent must demonstrate regulatory surplus in accordance with the rules
 and requirements regarding regulatory surplus set out in the latest version of the VCS
 Standard.

 Step 2: Positive list

 The applicability conditions of this methodology represent the positive list. The project must
 demonstrate that it meets all of the applicability conditions, and in so doing, it is deemed as
 complying with the positive list. The positive list was established using the activity
 penetration option (Option A in the VCS Methodology Requirements).

 Justification for the activity method is provided in Appendix I.

8 QUANTIFICATION OF GHG EMISSION
 REDUCTIONS AND REMOVALS
 This methodology proposes three approaches for the quantification of baseline emissions
 and two approaches for the quantification of project emissions, the applicability of each
 being dependent on data availability. Figure 1 outlines the steps involved in determining
 baseline and project emissions. The steps are listed below and explained in more detail in
 the following sections.

 Figure 1: Decision Tree for CH 4 Emissions from Enteric Fermentation

 13
VM0041, Version 1.0
 Sectorial Scope 15

8.1 Baseline Emissions
 Emissions in the baseline scenario are estimated as the sum of annual emissions from
 enteric fermentation according to the following equation:

 = ∑
 =1[ , ]● (1)
 1000

 Where:
 BEEnteric Total baseline CH4 emissions from livestock enteric fermentation for farm i
 (tCO2e).
 Where the project activity includes multiple farms, emissions in the baseline
 scenario are estimated as the sum of annual emissions from each farm i:
 ∑
 =1[ ]

 EFEnterici,j Enteric CH4 emissions factor for each animal group j during the monitoring period
 (kg CH4 group-1)
 GWP Global Warming Potential of methane (=28 tCO2/tCH4)
 1000 kg per one metric tonne
 i Identification of livestock farm (1,2,..,N)
 j Animal grouping (1,2,..,N).

 This methodology provides three options for determining the enteric emissions factor
 (EFEntericj). Depending on the availability of relevant project data and measurements,

 14
VM0041, Version 1.0
 Sectorial Scope 15

 each project proponent must choose the most appropriate of the following options for each
 animal grouping.

 EFEntericij Option 1

 Option 1 calculates the enteric emission factor for each animal group by performing direct
 enteric methane CH4 measurements to estimate the methane CH4 production per animal
 group per day (enteric emissions production factor - EFProductioni,j). The enteric emissions
 production factor for each animal group measured by the chosen technology must be
 available at the validation. Therefore, using Option 1, the enteric emission factor for each
 animal group is calculated as follows:

 , = , ● , ● , (2)

 Where:

 EFEnterici,j Enteric CH4 emissions factor for each animal group j during the
 monitoring period (kg CH 4 group-1)
 EFProductioni,j Average enteric emissions production factor for each animal group
 during the baseline or monitoring period (on-site direct measurement by
 chosen technology2) (kg CH4 head-1 day-1)
 Daysi,j NNumber of days for each animal in the group j during the monitoring
 period in farm i
 Ni,j Average number of head in each animal grouping j in the farm i in the
 monitoring period (head)
 i Identification of livestock farm (1,2,..,N)
 j Animal grouping (1,2,..,N)

 Baseline emission production factor (EFProduction) may be measured prior to project
 implementation with a sample for each animal group subsequently included in the project.
 Alternatively, a control group for each animal group can be used during project
 implementation, thus allowing baseline monitoring and project monitoring to occur
 simultaneously. The control group is used as a baseline measure and is identical to all
 other animals with the exception that it does not receive the feed supplementadditive.
 EFProduction remains fixed for the project crediting period once determined. Please see
 Appendix II for further details regarding the direct methane measurement technologies and
 procedures.

 Two years of farm-specific data (e.g., gross energy intake, and dry matter intakeDMI and
 nutrient composition) prior to project implementation must be provided during validation.
 This data could be given per group of animals and will be used to demonstrate that the

2 See Appendix II

 15
VM0041, Version 1.0
 Sectorial Scope 15

 Option 1 measured baseline does not represent a biased event as compared to the prior
 conditions at the farm, and therefore the EFProduction reflects the average activity of where
 the project is located.

 EFEntericij Option 2

 Option 2 provides procedures to calculate the enteric emission factor for each animal
 group by applying an IPCC Tier 2 method, using the following equation. The emission
 factor for each animal group is calculated as follows:

 , = [ ● , ● , ● , ] ● −1 (3)

 Where:

 EFEnterici,j Enteric CH4 emissions factor for each animal group j during the monitoring
 period (kg CH 4 group-1)
 GE j Average gross energy intake per animal grouping j in the farm i (MJ head-1 day-
 1)

 Ym j Conversion factor (Ym) indicates the proportion of the animal grouping j gross
 energy intake (GE) converted to enteric CH 4 energy (see Appendix III). Energy
 of CH4 as a percentage of GE (dimensionless).
 Days Number of days for each animal in the group j during the monitoring period in
 farm i3
 Ni,j Average number of head in each animal grouping j in the farm i in the
 monitoring period (dimensionless)
 EC Energy content of methane (=55.65 MJ kg -1 of CH4)
 i Identification of livestock farm (1,2,..,N)
 j Animal grouping (1,2,..,N)

 Gross energy intake GE is calculated by multiplying dry matter intakeDMI by the energy density of
 the feedstuff, using Equation 4:

 = [ ● ] (4)

 Where

 DMI j Average dry mass of feed consumed by animal group j in a given day (kKg head-1
 day-1)
 ED Energy Density. Average energy content of dry matter [MJ kg -1] =

3 Note that the number of days could be less than 365. For example, in the case of young cattle the number of days
 represents the length of stay in a specific group.

 16
VM0041, Version 1.0
 Sectorial Scope 15

 ● 18.45 MJ kg-1 may be used as a default for diets including edible oils with fat
 contents in the range of 4 to 6%.
 ● 19.10 MJ kg-1 may be used as a default for diets including edible oils with fat
 contents below 4%.

 EFEntericij Option 3

 Option 3 is only suitable for animal species listed in Appendix IVTable 4 below, and where
 the project proponent does not have the required data for Option 2. The enteric emission
 factor for each animal group, is calculated as follows:

 , = ∑ [ , ● , ● , ] [ , ● , ● , ● ] (45)

 Where:

 EFEnterici,j Enteric CH4 emissions factor for each animal group j during the monitoring
 period (kg CH 4 group-1)
 EFi,j Average enteric CH 4 emissions factor for each animal group j during the
 monitoring period (country or regional specific factors, or those provided in
 AppendixTable IV4), (kg CH4 head-1 day-1)
 Days NNuumber of days for each animal in the group j during the monitoring period
 in farm i
 Ni,j Average number of head in each animal grouping in the farm i in the monitoring
 period; dimensionless
 i Identification of livestock farm (1,2,..,N)
 j Animal grouping (1,2,..,N)

8.2 Project Emissions
 Emissions in the project scenario are estimated as the sum of annual emissions from
 enteric fermentation, and from the production, and transport, and application of the
 supplementadditive, according to the following equation:

 = ∑
 =1[ ] ● [1 − ]● 1000
 + [ ] ● [1 −

 ]● 1000
 +

 , = , − [ , ● ] (56)

 Where:

 17
VM0041, Version 1.0
 Sectorial Scope 15

 PЕEnterici Total project enteric CH 4 emissions from livestock enteric fermentation for farm i,
 and the production and transport of the supplementadditive used during the
 monitoring period (tCO 2e)
 Where the project activity includes multiple farms, emissions in the project
 scenario are estimated as the sum of annual emissions from each farm i:
 ∑
 =1[ ] [ ]

 EFEnterici,j Enteric CH4 emissions factor for each animal group during the monitoring period as
 determined in Equation 2, 3 or 45 above (kg CH4 group-1)
 ERFEntericj Enteric CH4 emissions reduction factor (default or determined percentage value).
 SupplementAdditive’s percentage reduction of the enteric CH 4 per animal in an
 animal group j during the monitoring period.

 EFME Total emissions associated with manufacturing and transport of the feed
 supplementadditive in the farm i during the monitoring period (tCO 2e)
 GWP Global Warming Potential of methane (tCO 2/tCH4)
 1000 kg per one metric tonne
 i Identification of livestock farm (1,2,..,N)
 j Animal grouping (1,2,..,N)

8.2.1 Enteric methane emissions reduction factor

 There are two options to calculate the enteric methane emission reduction factor:

 ERFEnteric Option 1:

 Apply the defaultCalculate enteric emission reduction factor (%) estimated by the
 manufacturer of the feed supplementadditive and calculate the emissions using Equation
 56.4 This option may only be used where the enteric methane emission reduction factor
 provided by the manufacturer of the feed supplement is supported by peer-reviewed
 literature The enteric emission reduction factor can be established through a meta-analysis
 of at least 3 peer-reviewed publications in reputable journals that are listed in the science
 citation index or farm-specific emissions data that was determined by following the
 guidelines specified in Appendix II. This information must be provided for review at
 validation and at each verification. Additionally, there must be no significant greater than
 5% differences between project parameters (e.g., feed regime, animal type, weight,
 production phase, geographic region, and management practices) and the manufacturer’s
 default enteric emission reduction factor established through a meta-analysis study design.
 The nutrient profile of the feed can be used to adjust using the published meta-analysis if

4 The default factor provided by the manufacturer must meet the requirements for default factors set out in Section
 2.5.2 of the VCS Methodology Requirements v4.0.

 18
VM0041, Version 1.0
 Sectorial Scope 15

 there are differences between the average in the meta-analysis and the project diet. Where
 there are significant differences betweenin the project parameters and the that cannot be
 adjusted in manufacturer’s study designthe meta-analysis, the project must use Option 2.

 ERFEnteric Option 2:

 Determine the enteric methane emissions reduction factor for each animal group by
 performing direct enteric methane measurements to estimate the methane production per
 animal group per day while consuming the feed supplementadditive during the monitoring
 period. The feed supplement’s enteric emission reduction factor will be quantified by
 comparing actual project performance to enteric emission factors determined when
 quantifying baseline emissions (option 1 under 8.1), using Equation 67.

 Enteric emissions reduction factor calculation:

 , – ( ● ∗ )
 , = ,
 ● 100 (67)

 Where:
 ERFEnterici,j Enteric CH4 emissions reduction factor for each animal group j in farm i (default
 percentage value)
 EFEnterici,j Enteric CH4 emissions factor for each animal group j, determined using Option
 1, 2 or 3 in Section 8.1 above (kg CH4 group-1)
 PEi,j Average enteric emissions production factor for each animal group j during the
 monitoring period in farm i (on-site direct measurement by chosen technology 5)
 (kg CH4 head-1 day-1)
 Ni,j Average number of head in each animal grouping j in the farm i in the
 monitoring period; dimensionless
 Daysi,j Number of days for each animal in the group j during the monitoring period in
 farm i
 i Identification of cattle farm (1,2,..,N)
 j Animal grouping (1,2,..,N)

8.2.2 GHG emissions from feed supplementadditive manufacturing and transport

 Emissions from the feed supplementadditive are estimated by including all GHG sources
 from manufacturing and transport. Accounting for these GHG sources is not required for a

5 See Appendix II, Table 7: Measurement technologies of enteric methane emissions

 19
VM0041, Version 1.0
 Sectorial Scope 15

 project where such emissions are shown to be de minimis6. Otherwise, these emissions
 must be estimated as follows:

 ●
 = 1000
 + (7)
 = – = – – (8)
 Where:
 EFME Total emissions associated with manufacturing and transport of the feed
 supplementadditive in the farm i during the monitoring period (tCO 2e)
 FMi Amount of feed supplementadditive purchased by the farm i during the monitoring
 period (kg)
 EFP Emission factor for production of feed supplementadditive (kg CO2e kg-1)
 EFT Emissions for transport of feed supplementadditive consumed during monitoring
 period to the farm i (tCO2e)

 Project emissions from the production of the feed supplementadditive at the
 manufacturer’s production facility are calculated as:

 = ( ● ) + ( ● ● ) (79)

 Where:
 Qelec Quantity of electricity from the grid used per kilogram of feed supplementadditive
 production MWh kg -1) during the monitoring period. To be determined by the feed
 supplementadditive manufacturer.

 EFelec Emissions factor for electricity (kg CO 2 MWh-1)7

 Qffa Quantity of fossil fuel type a used per kilogram of feed supplementadditive
 production during the monitoring period (volume or kg fuel/kg feed
 supplementadditive). To be determined by the feed supplementadditive
 manufacturer.

 FCa Energy content per unit of fuel type a combusted (terajoule or TJ/ volume or kg
 fuel).

 EFfuel Emission factor of fuel type a (kg CO2e/ TJ).

6 The pool or source may be excluded only if it is determined to be insignificant using appropriate approved tools for
 significance testing (e.g., the CDM “Tool for Testing Significance of GHG Emissions in A/R CDM Project Activities”,
 available at http://cdm.unfccc.int/EB/031/eb31_repan16.pdf).

7 The latest approved version of CDM tool “Tool to calculate the emission factor for an electricity system” may be used
 to determine EFelec if country or state/province values are not available.

 20
VM0041, Version 1.0
 Sectorial Scope 15

 a Fossil fuel type

 Project emissions from the transport of the feed supplementadditive to the project site are
 calculated as:

 = ● ● (810)

 Where:

 TEFi Tonnes per km or miles of CO 2 emitted by transport mode m per kg of feed
 delivering feed supplementadditive consumed during the monitoring period to farm
 i (t CO2 kg-1km-1)

 Di Distance travelled by transport mode m delivering feed supplementadditive
 consumed during the monitoring period to farm i (km or miles)
 FMi Amount of feed supplementadditive purchased by the farm i during the monitoring
 period (kg)

8.2.3 GHG emissions from shifts in manure decomposition due to application of feed
 additive
 If the feed additive is documented to impact manure nutrient composition and related
 methane emissions from manure decomposition, project emissions should be calculated as
 follows:

 4 = [∑ , , ( , ● , ● , , ● , , )/1000] (9)

 Where:
 CH4 CH4 emissions from manure decomposition, kg CH 4 yr-1
 Ni,j Average number of head in each animal grouping j in the farm i in the
 monitoring period; dimensionless
 VSi,j Annual average VS excretion per animal grouping j, for farm i
 AWMSi,j,s Fraction of total annual VS for each animal grouping j that is managed in
 manure system S on farm i
 EFi,j,s Emission factor for direct CH4 emissions from manure management system S
 by animal grouping j on farm i, g CH4 kg VS -1
 S Manure management system
 j Animal grouping (1,2,..,N)
 i Identification of cattle farm (1,2,..,N)

 21
VM0041, Version 1.0
 Sectorial Scope 15

 If the feed additive is documented to impact manure nutrient composition and related nitrous
 oxide emissions from manure decomposition, project emissions should be calculated as
 follows:
 44
 2 = [∑ [∑ , (( , ● , ) ● , , ) + ( ) ]● 3( ) ]● 28 (10)

 Where:
 N 2O Direct N2O emissions from manure decomposition, kg N 2O yr-1
 N i ,j Average number of head in each animal grouping j for farm i
 Nexi,j Annual average N excretion per animal grouping j for farm i
 AWMSi, j, S Fraction of total annual nitrogen excretion for each animal grouping j
 managed in system S on farm i
 Ncdg(s) annual nitrogen input via co-digestate, kg N yr-1, where system refers to
 anaerobic digestion
 EF3(s) emission factor for direct N 2O emissions from system S, kg N2O-N/kg N
 S manure management system
 j Animal grouping (1,2,..,N)
 i Identification of cattle farm (1,2,..,N)
 44/28 conversion of N 2O-N emissions to N2O emissions

8.3 Leakage
 In the context of this methodology, leakage could potentially consist of a change in the
 number of animals in the livestock operation due to livestock performance impacts of
 introducing the supplementadditive, thereby necessitating changes in livestock populations
 in non-project operations to fulfill market demand. WhileHowever, supplement additives are
 generally expected to have an insignificant impact on livestock performance, some studies
 do demonstrate enhancements (seaweed paperse.g., Kinely et al., 2020). However, any
 resulting productivity improvements are not expected to impact emissions reductions and
 thus do not need to be accounted for. Additionally, due to the economics of livestock
 production, it is unlikely that the costs and risks associated with increasing or decreasing
 the number of animals in the operation is justified from the minimal expected changes in
 animal performance alone. Therefore, leakage is considered to be zero.

8.4 Net GHG Emission Reductions and Removals
 Net GHG emission reductions are calculated as follows:

 22
VM0041, Version 1.0
 Sectorial Scope 15

 = ∑
 =1[ – ] [ – ]
 =
 – = – – (1111)
 Where:
 ERBEEnterici Total GHG emission reductions due to project activities during the monitoring
 period (tСО2e)
 BEEnteric Total baseline enteric CH4 emissions from livestock enteric fermentation in the
 farm i during the monitoring period (tCO 2e)
 PЕEnterici Total project enteric CH 4 emissions from livestock enteric fermentation in the
 farm i, and the production, and transport and application of the
 supplementadditive used during the monitoring period (tCO 2e)
 i Identification of farm (1,2,..,N)

9 MONITORING
9.1 Data and Parameters Available at Validation
 Data / Parameter
 GEj intake
 Data unit
 MJ head-1 day-1 of dry matter
 Description
 Average gross energy intake for a specific animal group
 Equations
 3
 Source of data
 Records and data from livestock operator or associated partners for three
 continuous years of historical data prior to the initiation of the project or
 from national/regional statistical accounts. Records and data during the
 project implementation also required.
 Value applied
 N/A
 Justification of choice of
 Gross energy intake can be calculated by multiplying dividing dry matter
 data or description of
 intake by the energy density of the feedstuff using equation 4
 measurement methods
 and procedures applied The gross energy (GE) content of the diets is calculated based on the fat
 level of the diets, therefore the livestock operator or associated partners
 need to demonstrate the fat content of the diet.

 Parameter to be updated with any change in the animal's feeding regime.
 Purpose of Data
 Calculation of baseline emissions
 Comments
 Calculated based on measured dDaily dDry mMatter iIntake (DMI) and
 energy density

 23
VM0041, Version 1.0
 Sectorial Scope 15

Data / Parameter
 DMIj
Data unit
 Kg head-1 day-1
Description
 Average dry mass of feed consumed by an animal in a given day
Equations
 None4
Source of data
 Records and data from livestock operator or associated partners for three
 continuous years of historical data prior to the initiation of the project or
 from national/regional statistical accounts. Records and data during the
 project implementation also required.
Value applied
 N/A
Justification of choice of
 Data must be provided by the livestock operator or associated partners
data or description of
 for each animal group. The farm records must document the average daily
measurement methods
 dry matter intake by animal grouping in the project.
and procedures applied
 Parameter to be updated with any changes in the animal’s feeding
 regime.
Purpose of Data
 Calculation of baseline emissions
Comments
 Required to calculate gross energy intake for equation 3

Data / Parameter
 Ymj
Data unit
 Dimensionless
Description
 Percentage of feed gross energy converted to methane for each animal
 group
Equations
 3
Source of data
 Country or regional and population specific Ym values should be used
 when available to better reflect the ruminants’ population characteristics.

 Default values provided in Table 67 or 8 (Appendix III) may be used as an
 alternative where regional values are not available.
Value applied
 N/A
Justification of choice of
 National environmental agencies or similar government and research
data or description of
 institutions have accurate peer-reviewed studies that provide Ym values.
measurement methods
 Therefore, these values must be preferred and used where direct
and procedures applied
 applicability can be demonstrated.

 The IPCC default values for the Ym (Table 67 in Appendix III) are provided
 for the different animal categories which can be used when no respective

 24
VM0041, Version 1.0
 Sectorial Scope 15

 values are available from country-specific research. The associated
 uncertainty estimation of ± 1% of the IPCC Ym values reflects the fact that
 diets can alter the proportion of feed energy emitted as enteric methane.

 Table 8 in AppendixThe table III provides Ym values derived from cattle
 with diets containing various levels of neutral detergent fibers (NDF). The
 NDF values of the feed used in the project must be available in order to
 use Table 86. Detailed information can be found in Appendix III.

 The IPCC Guidelines for National Greenhouse Gas Inventories is
 internationally recognizedrecognized, and the data provided in the
 guidelines is peer reviewpeer-reviewed.

 Parameters from any source (e.g., IPCC or national agencies) must apply
 the most conservative value of any uncertainty component.

 Parameters to be updated each crediting period where new data exists.
Purpose of Data
 Calculation of baseline emissions
Comments
 N/A

Data / Parameter
 NDFj
Data unit
 % of dry matter Dimensionless

Description
 Forage quality indexices (% Neutral detergent fiberdry matters)
Equations
 None
Source of data
 Records and data from livestock operator or associated partners for three
 continuous years of historical data prior to the initiation of the project or
 from national/regional statistical accounts. Records and data during the
 project implementation also required.
Value applied
 N/A
Justification of choice of
 Data must be provided by the livestock operator or associated partners
data or description of
 for each animal group. The assessment of the quality of forages is
measurement methods
 typically provided by the farmer’s nutritionist formulating the rations for
and procedures applied
 the animals.

 NDF values are used to determine the Ym. Detailed information can be
 found in appendix III.
Purpose of Data
 Calculation of baseline emissions
Comments
 N/A

 25
VM0041, Version 1.0
 Sectorial Scope 15

Data / Parameter
 ED
Data unit
 MJ per kg of dry matter
Description
 Energy content of dry matter
Equations
 4
Source of data
 Default value or farm specific data
Value applied
 N/A
Justification of choice of
 Farm specific values should be used, when available, otherwise use the
data or description of
 typical values provided below:
measurement methods
and procedures applied The typical energy density of feedstuff is:

 - 18.45 MJ kg’-1 may be used as a default for diets including edible oils
 with fat contents in the range of 4 to 6%

 - 19.10 MJ kg’-1 may be used as a default for diets including edible oils
 with fat contents below 4%

 Parameters to be updated each crediting period where new data exists.
Purpose of Data
 Calculation of baseline emissions
Comments
 N/A

Data / Parameter
 EC
Data unit
 MJ per kg of methane
Description
 Energy content of methane
Equations
 3
Source of data
 Default value taken from IPCC 2006 guidance (Section 10.3.2)
Value applied
 55.65
Justification of choice of
 This is a standard property of methane (101.3 kPa, 15 °C).
data or description of
measurement methods In addition, the IPCC Guidelines for National Greenhouse Gas Inventories is
and procedures applied internationally recognizedrecognized, and the data provided in the
 guidelines is peer reviewpeer-reviewed.

 Parameters to be updated each crediting period where new data exists.
Purpose of Data
 Calculation of baseline emissions
Comments
 N/A

 26
VM0041, Version 1.0
 Sectorial Scope 15

Data / Parameter
 EFEnterici,j
Data unit
 kg CH4 per animal group
Description
 Enteric methane emission factor for each animal group
Equations
 1
Source of data
 Calculated using equation 2 or 3 or 5
Value applied
 N/A
Justification of choice of
 To allow for flexibility for potential projects, this methodology provides
data or description of
 different options to calculate baseline emissions.
measurement methods
and procedures applied For option 2 and option 3 the first step in collecting data should be to
 investigate existing national statistics, national industry sources, research
 studies and International Environmental Agencies or FAO statistics.

 National environmental agencies or similar government and research
 institutions have accurate peer-reviewed data on emission factors or Ym
 for each animal group.

 Where no data are available on-site farm measurements can be
 performed (baseline option 1).

 The direct enteric methane measurements for ruminants can be
 conducted using state of the art technologies, well documented in the
 scientific literature and peer reviewpeer-reviewed publications, see
 examples in table 56 in Appendix II.

 Parameters from any source (e.g., IPCC, national agencies, or direct
 measurement) must apply the most conservative value of the uncertainty
 component.

 Parameters to be updated each crediting period where new data exists.
Purpose of Data
 Calculation of baseline emissions
Comment
 Where direct measurements of methane emissions are performed, the
 project proponent or associated partner must demonstrate experience in
 methane measurement technologies (i.e., a professional in the area of
 animal science, livestock health and nutrition who has an M.Sc. or Ph.D. in
 the relevant discipline).

Data / Parameter GWP of CH4

Data unit tCO2/tCH4

Description Global warming potential of methane for 100-year time horizon

 27
VM0041, Version 1.0
 Sectorial Scope 15

Equations 1,56

Source of data IPCC defaults from IPCC Fifth Assessment Report, AR5

Value applied 28N/A

Justification of choice of The IPCC Guidelines for National Greenhouse Gas Inventories is
data or description of internationally recognized, and the data provided in the guidelines is peer
measurement methods reviewpeer-reviewed.
and procedures applied
 To be updated each crediting period where new data exist or accepted by
 Verra.
Purpose of Data Calculation of baseline emissions

Comments N/A

Data / Parameter:
 PE j
Data unit:
 kg CH4 head-1 day-1
Description:
 Average project enteric CH 4 emissions calculated by direct measurements
 using the chosen technology in farm i during the monitoring period (kg
 CH4 head-1 day-1)
Equations
 67
Source of data:
 Measured for each animal group. Data records and study report of farm
 operations.
Value applied
 N/A
Justification of choice of
 To quantify the project enteric CH 4 an animal sample for each group is
data or description of
 selected to perform the direct measurement. The project proponent
measurement methods
 needs to describe the required sampling protocols against objectives
and procedures applied
 conditions. Sampling protocols should includeincluding sufficient numbers
 and sampling times to account for diurnal and postprandial variation in
 CH4. sShould follow as outlined in Appendix II

 All CH4 measurement techniques are subject to experimental variation
 and random errors therefore it should be taken into account when
 reporting the final enteric CH 4 emission value.

 Detailed information can be found in appendix Appendix II.

 Parameter to be updated each crediting period or where the PE value is
 no longer representative (e.g., due to changes in feed regime, animal
 type, weight, production phase, geographic region, and management
 practices) new data must be collected.

 28
VM0041, Version 1.0
 Sectorial Scope 15

Purpose of Data
 Determination and calculation of project emissions
Comments
 Because this requires direct measurements of methane emissions project
 proponent or associated partner must demonstrate experience in
 methane measurement technologies (i.e., a professional in the area of
 animal science, livestock health and nutrition who has an M.Sc. or Ph.D. in
 the relevant discipline).

Data / Parameter:
 ERFEnteric j
Data unit:
 Percentage (dimensionless)
Description:
 Enteric emission reduction factor
Equations
 56 or 67
Source of data:
 Provided by the feed manufacturer for each animal group or calculated
 using equation 6. Data records and study report of farm operations.
Value applied
 N/A
Justification of choice of
 For equation 6 the default percentage value is determined from data
data or description of
 provided by the feed supplement manufacturera meta-analysis published
measurement methods
 in a reputable journal (Option 1).
and procedures applied
 For equation 7 (option 2) the project proponent must provide evidence to
 demonstrate the percentage enteric CH 4 reduction for each animal group.
 The project proponent will need to provide during verification the
 scientific protocol and the results of the measurements. Parameters from
 the feed manufacturer must apply the most conservative value of the
 uncertainty component.
Purpose of Data
 Determination and calculation of project emissions
Comments
 N/A

Data / Parameter:
 EFProductioni,j
Data unit:
 kg CH4 head-1 day-1
Description:
 Average project enteric CH 4 emissions calculated by direct measurements
 using the chosen technology A in farm i during the monitoring period (kg
 CH4 head-1 day-1)
Equations
 2
Source of data:
 Measured for each animal group. Data records and study report of farm
 operations

 29
VM0041, Version 1.0
 Sectorial Scope 15

Value applied
 N/A
Justification of choice of
 To quantify the project enteric CH 4 production per animal samples for
data or description of
 each group are selected to perform the direct measurement (option 1).
measurement methods
 The project proponent needs to describe the required sampling protocols
and procedures applied
 for the relevant project conditions. Sampling protocols should include
 sufficient numbers and sampling times to account for diurnal and
 postprandial variation in CH4. In animal studies the most favoured and
 most scientific method is the calculation of sample size by power analysis
 (Charan and Kantharia, 2013). More detail is provided in Appendix II.

 All CH4 measurement techniques are subject to experimental variation
 and random errors, therefore it should be taken into account when
 reporting the final enteric CH 4 emission value.

 Detailed information on reporting such error can be found in Appendix II.

 Parameter to be updated each crediting period or where the value is no
 longer representative (e.g., feed regime, animal type, weight, production
 phase, geographic region, and management practices).
Purpose of Data
 Determination and calculation of baseline and project emissions
Comments
 Because this requires direct measurements of methane emissions project
 proponent or associated partner must demonstrate experience in
 methane measurement technologies (i.e, at least one team member
 should be a professional in the area of animal science, livestock health
 and nutrition who has an M.Sc. or Ph.D. and working/research experience
 in the relevant discipline)

Data / Parameter:
 EFi,j
Data unit:
 kg CH4 head-1
Description:
 Average enteric CH4 emissions factor for each animal in the group j during
 the monitoring period (country or regional specific factors or Appendix
 IVTtable 4), ( kg CH4 head-1 day-1)
Equations
 45
Source of data:
 Country or regional and population specific factors should be used when
 available, to better reflect the ruminants’ population characteristics.
 Default values provided in Appendix IVTable 4 may be used as an
 alternative where regional values are not available.
Value applied
 N/A
Justification of choice of
 Country or regional specific EF values should be used, when available, to
data or description of
 reflect the ruminant’s characteristics. When using peer review literature
 to obtain these values, draw from reputable journals with a SCI Index.

 30
VM0041, Version 1.0
 Sectorial Scope 15

 measurement methods When not available, use the default values provided in Appendix IVTable
 and procedures applied 4.

 Parameters from any source (e.g., IPCC or national agencies) must apply
 the most conservative value of the uncertainty component, (i.e., a 50%
 reduction must be applied to values taken from Appendix IVTable 4)

 Parameter to be updated each crediting period where new data exists.
 Purpose of Data
 Determination and calculation of baseline emissions
 Comments
 N/A

9.2 Data and Parameters Monitored
 Data / Parameter:
 Nij
 Data unit:
 Number of animals (head)
 Description:
 Average number of head in each animal grouping j in the farm i
 consuming an supplementadditive during the monitoring period.
 Equations
 2, 3, 4, 7, 10, 115 and 7
 Source of data:
 Data records of livestock operations using the feed supplementadditive.
 Farm records.
 Description of
 Farm inventory data must be calculated as the average number of animals
 measurement methods
 in each grouping, taking into account animal entry and exit movements
 and procedures to be
 from the grouping; this is a weighted average approach using the animal
 applied:
 head*days factor; an example is demonstrated in the table below.

 Days on feed Number of head

 1 100

 2 100

 3 103

 Total=3 Avg=101
 Frequency of
 Single value depending on the number of heads in each animal grouping
 monitoring/recording:
 using the natural feed supplementadditive. Measured by daily or weekly
 average records.
 QA/QC procedures to be
 Each farm record must list the number of animals in each group.
 applied:
 Management and monitoring system to be established by the project
 proponent at the start of project. It could include data recording and
 verification procedures.

 31
VM0041, Version 1.0
 Sectorial Scope 15

Purpose of data:
 ● Calculation of baseline emissions

 ● Calculation of project emissions

 ● Calculation of emission reduction
Calculation method:
 No calculations are needed.
Comments:
 Monitoring is established at the feed purchaser level. An appropriate and
 unique identification system for the purchasers, e.g.e.g., Project
 participant name, tax identification number, number of animals in each
 group, unique invoice number and date, would avoid double counting of
 emissions reduction claimed.

 At the time of reporting, baseline and project emissions shall be
 calculated based on livestock population, climatic conditions and other
 factors specific to the project and time period.

Data / Parameter:
 Days
Data unit:
 Days
Description:
 Number of days project activity implemented in the specific animal
 grouping.
Equations
 2, 3, 45, and 67
Source of data:
 Data records of livestock operations using project feed
 supplementadditive
Description of
 None
measurement methods
and procedures to be
applied:
Frequency of
 Once for start date of supplementadditive feeding and once for end date
monitoring/recording:
 of supplementadditive feeding, for each animal grouping
QA/QC procedures to be
 Management and quality control system to be established by the project
applied:
 proponent at the start of project. It could include data recording and
 verification procedures.

 The number of days could be less than 365. For example, in the case of
 young cattle the number of days represents the length of stay in a specific
 animal group.
Purpose of data:
 ● Calculation of baseline emissions

 ● Calculation of emission reduction
Calculation method:
 No calculations are needed

 32
You can also read