ROADSHOW PRESENTATION - September 2023

 
CONTINUE READING
ROADSHOW PRESENTATION - September 2023
ROADSHOW
PRESENTATION
September 2023
ROADSHOW PRESENTATION - September 2023
Platform

The spirit to create dynamic performance
Integrated business model combining property holding company and asset management for 3rd parties

                                             Fully integrated                                                                        Logistics develop-
     Real estate track                                                                                  9 locations with
                                             management                       358   properties1                                      ment pipeline of
     record of 25 years                                                                                 334 employees1
                                             platform                                                                                c. 139,000 sqm1

                  Regional footprint                                            Total portfolio1                       Balance sheet investments1

                                                                                                   Balance sheet
                                                                                                   investments:                      Other2
                                                                                                   EUR 4.1                 Mixed-Use    6%
                                                                                                   billion                       8%
                                                                                                   (29%)
                                                                                                                       Retail                      Logistics
                                                                                                                         8%                            41%
                                                                                    EUR 14.2                                         EUR 4.1
                                                                                     billion                                          billion
                                                                Managed
                                                                 vehicles
                                                            (Institutional
                                                               Business):
                                                                                                                                       Office
                                                                EUR 10.1
                                                                                                                                        37%
                                                                    billion
                                                                    (71%)

1   As of 30 June 2023; 2 Incl. project developments

DIC Asset AG                   2    Roadshow Presentation
ROADSHOW PRESENTATION - September 2023
Platform

The spirit to create diversified income
Real estate management platform of c. EUR 14.2 billion AuM1

c. EUR 4.1 billion AuM                                                       c. EUR 10.1 billion AuM
Balance sheet investments (174 assets)1                                      Managed vehicles (184 assets)1

Balance sheet investments                                                    Managed vehicles
(Commercial Portfolio)                                                       (Institutional Business)

     Directly held portfolio of high quality assets in top locations          Commercial real estate (mainly Core/Core+) held and managed exclusively for
     DIC (original) portfolio with focus on office in A and B cities           institutional clients from Germany and abroad
      (ABBA strategy)                                                          Providing all real estate services (transaction, asset, property and development
     VIB with high quality logistics portfolio along major trading routes      management, financing) and DIC occasionally acts as co-investor
     Generating rental income and income from disposals                       Generating fee income and investment income

1   As of 30 June 2023

DIC Asset AG                     3    Roadshow Presentation
ROADSHOW PRESENTATION - September 2023
Platform

                                           The spirit to create
                                           commitment
                                           The targets we have set reflect our ethics and
                                           our sense of responsibility, including for the
                                           environment.
                                            Environment: We make a positive contribution to mitigating climate change
                                            Social: We shape our business with and for the people
                                            Governance: We are a reliable partner, and conduct our business activities
                                             in a transparent and accountable manner
                                            Digitisation: We use high-tech tools as yet another building block for ESG

DIC Asset AG   4   Roadshow Presentation
ROADSHOW PRESENTATION - September 2023
Commercial Portfolio

The spirit to create success
DIC Asset AG leads the market for office space and logistics properties in Germany.

Overview Commercial Portfolio1                                                                            Overview of top 10 tenants1
                                                                                                                                                              Rental     Asset     No. of
                                                                                                          Tenant                                          income (%)      class    assets

Market value                                                                EUR 4,096.3 million                      Volkswagen AG                             3.8%    Logistics       2
Rental space                                                                     1,880,000 sqm
                                                                                                                     Deutsche Börse AG                         3.3%      Office        1
WALT                                                                                    5.0 years
EPRA vacancy rate                                                                           4.9%                     AUDI AG                                   3.2%    Logistics       2

Gross rental yield                                                                          4.9%                     Geis Industrie-Service GmbH               3.1%    Logistics       3
Avg. rent per sqm per month                                                            EUR 8.52
                                                                                                                     Mercedes Benz AG                          2.9% Mixed-Use          1

 Strong rental cash flow of proprietary portfolio as a solid basis for our                                          DKB Service GmbH                          2.7%      Office        1
  business model
                                                                                                                     Free and Hanseatic City of Hamburg        2.7%      Office        4
 Highly diverse mix of regions, use types and tenants
 C. 26% of market value is located in Top 7 cities in Germany                                                       NH Hotels Deutschland GmbH                2.4% Mixed-Use          1

 C. 800 tenants overall (excl. residential and parking space tenants),                                              State Property and
                                                                                                                                                               2.2%      Office        2
  no dependency on single tenant                                                                                     Construction Administration
 C. 90% of rental contract volume is CPI-linked                                                                     Imperial Logistics International          1.7%    Logistics       1

                                                                                                           Top 10 tenants, total                              28.0%        n/m        18

1   All figures as of 30 June 2023, excl. developments and warehousing (except market value and rental space)

DIC Asset AG                   5    Roadshow Presentation
ROADSHOW PRESENTATION - September 2023
Commercial Portfolio

The spirit to create the right portfolio mix
Focus on logistics and office – continuous optimisation

Commercial Portfolio by asset classes
(as of 30 June 2023)1
                                                                                                                                           As part of the ongoing optimisation of the portfolio,
                                                                                                                                            the two strategic asset classes of logistics and office
                                                          Market value           Rental income p.a.                                         properties now collectively account for 78% of the
                                                                                                           EPRA                             market value of the Commercial Portfolio as of 30 June
                                          No. of                     % of                      % of       vacancy
                                                                                                                                            2023 (30 June 2022: 73%)
    Asset class                           assets       EUR m         total       EUR m         total        rate      WALT
                                                                                                                                           Compared to 30 June 2023, the EPRA vacancy rate
           Logistics                            64     1,680.9          41%          77.9         42%        1.6%         4.8               increased and WALT declined primarily due to disposals
                                                                                                                                            in the second half of 2022 (30 June 2022: 4.2% and 5.7
           Office                               59     1,516.3          37%          73.4         39%        8.4%         5.4               years)
                                                                                                                                           The Green Building ratio slightly increased year-to-date:
           Retail                               12       310.8           8%          15.4          8%        3.0%         5.5

           Mixed-Use                            16       314.9           8%          17.5         10%        8.7%         4.1

           Other                                18         50.9          1%           2.3          1%        3.8%         1.7                                  32%
                                                                                                                                                              Green
           Project developments                    5     222.5           5%           n.a.         n.a.        n.a.       n.a.
                                                                                                                                                             Buildings2
    Balance sheet portfolio                   174      4,096.3        100%         186.5        100%         4.9%         5.0

1   All figures without project developments and repositioning properties, except for number of properties, market value and rental space; 2 Market value of Green Buildings in relation to market value of
    Commercial Portfolio excl. project developments, Green Buildings defined under the DIC Green Bond Framework: https://www.dic-asset.de/download/publikationen/DIC-Green-Bond-Framework.pdf

DIC Asset AG                    6   Roadshow Presentation
ROADSHOW PRESENTATION - September 2023
Institutional Business

The spirit to create investment solutions
Generating recurring fees through one-stop solutions for institutional investors
Management fee elements

                                                                                                                            Promote/performance fee (one time, success based)
    Acquisition and setup fee                                  Asset/property management/
    (one time, not success based – recurring)                  development fee (recurring)
                                                                                                                            Exit fee (one time, not success based – recurring)

7 vehicles in investment phase                                25 vehicles in holding phase
(AuM EUR 3.1 billion)1                                        (AuM EUR 7.0 billion)1

                                                                                                                                                         Sale
                                                                                                                                                         Possible reinvest-
                                                                                                                                                         ment of proceeds
                                                                                                                                                         into new invest-
                                                                                                                                                         ment vehicles
                                                                                   Holding
                                                                                    Execution of the respective, individual property strategy
        Acquisition/Transfer of warehoused properties
                                                                                     for the realisation of value enhancement potential
         Acquisition financed with committed equity and bank financing             Repositioning of assets and ongoing reletting activities
          up to 50% LTV on purchase price
                                                                                    Optimised properties are managed and a stable cash
         Occasionally warehousing of selected assets as an accelerator              flow is ensured
          of funds
                                                                                    ESG and digitisation as innovation drivers

1   Based on AuM as of 30 June 2023

DIC Asset AG                 7   Roadshow Presentation
ROADSHOW PRESENTATION - September 2023
Institutional Business

The spirit to create long-term partnerships
High granularity of investor base: no dependency from one single mandate
AuM by asset class1
in %           Other 4%                                                                              DIC currently manages 32 vehicles (17 pool funds totalling EUR 6.3 billion,
              Mixed-use 5%                                                                            8 club deals totalling EUR 1.8 billion and 7 separate accounts (as well as
                   Retail 6%                                                                          third-party mandates) totalling EUR 2.0 billion) for a total of 171
                                                                                                      institutional investors
           Logistics 11%                   AuM                                                       Around 58% of equity comes from investors who have invested in more
                                         EUR 10.1                  Office 74%                         than one DIC investment product
                                          billion                                                    Diversifed investor base: no investor has a higher share than 11% of the
                                                                                                      total committed equity
                                                                                                     Core and core+ investements make up the vast majority of AuM as of 30
                                                                                                      June 2023 (c. 93%). C. 66% of market value is located in Top 7 cities in
Investment partners2                                                                                  Germany.
in %                                                                                                 At present, around EUR 180 million in committed equity is still available for
                                                                                                      further acquisitions or forward deals that have already been notarised
           Family offices
                    13%                                                                              Fundraising for as-yet-unplaced shares in the “VIB Retail Balance I” fund
                                                                   Pension funds,
                                                                                                      and the single investment in the “Offenbach Unite” property continues on
                                                                   sovereign
                                                                   wealth funds                       an ongoing basis. These shares are recognised in the consolidated balance
                Insurance                                          34%                                sheet as “non-current assets held for sale” as at 30 June 2023
               companies
                     26%

                                                                   Savings banks,
                                                                   banks
                                                                   27%

1   Percentages based on AuM as of 30.06.2023; 2 Percentages based on committed equity as of 30.06.2023

DIC Asset AG                   8   Roadshow Presentation
ROADSHOW PRESENTATION - September 2023
Strategy

Highlights H1 2023
Setting the right course for DIC‘s future

                                                               LIQUIDITY                             OPERATIONAL
                                                              MANAGEMENT                               RESULTS
    •   New syndicated loan of
        EUR 505 million with                              EUR 485 million                        Lettings y-o-y     •   Strong letting activities with
                                                                                                                        257,900 sqm of take-up
        seven-year term                                    cash at hand1                             +50%               despite challenging market
    •   Notarised disposals                                                                                             environment
        of EUR 132 million
                                                                                                                        Asset classes Logistics and
        by end of June                                                                            Like-for-like     •
                                                                                                                        Office now representing
    •   First capital raising of                                                                rental growth of        c. 78% of total market value
                                                                                                                        of the Commercial Portfolio
        EUR 10 million for new
        Club Deal with property
                                                                                                      7.3%
        “Offenbach Unite”

                                                           OPTIMISING                                  FINANCIAL
                                                       FINANCIAL STRUCTURE                              RESULTS

    •   Repayment of bridge                              Bond LTV of 55.3%                      H1 2023 FFO         •   Due to lack of transaction
                                                                                                                        activity and higher interests,
        financing in a volume of
        c. EUR 200 million plus                                                                 down y-o-y to           full year guidance 2023
                                                                                                                        adjusted in early July
        prolongation of remaining
        EUR 200 million until the end
                                                             Bond ICR 2.6x                     EUR 22.4 million
                                                                                                                    •   Additional write-downs on
        of July 2024                                                                                                    disposals negatively impact
                                                     Average interest rate of                  Net result for the       the profit for the period
                                                              2.9%                                 period of        •   New action plan
                                                                                               EUR –16.6 million        „Performance 2024“
                                                                                                                        implemented

1   Prior to the partial repayment of the VIB Bridge Loan in the amount of EUR 200.8 million

DIC Asset AG                    9   Roadshow Presentation
ROADSHOW PRESENTATION - September 2023
Strategy

„Performance 2024“ action plan
Five key priorities to cope with the current market environment

                                                   12–18 months timeframe

               Focus                               Measures                                      Actions
                                                                                                                                                  Returning to
                                                                                                                                                  normalised
                                                                                                                                                  FFO path
                                                                                                                                                  from 2024
                                                                                                                                                  onwards

           Reducing liabilities and                Decreasing LTV          Equity release from disposals to be used for
   1
           boosting liquidity                    Stabilising Bond ICR      further pay down of debt

                                                                           Ongoing high letting results with strong like-for-like rental growth
                                                                           (incl. indexations) in 2023 et seqq., steady increase of
   2       Portfolio management                   NAV / EPRA NTA           Green building quota (now at c. 32%), selective refurbishments,
                                                                           portfolio devaluation of c. 4% to 7% at year-end expected

                                                                           Selective reorganisation, optimisation and increasing efficiency
   3       Increasing cost efficiency                  Lower OPEX          through redirection of workflows, OPEX to be reduced by
                                                                           5% to 10%, mainly from 2024 onwards

           Portfolio optimisation                 Increasing liquidity,    Targeting EUR 300 to 500 million notarised disposals from
   4       through transactions                 reducing portfolio risks   Commercial Portfolio in 2023

           Reliable business partner            New equity inflow and      Further placement of fund shares and setting up of new
   5
           for 3rd parties                      additional fee income      investment strategies for our 3rd party clients

DIC Asset AG              10   Roadshow Presentation
Operations

H1 2023: platform overview
Strong letting performance and like-for-like rental growth of 7.3%
Letting performance                                   Assets under Management
in sqm                                                in EUR billion

Like-for-like rental income                           Lease expiry volume, total platform
annualised in EUR million                             in % of annualised rental income

DIC Asset AG            11    Roadshow Presentation
Financials

H1 2023: income overview
Higher contribution from directly-held portfolio,
lack of transaction-related income
Net rental income                                               Real estate management fees
incl. VIB since Q2 2022
                                                                          AM/PM/Dev. Fees        Transaction and performance fees
                                                       85.0
                                                                             39.5
                  65.3
                                                                                                                    21.8
                                                                              22.1

                                                                              17.4                                   21.8

                H1 2022                               H1 2023               H1 2022                                H1 2023

Income from associated companies                                Recurring income
                                                                Rents and management fees

                                                                              104.8                                   106.8

                  16.9

                                                                  79%                                                               100%
                                                                  Rec.                                                              Rec.
                                                        2.8

                H1 2022                               H1 2023                H1 2022                                 H1 2023

                                                                             Rents     Mgmt. fees (rec.)   Mgmt. fees (non-rec.)
   All figures in EUR million

DIC Asset AG                    12   Roadshow Presentation
Financials

H1 2023: Funds from Operations (FFO)1
                                         2
                           1
                                       +4.4
                        +19.7                                                                                                      1•   Net rental income growth from
                                                                                                                                        VIB consolidation and like-for-like
                                                                                                                                        increases of rents
                                                                                                                                   2•   Increase of recurring
                                                                                        4                                               management fee income but lack
            53.0                                                                                                                        of transaction-related fee income
                                                                                      +10.6
                                                   –22.1                        4                                                  3•   Lower transaction-related income
                                                                –4.0
                                                      2
                                                                               +0.1                                                     from associates and joint venture
                                                                 3                                                                      disposal effect in prior-year lead
                                                                       –10.1                  –10.1                                     to lower share of the profit of
                                                                         3                      5                                       associates
                                                                                                      –10.5                        4•   Transaction cost effect in prior-
                                                                                                                            22.4
                                                                                                        5                               year and first cost efficiency
                                                                                                              –6.9                      measures improve OPEX
                                                                                                                     –1.7
                                                                                                                                   5•   Increase of interest expenses by
                                                                                                                                        EUR 10.1 million due to VIB
                                                                                                                                        consolidation and refinancing
                                                                                                                                        activities and EUR 10.5 million
                                                                                                                                        due to unhedged interest costs
                                                                                                                                        for VIB bridge

   1   Excluding non-controlling interest (NCI), before taxes

DIC Asset AG                      13     Roadshow Presentation
Financials

H1 2023: financial profile
Focus on deleverage while monitoring covenants

 Maturities of loans and borrowings, nominal values in EUR million                          Average interest rate       • VIB bridge loan was renegotiated, an additional
 as of 30 June 2023                                                                                                        amount of EUR 201 million was repaid in July
                                                                                                                           2023
                                                                                                                        • Remaining financial maturities in 2023 (mainly
 1.600         4.1%                3.7%                2.9%               2.3%             2.6%             2.8%           EUR 150 million 18/23 bond) covered by
                                                                                                                           remaining cash on hand after recent bridge loan
                                                                                                                           repayment (pro-forma c. EUR 284 million)
 1.400
                       Paid back
                                                                                                                        • Remaining bridge loan in 2024 will be paid back
                                                                                                             51            from equity release of disposals and
                      in July 2023
 1.200                                                                                                                     free cash flow
                                                                                                                        • Bank debt 2024 already in refinancing process
                                           In refinancing
 1.000                                         process                                                                  • Bond covenants at 30 June 2023 with sufficient
                                                                                                                           headroom:
                                                                                                                           − Bond LTV 55.3% (covenant level 60.0%)1
    800
                                                                                                                           − Secured LTV 25.0% (covenant level 45.0%)1
                                                                                                                           − Bond ICR 2.6x (covenant level 1.8x)2
    600                                                                                                    1.239
                                                                                                                        • LTV covenants will be challenged by expected
                                                                          144
                                                                                                                           portfolio devaluation, but stabilised by disposals
                                   200
    400                                                                                                                 • ICR covenant challenged by bridge costs and
                                                                                                                           low fee income in 2023 but should see a
               201    9            248                                    400                                              turning point in 2024
    200                                                68                                   43
                       9                                                                                                • Average interest rate of 2.9% reflects high cost
               150                 133                 157                                 156                             of debt of short-term maturities
                      16                                                  81
       0
               2023               2024                 2025           2026                2027         2028 and later

                             Bank debt     Bonds       Promissory Notes         Other   VIB Bridge                        1   Incurrence-based; 2 Maintenance-based

DIC Asset AG            14     Roadshow Presentation
Financials

Outlook 2023
Updated guidance confirmed

                    Gross rental income                         EUR   185–195 million

                    Real estate management fees                 EUR   50–55 million

                    FFO I (after minorities and before taxes)   EUR   50–55 million

                    Acquisitions                                EUR   c. 100      million, thereof:
                                                                Commercial Portfolio: no acquisitions
                                                                Institutional Business: c. EUR 100 million

                    Disposals                                   EUR   300–600           million, thereof:
                                                                Commercial Portfolio: EUR 300–500 million
                                                                Institutional Business: EUR 0–100 million

DIC Asset AG   15    Roadshow Presentation
Other

  Contact
   Financial calendar

   2023

   12.09.        SRC Forum Financials + RE 2023

   20.09         Baader Investment Conference 2023

   26.09         Degroof Petercam's Real Estate Conference

   08.11.        Publication Quarterly Statement Q3 2023

   28.11         German Equity Forum 2023

                                                             Peer Schlinkmann               Maximilian Breuer, CFA
                                                             Head of Investor Relations &   Senior Investor Relations Manager
                                                             Corporate Communications

                                                             Tel. +49 69 94 54 858-1492     Tel. +49 69 94 54 858-1465
                                                             Fax +49 69 94 54 858-9399      Fax +49 69 94 54 858-9399
                                                             ir@dic-asset.de                ir@dic-asset.de

                                                                                                                      More information   Follow us

DIC Asset AG                 16    Roadshow Presentation
Appendix

                                            More facts and figures.

DIC Asset AG   17   Roadshow Presentation
Platform

Benefits of our platform-driven business model
Leveraging the platform for stronger cash flow with lower risk profile

Transact
Superior market penetration
• Close relationships to all relevant participants (real estate agents,
   financing banks)
•     EUR 3.3 billion transaction volume in 2022 (incl. EUR 2.3 billion for
      VIB)

Operate
Full regional coverage in Germany through
• 9 locations with 212 out of 334 people on the ground1
•     Cost synergies and economies of scale (one headquarter,

                                                                                360°
      one investment team, etc.)

Develop
ESG strategy for the whole portfolio                                          Value Creation
Refurbishment capabilities for the whole platform lead to:
• Recurring profits from disposal (balance sheet portfolio)
•     Promote and performance fees (managed vehicles)

Match
We connect assets, investors and tenants
Constantly improving portfolio KPIs (WALT vacancy rate, price per sqm)
Institutional Business deal generation through Warehousing capabilities:
•     Seed portfolios for institutional investors
•     Generation of off-market transactions

1   As of 30 June 2023

DIC Asset AG                18    Roadshow Presentation
Platform

Fully integrated service model
In-house competence for provision of full suite of value-adding services (incl. ESG)
                                                                                                                                                                                Employees1
               Corporate functions
                                                                                                                                                                                   80
                 Acquisition                                                 Value enhancement & preservation                                                   Exit

                                                                                                                                                                                   42
                                                      Portfolio/fund                Asset                 Property                                        Investment
       Investment               Financing                                                                                           Development
                                                       management                management              management                                       management
                                                                                                                                                                                  212

 Deal sourcing           Review of financing       Portfolio management  Property strategies       Condition control          Development and     Contract negotiation
  and structuring          structures                Structuring of        Business plans             of the property            refurbishment        Closure
 Due diligence           Bank selection,            investment vehicles                              Inspections of             know-how
 ESG due diligence        tendering,
                                                                            Representation of
                                                     Investor reporting     the owner’s interests      technical installations    (Green) CAPEX
 Off-market deals and     benchmarking
  bidding procedures      Contract negotiation      Performance analysis  Increase in rental        Repairs
 Contract negotiation     and closure               Risk and compliance    income                    Object accounting
 Closure                 Fulfilment of the pay-                           Optimisation of            and service charge
                                                     Sustainable Finance                               settlement
                           out condition                                       running costs and
                                                     Disclosure Regulation
                          Administration                                      energy efficiency
                                                     (SFDR)
                           and reporting,
                                                                               Refurbishments
                           ESG link
                                                                               Control of property
                                                                               management

                                  9 branches in Germany (incl. VIB Vermögen AG) responsible for 358 properties and gross lettable area of 4.8 million sqm1
                                  Onsite teams operate nationwide to ensure portfolio value is maintained and increased through an active asset management approach
             USP                  Direct access to tenants, target-oriented letting management, planning and implementation of CAPEX/TI measures
                                  Regulatory reporting & risk management services (KVG) outsourced

1   As of 30 June 2023

DIC Asset AG               19    Roadshow Presentation
Commercial Portfolio

Top 20 assets in Commercial Portfolio1
As at 30 June 2023, by market value2
                   Location                  Address                                            Type                 Rental space               EPRA         Annualised        Market value              WALT
                                                                                                of use                 thsd. sqm             vacancy       rental income        EUR million              Years2
                                                                                                                                             rate (%)2      EUR million2
        1      Kösching                     Zeppelinstr. 33                                     Logistics                    115.2                0.0                 9.0              253.6                    7.2
        2      Berlin                       Taubenstr. 7-9                                      Office                        10.1                0.0                 5.0              115.0                    3.5
        3      Düsseldorf                   Werdener Str. 4                                     Mixed-Use                     29.7               11.3                 6.0              112.4                    3.9
        4      Kösching                     Einsteinstr. 6                                      Logistics                     54.7                0.0                 3.8               91.0                    2.3
        5      Nürnberg                     Beuthener Str. 43 ff                                Logistics                     98.8                5.5                 5.0               80.5                    3.3
        6      Regensburg                   Osterhofener Str. 8-19                              Logistics                     38.6               13.7                 4.1               74.9                    2.5
        7      Frankfurt                    Insterburger Str. 7a                                Office                        14.3                6.6                 6.3               74.2                    1.9
        8      Munich                       Georg-Brauchle-Ring 56, 58                          Office                         9.2                1.3                 2.7               74.0                    1.8
        9      Halle                        Neustädter Passage 17 a-d                           Retail                        30.7                1.0                 4.4               73.2                    6.3
       10      Eschborn                     Frankfurter Str. 1                                  Office                         9.3                0.0                 3.0               73.1                    5.1
       11      Cologne                      Mercedes-Allee 1                                    Mixed-Use                     23.4                0.0                    3              71.3                      3

       12      Hamburg                      Marckmannstr. 129 a-e                               Office                        23.4                0.0                 2.8               65.7                8.5
       13      Neufahrn                     Lilienthalstr. 6                                    Logistics                     35.0                0.0                 3.1               63.6                4.4
       14      Erlangen                     Kraftwerkstr. 25                                    Logistics                     32.0                0.0                 2.3               63.4                2.5
       15      Erlangen                     Kraftwerkstr. 21-23                                 Logistics                     30.1                0.0                 2.1               60.2                5.3
       16      Frankfurt                    Kaiserstr. 62-64                                    Mixed-Use                      9.3                4.9                 2.4               57.9                9.7
       17      Leverkusen                   Horst-Henning-Platz 1                               Office                        13.4                0.0                 2.4               57.2               11.7
       18      Duisburg                     Steinsche Gasse 26                                  Office                        12.6                0.0                 2.4               56.9               13.5
       19      Frankfurt                    Königsberger Str. 29                                Office                        12.7               16.3                 2.2               52.0                7.6
       20      Wiesbaden                    Gustav-Stresemann-Ring 12-16                        Office                        26.1               34.8                 2.9               49.9                4.1
    Top 20 properties                                                                                                        628.6                5.2                77.2            1,620.0                4.9
    Other properties                                                                                                       1,251.4                 4.8             109.3             2,476.3                    5.0
    Total properties (excl. Warehousing)                                                                                   1,880.0                 4.9             186.5             4,096.3                    5.0
    Properties in Warehousing                                                                                                  0.0                n.a.                0.0                0.0                n.a.
    Total properties                                                                                                       1,880.0                 4.9             186.5             4,096.3                    5.0

     Green Buildings

1   Top 20 list without non-strategic properties and properties earmarked for current or future repositioning activities; 2 all figures without project developments and repositioning properties, except for
    number of properties, market value and rental space; 3 Not disclosed due to reasons of competition

DIC Asset AG                    20   Roadshow Presentation
Commercial Portfolio

Strong repositioning capabilities –
case study Darmstadt
Phase 1: repositioning phase on balance sheet
11/17–04/20
Complete renovation, energy modernisation and structural
alterations for handicap accessability; energy savings of
around 40%; long-term rental contract with State of Hesse
(Regierungspräsidium Darmstadt)
 Market value old (12/17):            EUR 60.5 million
 CAPEX/TI:                            EUR 31.9 million
 Market value new (06/20):          EUR 113.0 million

                                                                360 degrees
Phase 2: transfer to new fund managed by DIC                   value creation
12/20–01/21                                                       on DIC’s
                                                                  platform
 Transfer to biggest open-ended institutional fund in
  company’s history (part of the seed portfolio of a total
  EUR 780 million AuM, together with three other Core office
  properties)
 Disposal at market value plus additional management fees
  for setup, paid in Q4 2020 ahead of the transfer
 Transfer of ownership end of January 2021, net disposal
  profit of c. EUR 12.0 million in P&L Q1 2021
 Ongoing fees for asset and property management

DIC Asset AG            21    Roadshow Presentation
Commercial Portfolio

Constantly improving portfolio KPIs

Growing balance sheet portfolio …                                          … leading to robust annualised rental income & higher sqm prices
Fair value of investment properties (EUR million)1                         in EUR million (excl. Warehousing)

                                                                                                                                11.39     8.26
                                    >+100%

                                                                   4,452                                                                 203.8

                       1,900          2,000          2,222                      97.6           101.8            95.8            105.5
      1,697

       2018            2019           2020           2021          2022        2018             2019            2020            2021      2022
                                                                              Average rent per square meters p.m. (EUR)

Strong letting activities leading to reduction in vacancy rate …           … and stable level of WALT
EPRA vacancy rate %1                                                       (Incl. attractive new acquisitions/VIB), in years1
                                     –2.9 pp

       7.2%
                       6.5%
                                      5.4%           5.3%                        5.8             6.0             6.5             5.9
                                                                   4.3%                                                                   5.5

       2018            2019           2020           2021          2022        2018             2019            2020            2021     2022

1   As of 31 December 2022

DIC Asset AG                 22   Roadshow Presentation
Institutional Business

      Income from Institutional Business
      Strong base of recurring fee income
                                                             Types of fees                                 Recognition of fee income                                              Classification

                                                                                                              Warehousing income
                                                               Setup1
                                   Sourcing/                                                                  Set up fees for new investment vehicles
                                                                                                                                                                                   Transaction
                                   acquisition                                                                Transaction fee income recognised as percentage
                                                               Acquisition
Real estate investment lifecycle

                                                                                                               of transaction volume

                                   Investment/                 Asset/property management                      Recurring fee income recognised as percentage of AuM                Asset/property
                                   property                                                                                                                                        management/
                                   management                                                                 Repositioning of office and retail projects generally recognised    development
                                                               Development
                                                                                                               as percentage of construction cost

                                                                                                              Transaction fee income recognised as percentage
                                                               Sales fees                                                                                                          Transaction
                                                                                                               of transaction volume
                                   Exit/
                                                               Promote                                        Income recognised upon successful exit of sale of the properties
                                   Realisation
                                                                                                                                                                                   Performance
                                                                                                              Fee payable when return hurdles of investment vehicle
                                                               Performance fees
                                                                                                               are met or exceeded

                                                             Equity return from co-investments             Recognition of equity return                                           Classification
                                                                                                              Regular equity return from own investment in DIC investment
                                                               Equity return                                                                                                       Equity return
                                                                                                               vehicles (fixed return levels)
                                   Dividend
                                                                                                              Gain in value of equity stake in investment vehicle following
                                                               Return upside                                                                                                       Equity return
                                                                                                               positive performance

                                    Recurring (not success based)       One time (success based)

      1              Setup fee for new investment vehicles where DIC secures 1–2 properties as start assets for the investment vehicle

      DIC Asset AG                                23    Roadshow Presentation
Institutional Business

Deal structures tailored
to investor needs
Pool funds                                                           Club deals                                             Separate accounts
 Pool funds specialised in regions or asset classes                  Investments for institutional investment partners     We initiate joint investment strategies for
  with a proven track record                                           in real estate in Germany's top 10 markets for         selected investment partners within the
 Funds legally structured as special funds under                      commercial real estate, either in single-asset or      framework of individual mandates
  the German or Luxembourg regime                                      portfolio transactions                                The investment strategies may not interfere with
 Joint investments with investment partners,                         DIC secures property(ies) in order to mitigate the     the existing pool funds and club deals
  co-investment by DIC                                                 transaction uncertainty; the investment partners
 Strong individual property size                                      then join

 Typically a portfolio of 7–8 properties
  acquired over time

 Individual property EUR 20–60 million                               Individual property sizes                             Individual property sizes
 Typically a portfolio of 7–8 properties                             Typically 2–3 properties with                         Typically individual property;
  acquired over time                                                   2–3 institutional investors                            no portfolio investments

EUR 6.3 billion1                                                     EUR 1.8 billion1                                       EUR 2.0 billion1

1   AuM 30 June 2023; separate accounts incl. third-party mandates

DIC Asset AG                 24    Roadshow Presentation
Institutional Business

Institutional Business
portfolio spotlight
Top performing properties in Germany’s most significant markets

                                                                                                                     Frankfurt
                                                                                                                     WINX
Frankfurt                Dusseldorf           Dusseldorf                                                             Type: Development
Goldenes Haus            Business Campus      CABO
Type: Club deal          am Park              Type: Manage-to-
                         Type: Club deal      core (value)

                                                                                    Hamburg

                                                                                                                     Frankfurt
Frankfurt                Cologne              Hamburg                                                      Berlin    Global Tower
Japan Center             Triforum             Elbspeicher                                                            Type: Individual mandate (under
Type: Individual         Type: Club deal      Type: Value-add                                                        refurbishment)
                                                                     Dusseldorf
mandate
                                                                     Cologne

                                                                        Frankfurt

Frankfurt                Frankfurt            Munich
IBC Campus               Eurotheum            Junges Quartier
                                                                                  Mannheim
Type: Club deal          Type: Individual     Obersendling
                                                                                    Stuttgart
                                                                                                                     Munich
                         mandate              Type: Infrastructure                                   VIB | Neuburg   Sapporobogen
                                                                                                                     Type: Club deal
                                                                                                        Munich

Frankfurt
Garden Tower
Type: Individual
mandate                                                                                DIC Offices
                                                                                                                     Berlin
                                                                                                                     Pressehaus Alexanderplatz
                                                                                                                     Type: Individual mandate
DIC Asset AG                25   Roadshow Presentation
Financials

Adjusted NAV
Slight year-to-date decrease to EUR 21.19 per share

Reconciliation of Net Asset Value (NAV) to Adjusted NAV                                                                                       Net Asset Value (NAV) per share decreased
all values in EUR per share                                                                                                                    to EUR 17.66 (31 December 2022:
                                                                                                                                               EUR 18.29), mainly due to the negative
                                                                                                                                               net result in H1 2023 and the dividend
                                                                                                                                               payment for FY 2022 (incl. slight dilution
                                                                                               +6.26             -2.73                         from scrip dividend)
                                                                                                                                              Adjusted NAV per share decreased similarly
                                                                                                                                 21.19
                                                                                                                                               to EUR 21.19 (31 December 2022:
                                                                                                                                               EUR 21.84)
                                                                     +5.36         17.66                                                      Per share figures calculated with 83,566
                                                                                                                                               thousand shares outstanding at the end of
                                                                                                                                               June 2023
   13.26             -0.18               -0.78
                                                       12.30

  Equity*         Net result*        Other changes     Equity*       Fair value      NAV          IBU       Less goodwill +      Adjusted
31.12.2022          for the            in equity     30.06.2023   adjustment of   30.06.2023   fair value   other intangible       NAV
                    period                                         IP and other                             and other assets    30.06.2023
                   H1 2023                                         adjustments                                and liabilities

* Excl. non-controlling interests

DIC Asset AG                    26    Roadshow Presentation
Financials

P&L – Commercial Portfolio segment
Strong rental growth after VIB integration

Commercial Portfolio                                                                     Segment reporting
                                                                                         in EUR million                                 H1 2023                               H1 2022
• Comparability with the prior-year quarter is only possible to a limited extent, as                                      Commercial         Instit.    Total   Commercial        Instit.    Total
                                                                                                                            Portfolio     Business                Portfolio    Business
    VIB was not yet included in the first quarter of 2022.
                                                                                         Gross rental income (GRI)              96.6                   96.6           75.2                  75.2
• Due to good letting performance in the first half of 2023 with a like-for-like         Net rental income (NRI)                85.0                   85.0           65.3                  65.3
    growth of the directly received rental income of 4.8 %, but also due to the
                                                                                         Profits on property disposals            8.2                    8.2          12.4                  12.4
    first-time recognition of VIB in the first half of 2022, the net rental income
    rose to EUR 85.0 million (previous year: EUR 65.3 million).                          Real estate mgmt. fees                            21.8        21.8                     39.5        39.5

                                                                                         Share of the profit or loss of
• Operating expenses increased to EUR 11.4 million in the first half of 2023             associates
                                                                                                                                  1.4        1.4         2.8          12.1        4.8       16.9
    (previous year: EUR 7.8 million, adjusted for EUR 10.6 million in one-off            Depreciation                          -58.2        -2.0       -60.2         -27.4       -4.3       -31.7
    effects from the VIB transaction in 2022), primarily because VIB was                 Net other income                         0.3                    0.3            1.1                   1.1
    integrated for the entire six months of the current financial year, whereas its      Net interest result                   -45.1         0.0       -45.1         -23.0       -1.5       -24.5
    initial consolidation on 1 April 2022 meant it was only integrated for three         Operational expenditure
                                                                                                                               -11.4      -22.0        -33.4         -18.4     -25.7        -44.1
    months in the previous year.                                                         (OPEX)
                                                                                         - of which admin costs                  -3.7       -7.6       -11.3         -13.4       -9.3       -22.7
• The net interest result of EUR -45.1 million (previous year: EUR -23.0 million)        - of which personnel costs              -7.7     -14.4        -22.1           -5.0    -16.4        -21.4
    fell in particular due to the interest costs for the bridge financing concluded in
                                                                                         Other adjustments                        2.4        0.2         2.6            8.7       0.0         8.7
    the previous year and due to one-off financing costs of EUR 1.1 million.
                                                                                         Non-controlling interests             -10.6        -1.0       -11.6           -9.9       0.0        -9.9

• The segment's FFO contribution fell to EUR 22.0 million after deduction of             Funds from operations
                                                                                         (FFO) after non-controlling            22.0         0.4       22.4           35.9      17.1        53.0
    minorities (previous year: EUR 35.9 million). This is mainly due to the              interests
    significantly higher interest expenses compared to the previous year.                Funds from operations II
                                                                                         (FFO II) after non-                    29.5         0.4       29.9           48.3      17.1        65.4
• The segment’s FFO II contribution that includes the value added by disposals           controlling interests

    was at EUR 29.5 million (previous year: EUR 48.3 million).

DIC Asset AG             27   Roadshow Presentation
Financials

P&L – Institutional Business segment
Increase of recurring management fees

Institutional Business                                                                 Segment reporting
                                                                                       in EUR million                                 H1 2023                               H1 2022
• Real estate management fees from asset management, property management                                                Commercial         Instit.    Total   Commercial        Instit.    Total
                                                                                                                          Portfolio     Business                Portfolio    Business
    and development fees rose year-on-year to EUR 21.8 million (previous year:
                                                                                       Gross rental income (GRI)              96.6                   96.6           75.2                  75.2
    EUR 17.4 million). In the prior-year period, additional transaction and
                                                                                       Net rental income (NRI)                85.0                   85.0           65.3                  65.3
    performance fees of EUR 22.1 million were received. Overall, real estate
    management fees amounted to EUR 21.8 million compared with EUR 39.5                Profits on property disposals            8.2                    8.2          12.4                  12.4
    million in H1 22.
                                                                                       Real estate mgmt. fees                            21.8        21.8                     39.5        39.5
• At EUR 1.4 million, the share of the profit or loss of associates is down y-o-y      Share of the profit or loss of
                                                                                                                                1.4        1.4         2.8          12.1        4.8       16.9
    due to the lower transaction-related income (previous year: EUR 4.8 million).      associates
                                                                                       Depreciation                          -58.2        -2.0       -60.2         -27.4       -4.3       -31.7
• Despite the y-o-y increase in assets under management, operating expenses at         Net other income                         0.3                    0.3            1.1                   1.1
    EUR 22.0 million were down around 14% on the previous year. This was               Net interest result                   -45.1         0.0       -45.1         -23.0       -1.5       -24.5
    mainly the result of lower transaction activity compared to the prior year, with   Operational expenditure
                                                                                                                             -11.4      -22.0        -33.4         -18.4     -25.7        -44.1
    the biggest proportion of cost savings coming from personnel costs, which fell     (OPEX)
    by EUR 2.0 million to EUR 14.4 million (previous year: EUR 14.4 million)           - of which admin costs                  -3.7       -7.6       -11.3         -13.4       -9.3       -22.7
                                                                                       - of which personnel costs              -7.7     -14.4        -22.1           -5.0    -16.4        -21.4
• The segment’s FFO contribution excluding non-controlling interests is                Other adjustments                        2.4        0.2         2.6            8.7       0.0         8.7
    EUR 0.4 million (previous year: EUR 17.1 million).
                                                                                       Non-controlling interests             -10.6        -1.0       -11.6           -9.9       0.0        -9.9
                                                                                       Funds from operations
                                                                                       (FFO) after non-controlling            22.0         0.4       22.4           35.9      17.1        53.0
                                                                                       interests
                                                                                       Funds from operations II
                                                                                       (FFO II) after non-                    29.5         0.4       29.9           48.3      17.1        65.4
                                                                                       controlling interests

DIC Asset AG             28   Roadshow Presentation
Financials

Balance sheet:
Characterised by high liquidity

 1•   Total assets have slightly increased by EUR 41.7 million to EUR 5,222.0              Balance sheet overview
      million since the beginning of the year.

 2•   Non-current assets decreased by EUR 149.3 million to EUR 4,098.3 million
                                                                                                                    1
      (previous year: EUR 4,247.6 million) mainly due to the reclassification of
                                                                                                                    2
      three logistics properties (EUR 115.2 million) to current "non-current assets
                                                                                                                    3
      held for sale".

 3•   The increase in current assets is mainly due to the increase in cash and cash                                 4
      equivalents by EUR 296.7 million to EUR 485.1 million (previous year:
      EUR 188.4 million). The increase primarily results from the net cash inflows
      from financing at VIB in the amount of EUR 181.1 million.

 4•   Compared to 31 December 2022, equity as at 30 June 2023 fell by                                               5
      EUR 77.7 million to EUR 1,586.4 million (31 December 2022: EUR 1,664.1
      million), mainly as the result of the payment of the cash dividend in the                                     4
      amount of approx. EUR 59.6 million and negative consolidated net income
      of EUR -16.6 million euros in the first half of 2023. The balance sheet
      equity ratio stood at 30.4 % as at the reporting date (31 December 2022:
      32.1%).

 5•   Non-current financial liabilities fell only slightly by EUR 2.9 million, while the
      increase in current financial liabilities was mainly due to the partial
      repayment of the bridge financing in the amount of EUR 200.8 million (cash
      outflow occurred after the balance sheet date)

DIC Asset AG              29   Roadshow Presentation
Financials

LTV reconciliation

In EUR million
Assets/                    Balance sheet                          Balance         Adjustment     Other           Reported       Adjustment      Adjusted           DIC reports at historical cost in the
liabilities                items                                  sheet           fair value     Adjust-         LTV            fair value      LTV                 balance sheet. To reflect current market
                                                                  30.06.231       properties     ments                          IBU                                 values, a fair value adjustment is made
                                                                                                                                                                   The company also temporarily holds
Total assets (A)                                                       4,494.1           363.9           -89.2        4,768.8          285.9         5,054.7
                                                                                                                                                                    assets on balance sheet to place them
Real estate assets                                                     3,941.9           363.9        -209.52         4,096.3                        4,096.3
                                                                                                                                                                    into vehicles (other adjustments)
              Investment properties                                    3,529.8           363.9                        3,893.7                        3,893.7
                                                                                                                                                                   The table shows a reconciliation from
              Non-current assets held for sale                           412.1                        -209.52           202.6                          202.6
                                                                                                                                                                    balance sheet items to Reported LTV
Equity investments                                                       188.6                         120.33           308.9                          308.9
                                                                                                                                                                    and Adjusted LTV
              Investments in associates                                    85.9                        120.33           206.2                          206.2
                                                                                                                                                                   Adjusted LTV includes the full value of
              Other investments                                          102.7                                          102.7                          102.7
                                                                                                                                                                    the Institutional Business (fair value
Institutional Business                                                   236.4                                          236.4          285.9           522.3
                                                                                                                                                                    adjustment IBU)
              Goodwill                                                   190.2                                          190.2                          190.2
              Intangible assets and other assets4                          46.2                                          46.2          285.9           332.1
Loans to and receivables from related parties                            127.2                                          127.2                          127.2
Financial liabilities                                                  3,319.8                          -87.95        3,231.9                        3,231.9
              Secured debt / IFRS 5 debt /                             2,776.3                          -87.95        2,688.4                        2,688.4
              Promissory notes
              Corporate bonds                                            543.5                                          543.5                          543.5
Cash                                                                     485.1                                          485.1                          485.1

Net debt (B)                                                           2,834.7                          -87.93        2,746.8                        2,746.8

LTV (=B/A)                                                                                                             57.6%                          54.3%

1   Investment properties at historical cost in balance sheet; 2 EUR 89.2 million assets from several vehicles not included (to be placed) and EUR 120.3 million reclassification of IFRS 5 assets as investments
    in associates; 3 Reclassification of IFRS 5 assets as investments in associates; 4 Service agreements included in balance sheet items „Intangible assets“ and „Other receivables“; 5 EUR 87.9 million debt from
    several vehicles not included (to be placed)

DIC Asset AG                   30    Roadshow Presentation
Other

Shareholder structure
Long-term investment by anchor shareholders, free float of 45.6%1
                                                                                           Basic data on the DIC Asset AG share

                                                                               Deutsche     Shares
                                                                                                                     83,565,510 registered shares
                                                                              Immobilien    outstanding
                                                                               Chancen
                                                                                Group       WKN/ISIN                 A1X3XX/DE000A1X3XX4
    Other free                                                                  34.3%
      float
     42.5%                                                                                  Ticker symbol            DIC

                                   Free float                                               Free float               45.6%

                                   of 45.6%                                                 Exchanges                XETRA, all German exchanges

                                                                                            Segment
                                                                                                                     Prime Standard
                                                                                            Deutsche Börse

                                                                                            Designated               ODDO BHF Corporates & Markets AG,
                                                                                            sponsors                 Baader Bank AG
                                                                        Yannick
                                                                      Patrick Heller
                     Fidelity                                            10.1%              Paying agent             Joh. Berenberg, Gossler & Co. KG
                    Securities
                                             RAG
                      Fund
                                          Foundation
                      3.1%
                                            10.0%

                                            Free Float

1   Based on most recent WpHG notifications and company information

DIC Asset AG                31    Roadshow Presentation
Other

Management
Board
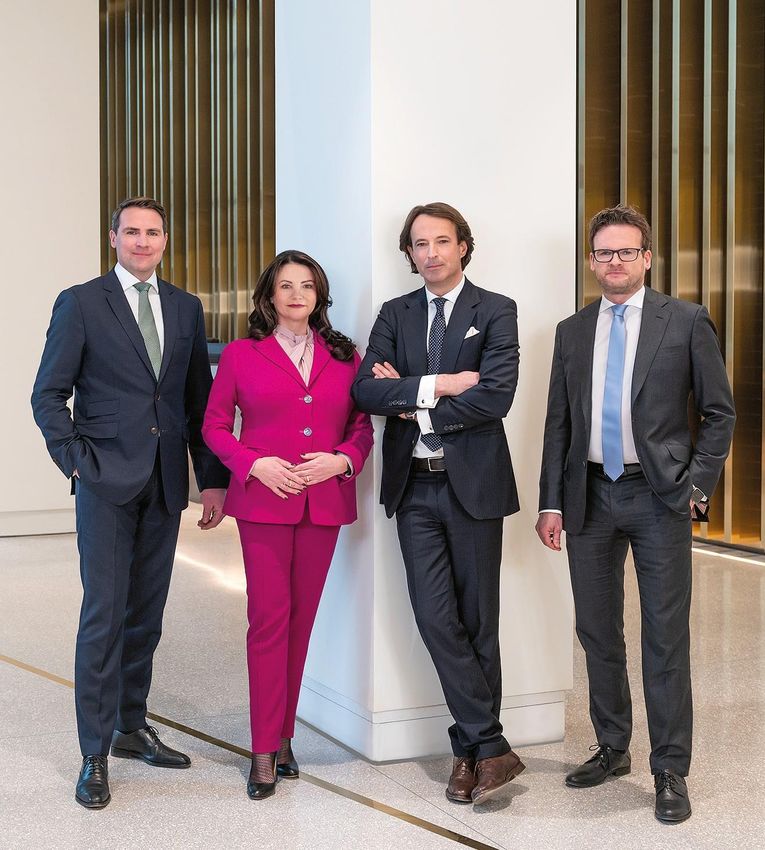
The spirit to create leadership

From left to right:

Christian Fritzsche         Sonja Wärntges
Chief Operating             Chief Executive
Officer                     Officer/ Chief
(COO)
                            Financial Officer
                            (CEO/ CFO)

Johannes v. Mutius          Torsten Doyen
Chief Investment            Chief
Officer                     Institutional
(CIO)                       Business
                            Officer
                            (CIBO)

DIC Asset AG          32   Roadshow Presentation
Other

Supervisory Board
Highly reputable supervisory board members with long-term real estate expertise

Prof. Dr. Gerhard Schmidt                                    Michael Zahn                                Dr. Angela Geerling
Chairman of the Supervisory Board,                           Deputy Chairman of the Supervisory Board,   Portfolio Manager, Schroders Real Estate
Managing Partner Germany of                                  Former Chief Executive Officer of           Asset Management GmbH
Weil, Gotshal & Manges LLP                                   Deutsche Wohnen SE

Eberhard Vetter                                              René Zahnd                                  Prof. Dr. Ulrich Reuter
Head of Investments                                          Chief Executive Officer                     Chairman of the Audit Committee,
of RAG-Stiftung                                              of Swiss Prime Site AG                      President of the savings banks association in
                                                                                                         Bavaria

   Independent, as defined by Deutscher Corporate Governance Kodex (DCGK) as of 28 April 2022

DIC Asset AG             33    Roadshow Presentation
Other

Notes

DIC Asset AG   34   Roadshow Presentation
Other

Notes

DIC Asset AG   35   Roadshow Presentation
Other

Disclaimer

This publication constitutes neither an offer to sell nor a solicitation to buy or subscribe to any securities. In case of an offer of securities the information legally required to be
provided to investors will be contained only in a securities prospectus as approved by the competent authority. The information contained herein is not for distribution, directly or
indirectly, in or into the United States of America (including its territories and possessions of any State of the United States of America or the District of Columbia) and must not be
distributed to U.S. persons (as defined in Regulation S of the U.S. Securities Act of 1933, as amended ("Securities Act")) or publications with a general circulation in the United
States of America. This publication constitutes neither an offer to sell nor a solicitation to buy or subscribe to any securities in the United States of America. None of the securities
of DIC Asset AG have been registered under the Securities Act and may not be offered or sold in the United States of America absent registration or an exemption from
registration under the Securities Act.
This publication is only addressed to and directed at persons in member states of the European Economic Area who are "qualified investors" within the meaning of Article 2(e) of the
Prospectus Directive (Directive 2003/71/EC as amended) ("Qualified Investors"). In addition, in the United Kingdom, this publication is being distributed only to, and is directed only at,
Qualified Investors who (i) are persons who have professional experience in matters relating to investments falling within Article 19(5) of the Financial Services and Markets Act 2000
(Financial Promotion) Order 2005, as amended (the "Order"), (ii) are high net worth entities falling within Articles 49(2)(a) to (d) of the Order, or (iii) are other persons to whom it may
otherwise lawfully be communicated. This presentation should not be regarded by the recipient as a substitute for the exercise of its own judgment. Nothing contained herein is, or shall
be relied upon as, a promise or representation as to the past or future. No representation or warranty, expressed or implied, is made as to, and no reliance should be placed on, the
fairness, accuracy, completeness or correctness of the information, or opinions contained in this presentation. Neither DIC Asset AG nor any of its advisors or representatives shall have
any responsibility or liability whatsoever (for negligence or otherwise) for any loss howsoever arising from any use of this document or its contents or otherwise arising in connection
with this presentation.
This presentation speaks as at the date hereof (unless an earlier date is otherwise indicated in the presentation) and in giving this presentation, no obligation is undertaken and nor
is any representation or undertaking given by any person to provide the recipient with additional information or to update, revise or reaffirm the information contained in this
presentation or to correct any inaccuracies therein which may become apparent. This presentation may contain certain forward-looking statements, forecasts, estimates, strategic
targets, projections and opinions ("Forward Statements"). No representation is made or will be made that any Forward Statements will be achieved or will prove to be correct.
Actual future results and operations could vary materially from the Forward Statements. Similarly, no representation is given that the assumptions disclosed in this presentation
upon which Forward Statements may be based are reasonable.
UNLESS EXPRESSLY STATED OTHERWISE, ALL INFORMATION, DATA, VIEWS AND FORWARD-LOOKING STATEMENTS CONTAINED IN THIS COMPANY PRESENTATION
ARE BASED ON INFORMATION, DATA AND FORECASTS AVAILABLE TO THE COMPANY AT THE TIME OF THE PUBLICATION OF THIS COMPANY PRESENTATION. THE
COMPANY IS NOT OBLIGED TO UPDATE THIS COMPANY PRESENTATION UNDER RELEVANT LAWS AND THEREFORE WILL NOT UPDATE THIS COMPANY
PRESENTATION WHATSOEVER. ALL INFORMATION AND DATA CONTAINED IN THIS COMPANY PRESENTATION ARE BASED ON INFORMATION AND DATA, WHICH WAS
PREVIOUSLY PUBLISHED BY THE COMPANY IN CONNECTION WITH ITS CONTINUOUS REPORTING OBLIGATIONS UNDER RELEVANT FINANCIAL OR SECURITIES LAWS.
                                                                                                                                              Roadshow presentation as of September 2023

DIC Asset AG              36   Roadshow Presentation
You can also read