"SANTAPOL AVANT" STRATEGIC PLAN OF THE CITY OF SANTA POLA - FIRST FCP - Pla Ciutat Santa Pola
←
→
Page content transcription
If your browser does not render page correctly, please read the page content below
STRATEGIC PLAN OF
THE CITY OF SANTA
POLA
“SANTAPOL AVANT”
FIRST FCP
0.1 Introduction                                                                                                                                                        6

0.2 Analysis of the territorial context                                                                   ..............                                              10

0.3 City indicators ..................................................................................................................... 14
    0.3.1 Demographic indicators .............................................................................................................. 16
          0.3.1.1 Population pyramid .................................................................................. 16
          0.3.1.2 Evolution of population ............................................................................. 16
          0.3.1.3 Average age and composition ...................................................................... 17
          0.3.1.4 Floating and foreign population ................................................................... 17
          0.3.1.5 Population density .............................................................................. 17
          0.3.1.6 Natural movements of population ................................................................. 18
    0.3.2 Climate indicators ..................................................................................................................... 18
          0.3.2.1 Climate conditions ................................................................................... 18
          0.3.2.2 Risk of natural disasters ............................................................................ 19
    0.3.3 Environmental indicators .......................................................................................................... 20
          0.3.3.1 Protected areas ................................................................................. 20
          0.3.3.2 Green spaces .................................................................................... 20
          0.3.3.3 Air quality ............................................................................................. 21
          0.3.3.4 Noise levels ........................................................................................... 21
          0.3.3.5 Urban waste management and collection system............................................... 21
          0.3.3.6 Quality of the beaches .............................................................................. 21
    0.3.4 Urban indicators ........................................................................................................................ 22
          0.3.4.1 Housing characteristics ............................................................................. 22
          0.3.4.2 Condition of the buildings .......................................................................... 23
          0.3.4.3 Access to energy sources and consumption patterns ........................................... 23
          0.3.4.4 Energy consumption of buildings and streetlights .............................................. 23
    0.3.5 Economic indicators.................................................................................................................. 23
          0.3.5.1 Activity sectors .................................................................................. 23
          0.3.5.2 Hiring related to gender ............................................................................ 24
          0.3.5.3 Seasonality in hiring ................................................................................. 24
          0.3.5.4 Hiring by sectors ..................................................................................... 25
          0.3.5.5 Professional situation related to gender ......................................................... 25
          0.3.5.6 Unemployed people and evolution regarding age and gender ................................ 25
          0.3.5.7 Situation of SME ...................................................................................... 26
          0.3.5.8 Average budget per inhabitant .................................................................... 28
          0.3.5.9 Functional economic budget in subjects(expenses) ............................................ 28
          0.3.5.10 Functional economic budget in subjects(income) ............................................. 28
          0.3.5.11 Evolution of the municipal budget............................................................... 29
    0.3.6 Social indicators ........................................................................................................................ 29
          0.3.6.1 Educational level..................................................................................... 29
          0.3.6.2 Study levels regarding gender ..................................................................... 30
          0.3.6.3 Conflict and social exclusion ....................................................................... 30
    0.3.7 Territorial context indicators ..................................................................................................... 31

0.4 Analysis of the existing planning ........................................................................................ 32

0.5 FCP Methodology ................................................................................................................ 44
        Citizen participation process ......................................................................................................................... 46
        Methodology ............................................................................................................................................... 47
        Participating groups ...................................................................................................................................... 48
        Calendar ....................................................................................................................................................... 50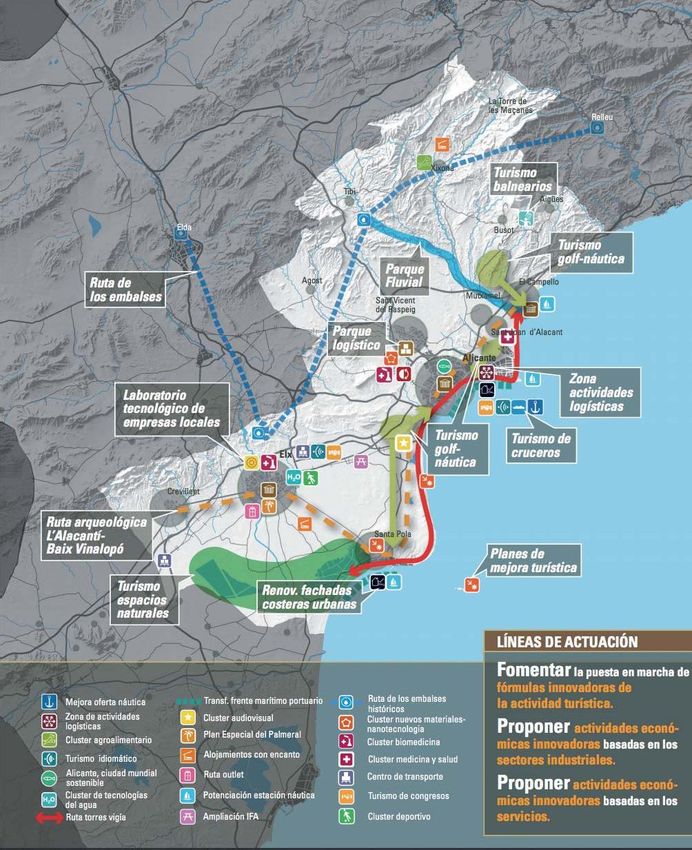
0.6 Strategic aims ............................................................................................................................................. 54
      Aim 1: Local government, smart city and participation ................................................................................ 56
            Fact 1 Electronic administration and underdeveloped transparency ........................................... 56
            Fact 2 Citizen participation strategy in consolidation process .................................................. 58
            Fact 3 Need to improve the accessibility of the city to people with functional diversity . ................ 59
            Fact 4 Optimisation and use of resources ........................................................................... 61
            Fact 5 Lack of connectivity and use of new technologies to communicate with local administration.. .......... 63
      Aim 2: Economic development, employment and innovation ........................................................... 64
            Fact 1 Low professional qualification, brain drain and seasonal employment ....................................... 64
            Fact 2 Lack of cohesive business fabric ............................................................................. 67
            Fact 3 Existence of a Local Development Agency for the economic dynamisation of the municipality.
            … 68
            Fact 4 Need for infrastructure and services. ....................................................................... 68
            Fact 5 City with potential for innovation and generation of employment related to sport. ............... 69
      Aim 3: Productive sectors ............................................................................................................................ 70
            Fact 1. Mature tourism product that does not generate new employment opportunities.................. 70
            Fact 2. Transformation of the fishing and industrial sector. .................................................... 72
            Fact 3. Scarce promotion and support for the contracting of SMEs and / or local micropyme ............ 73
            Fact 4. Idle and little known local resources. ...................................................................... 74
            Fact 5. Low-profile, low-competitive, low value-added entrepreneurship. .................................. 75
      Aim 4: Sustainable development and protection of the environment ........................................................... 76
            Recreation facilities..................................................................................................... 76
            Urban green spaces ................................................................................................ 76
            Water consumption ................................................................................................ 76
            Presence of nitrates in drinking water .............................................................................. 77
            Quality of bathing waters .............................................................................................. 77
            State of conservation of the oceanic posidonia .................................................................... 77
            Fact 1. Privileged geographical position ............................................................................ 77
            Fact 2. Territorial resources: Natural park, coastal facade, salt flats and mountains. ..................... 78
            Fact 3. Inefficient equipment and inadequate use of energy resources(lighting, heating .)in buildings 79
            Fact 4. Disordered territorial model with lack of vision of sustainability towards new challenges....... 81
            Fact 5. Lack of means, awareness and respect for the environment. ......................................... 81
      Aim 5: Accessibility and sustainable urban mobility. .................................................................................. 82
            Cycle lane ................................................................................................................. 82
            Fact 1. Existence of two population centres inter and intraurbanly disconnected .......................... 82
            Fact 2. Lack of an accesibility and mobility plan. Traffic management, car parks, pavement.....… .... 84
            Fact 3. Mobility dominated by the private vehicle, few spaces for pedestrians and other means… .... 85
            Fact 4. Decontrol of occupation of the public road. ............................................................. 86
            Fact 5. Inaccessible and disconnected points of interest. ...................................................... 86
      Aim 6: Social inclusion, culture, education and youth ................................................................................ 87
            Schools .................................................................................................................... 87
            Libraries, cultural centres, cultural facilities, screening rooms ................................................ 87
            Sports facilities .......................................................................................................... 87
            Population studying non-universitary studies ...................................................................... 87
            Population studying higher education ............................................................................... 87
            Fact 1. Absence of traditional and alternative leisure programs for young people at weekends.… ...... 88
            Fact 2. Ignorance of the ‘Habitage i mediació’ office ............................................................ 89
            Fact 3. Southern Europe’s typical public health model. Priority areas: childhood, the elderly … ... 89
            Fact 4. Digital gap, problems of addiction and inappropriate use. .......................................... 90
            Fact 5. Deficiency and insufficiency of cultural and social infrastructures. Non-optimised use ..... 91
            Fact 6. Lack of formative training, poor educational offer, school failure. ............................... 92
            Enrichment Day .......................................................................................................... 93

0.7 Process of the city plan Santa Pola Avant .................................................................................................. 94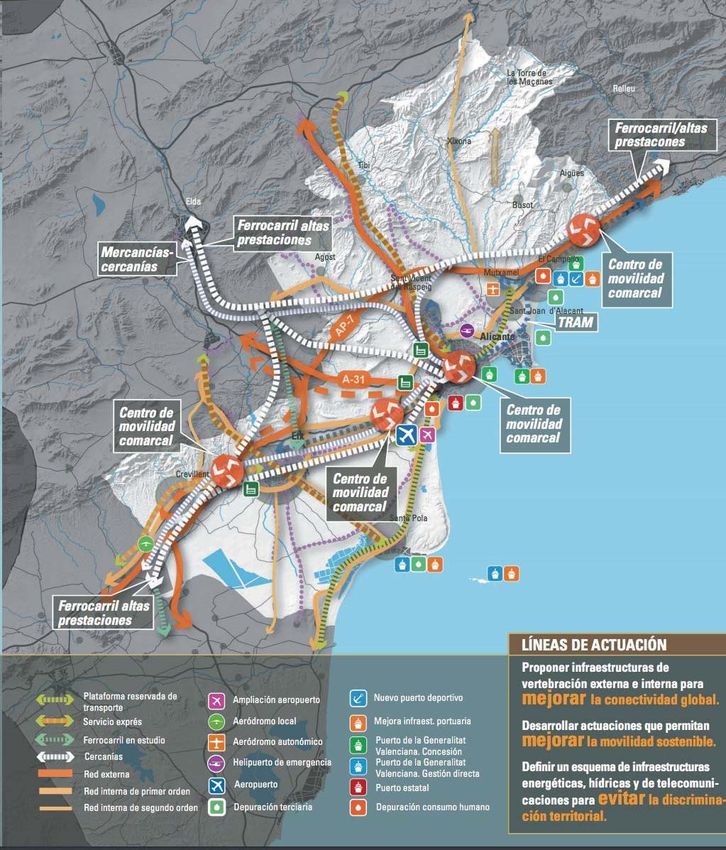
0.1 INTRODUCTION
0.1 INTRODUCTION
Cities are an important engine to develop the territory in the socioeconomic aspect, and the challenge is to keep
creating welfare, stability and wealth, which will help to maintain and improve the life of the citizens. The launch
of the project Strategic Plan Santapolavant is going to give the opportunity to modify the current dynamics that
impede local development, and also to tackle imaginable changes in order to obtain the desired city. From a global
perspective, it is expected to integrate objectives and necessary actions to improve and transform the city, in the
interest of the social majority.
Why do we need a city plan for Santa Pola?
It is necessary to make a diagnosis of the city in order to establish its current state and determine the direction we
want to follow in the future, to find solutions to present problems and to invest to build the future of the city.
Furthermore, resources must be applied to achieve the objectives, in a prioritised, consistent and achievable way,
from a planned and transversal management.
What does it mean for the city?
The adaptation of the municipality to the standards of the 21st century, sustainability and territory
governance guidelines.
The participation of the politicians and the citizenship.
The encouragement of good government.
The city will be a leading municipality at the service of the citizenship, ensuring a smart, sustainable and
integrating growth.
Is the opinion of the citizenship taken into account?
The civic participation includes every citizen, even the youngest. The involvement and the vision of children are
essential.
The Pla Ciutat means to adapt the municipality to the standards of the 21st century
“ and to the sustainability and governance guidelines, which is the decision making
of the city, with the participation of the politicians and other agents involved,
thanks to the civic participation. In short, the plan wants to encourage the good
government, which will be more participative and adapted to the real needs of the
population. To sum up, this plan intends to turn Santa Pola into a leading
municipality, at the service of the citizenship, and according to the European
Strategy 2020, ensuring a smart, sustainable and integrating growth.
0.2 ANALYSIS OF THE TERRITORIAL CONTEXT
0.2 ANALYSIS OF THE TERRITORIAL CONTEXT

Santa Pola is a coastal municipality, located in the area of Baix Vinalopó, in the province of Alicante.
It has 31,137 inhabitants (INE 2017) and a surface of 58.16 km2.
The population density is 535.37 inhabitants/km2.

               8.724 habitantes GRAN
               ALACANT

                                        6 Núcleos de   2 Parajes       Referente turístico     Interés cultural y      Actividad
                                       población       Naturales        para la comarca         patrimonial            pesquera
  22.413 habitantes

Communication infrastructures                                      International airport Alicante-Elche
The municipality is accessible through the N-332 and                El Altet
CV-856.                                                            N-332
Maritime aspects                                                   Regional connections
A Santa Pola acts like a node in fishing importation and
exportation, on a small scale.                                     Urban and territorial disadvantage in relation to Alicante. 19
Communication with the capital of Spain                            Km through N-332 and 11 km to Elche through the CV-865.
A-31 / A-3
Data referred to January 1, 2016. Source: Valencian Institute of Statistics. Population pyramid on 1st January , 2017, INE.
0.3 CITY INDICATORS
0.3 CITY INDICATORS

0.3.1 Demographic indicators

0.3.1.1 Population pyramid
According to the information given by the Statistics             Más 99
                                                                 95 - 99
Valencian Institute (INE) on the 1st of January of 2017,         90 - 94
Santa Pola has a regressive population pyramid, and              85 - 89
people are 43.83 years old on average. This number is            80 - 84
                                                                 75 - 79
above the average age of the province, which is 43.20            70 - 74
years old, although it is not a very meaningful difference.      65 - 69
                                                                 60 - 64
The average age in the country is 42.96 years old. The           55 - 59
reason is the low birth rate, which has been constantly          50 - 54
decreasing. However, during the last years it has been           45 - 49
                                                                 40 - 44
mitigated.                                                       35 - 39
                                                                 30 - 34
In the middle part of the pyramid there is more                  25 - 29
                                                                 20 - 24
population, men and women, aged between 30 and 54                15 - 19
years old, which represent 41.63% of the inhabitants of          10 - 14
Santa Pola. On the other hand, the youth percentage                5-9
                                                                   0-4
(between 15 and 29 years old) is 13.88%, which is under
                                                                           2000 1500   1000   500     0    500   1000   1500   2000
the average of the country, 15.05%, and the province,
14.25%.

0.3.1.2 Evolution of population

The population of Santa Pola has increased between                                     Inhabitants
1996 and 2013. This growth is caused by the migration
flow and the construction sector, since the urban growth
and the construction of high buildings have marked the
population development in this period.

However, since 2013, the population has declined up to
31,529 inhabitants, which means 2,605 inhabitants less.
This decrease is due to the economic recession and the
low birth rate. Nowadays, the population is keeping its
stability with the possibility of a following decrease.
                                                                                               Year

0.3.1.3 Average age and composition

The average age of Santa Pola, according to the
information given by the Statistics Valencian Institute                          Average age              43.83 years old
(INE) on the 1st of January of 2017, is 43.83 years old,
which shows a slightly aged population. This is due to
the fact that the population aged between 15 and 59           60 years old
years old represents 61.57% of the whole of the                                   old
population and, moreover, 22.54% are over 60 years old.           15.89%                 61.57%                  22.54%
On the national level, people aged over 60 are 18.96%, a
much lower number.
0.3.1.4 Floating and foreign population
In 2016, according to the INE, Santa Pola had a registered population of 31,309. Nevertheless, the number of
second homes, or the production of solid urban waste, reflect the existence of a quite high transient
population almost the entire year.
Considering, then, the equation TP = SUW/days * 1.5 (1.5 being the coefficient of SUW generation in the
province of Alicante), an annual average of 80,958 is obtained, although in July and August it exceeds
120,000 people. (Touristic sustainability diagnosis of the municipality of Santa Pola).
On the other hand, depending on the population registered and the residences in 2011, the INE gives official
numbers of the population involved in Santa Pola. In this case, the municipality counted on an involvement
rate of 254.49, from which 47,879 are due to leisure (different to work and studies).
The number of the foreign population has been reduced since last year, as it is seen in the chart. On the 1 st
of January of 2017, according to the statistics of the census published by the Government of Alicante, Santa
Pola has 4,648 foreigners, 14.92%. The area of Gran Alacant is the most concerned, since the majority of
the residents are foreigners, so its population has decreased in the last few years. In 2012 it had 11,095
registered inhabitants and, in 2016, 8,753.
In comparison, the percentage of foreign population of Santa Pola is 3% lower than the percentage of the
province (17.81%), which has also been reduced during the last 5 years. In 2013, the percentage of foreigners
in the province was 24.13%. This information is given by the statistics services of the Government of Alicante
(http://documentacion.diputacionalicante.es).
Evolution of the foreign population
0.3.1.5 Population density0.3.1.6 Natural movements of population
0.3.2 Climate indicators
0.3.2.1 Climate conditions
Climate in Santa Pola is known as a local steppe climate. It doesn’t rain much during the year. Following Köpen
and Geiger classification, the climate is BSh. According to the website AEMET and the definition of normal
climate values for the measuring station located in the Alicante-Elche airport, annual average temperature is
18.2ºC and precipitation is 227m.
Regarding the annual distribution of rain, in the months of July and August the precipitation does not exceed 5mm of
monthly average in the historical series, while September and October are the rainiest with rainfall around 40mm.
The maximum monthly average temperatures are given in the months of July and August (30.1 and 30.7), while the
minimum temperatures of December, January and February are around 7ºC.
http://www.aemet.es/es/serviciosclimaticos/datosclimatologicos/valoresclimatologicos?l=8019&k=val
SEMIARID Climate graph
WARM Station: Alicante Elche Airport
CLIMATE
50
100
Bsh 45
90
40
35 80
Temperatures
70
Precipitations
30
25 60
20 50
15 40
18.1 ºC
10 30
5 20
0 10
E F M A M J J A S O N D 0
344 mm
Santa Pola has approximately 260 sunny days per year.January
Average monthly number of sun hours (Regular values,
February
AEMET- Alicante Elche Airport)
March
April
May
June
July
August
September
October
November
December
0.3.2.2 Risk of natural disasters
Santa Pola has areas with medium and very high risk of flooding, according to PATRICOVA, therefore, some
measures have to be taken when there is a risk of torrential rains. The high risk flooding area (coloured in red) is
located in the industrial zone of Santa Pola and Plaza Europa roundabout, whereas the medium risk area
(coloured in yellow) is located in the same spot, but outside factories and warehouses. It is also important to
consider geotechnical risks, there are some unstable slopes around the cape.
Flooding risk
HIGH
LOW
MEDIUM
VERY HIGH
VERY LOW0.3.3 Environmental indicators
0.3.3.1 Protected areas
According to the Pla General of 2009, Santa Pola has six natural protected areas with different categories and
characteristics, which give the municipality a high interest and a landscape and environmental wealth. These areas
extend up to 2,298.29 hectares, and represent 39.52% of the municipality surface.
Area Protected area
Clot de Galvany ZEPA1
Les Salines de Santa Pola ZH1, ZEC1, ZEPA, PN4, LIC5
Dunes de Pinet Mrc6
Barranc de l’Escolgador de Crist Mrc
Els Bassars - Clot de Galvany ZH, PN
Salines del Pinet Mrc
1. Special Protection Area for Birds
2. Wetland
3. Special Preservation Area
4. Nature Park
5. Site of Community Importance
6. Micro-reservation
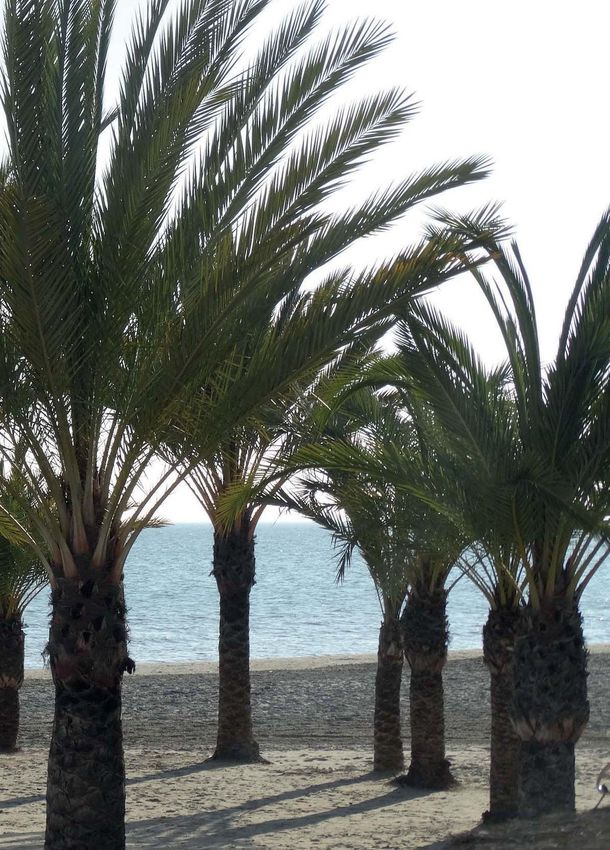
0.3.3.2 Green spaces
According to the Pla General of 2009, green spaces in Santa Pola are divided in three: beaches, outdoors sports
locations and public parks. The whole of green spaces surface is 1,862,460 m2.
Green space type
11%
18% Surface type Surface m2
Sports facilities 1.387.500
71% Beaches 343.818
Public Parks 217.858
Sports facilities Beaches Public Parks
Regarding the availability and quality of green spaces, there is a lack of parks and/or squares, which only represent
7.04% of the whole green spaces surface.
The indicator of green space surface per inhabitant, in Santa Pola, is 4.21 m2, far away from the 10-15 m2 advised by
the World Health Organization. This number reflects the lack of leisure urban spaces which help the use and enjoyment
of public space.0.3.3.3 Air quality
The development of the Valencian Network of Surveillance and Control is planned through the Air Quality Control
Centre. Following the normative demands, the proper functioning of the network is supervised, as well as the
effectiveness of the maintenance and validation tasks. There are two control centres near Santa Pola, located in
Alicante and in Elche.
Atmospheric pollution values are 33μg/m³ of nitrogen dioxide, so the air quality is considered to be excellent and with
low pollution. The proximity to the sea and the presence of natural elements clean and renovate the air, and eliminate
all kind of polluting particles in suspension.
0.3.3.4 Noise levels
Noise pollution produced by human activity has dramatically increased during the last years. According to the
Organisation for Economic Co-operation and Development (OECD), a lot of member countries, including Spain, have a
sound level higher than 65 decibels, limit accepted by the WHO. Road traffic and leisure activities are the main sources
of noise in Spain.
Road traffic noise levels in Santa Pola vary between 54.8 dB in winter and 74 dB in summer. The streets generating a
higher sound level are: Avenida Blasco Ibáñez, Avenida Portus, Calle Elche (the highest dB) and road N- 322. This
information has been obtained from the seasonal analysis of the sound map of Santa Pola (University Miguel Hernández,
Mechanical Engineering area. Polytechnic University of Valencia, Applied Physics).
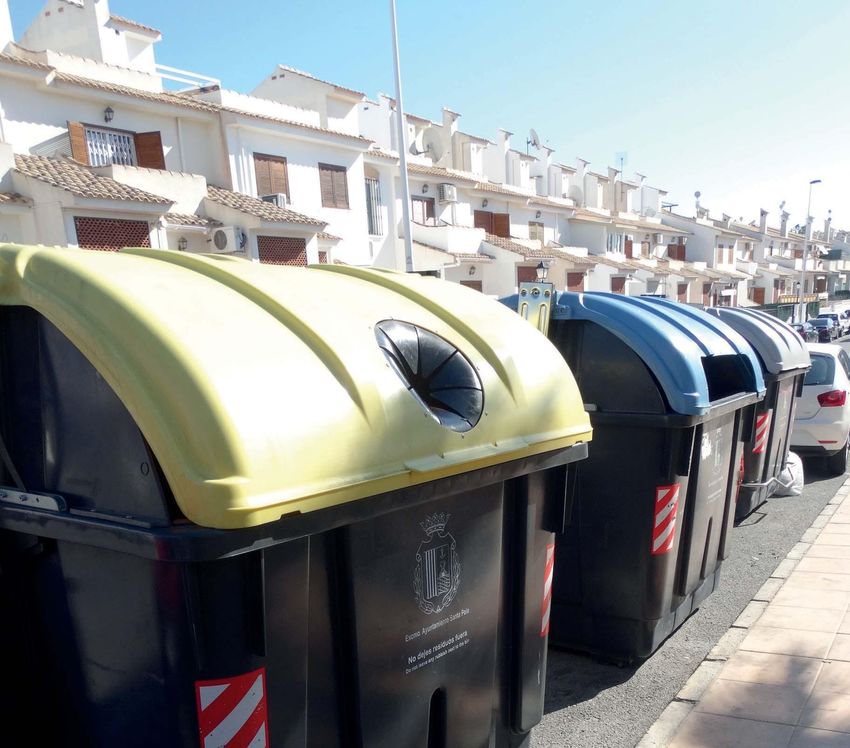
0.3.3.5 Urban waste management and collection system
The company in charge of the collection of urban waste is URBASER. The collection is semi urban (municipalities
between 5,000 and 50,000 inhabitants), one trash can per fraction of waste sorting, every 400 inhabitants. The
information showed below is from 2016, as appears on the touristic sustainability diagnosis of the municipality of Santa
Pola (numbers are calculated according to the population registered in the census).
Essentials Rubbish 11.5kg/inhab/year 16 kg/inhab/year
Number of trash bins: 112
25.1kg/inhab/year 586.6kg/inhab/year Collection of light
Number of trash bins: 112
Collection of cardboard
containers
Regarding the waste management system, Santa Pola is part of the Consortium for Urban Waste management from
the Baix Vinalopó, founded in 1997. The Urban Solid Waste Treatment Plant of the Consortium is located in Els
Cremats-Partida Saladars. The Recyclable MRF for light containers has different facilities for recovery and valuation
of all marketable products (compost, ferrous products, aluminium, paper and plastics).
123.000 83.500 6.500
Compost Compaction in Light containers
waste press
*Tons/year*Information checked in 2018 on residuosdelvinalopo.com
0.3.3.6 Quality of the beaches
The beaches and the sea from Santa Pola have an outstanding quality, and it is possible to see the results in the
indicators obtained yearly. According to the Local Development Agency (ADL) and the information from the Valencian
Institute of Statistics and the Association of environmental education and consumer:
• Year 2017: 6 beaches with blue flag (Calas del este, Varador, Llevant, Llisa, Santiago Bernabeu).
• Year 2016: Excellent water quality in Cales de l’est, Varador, Llevant, Santiago Bernabeu, Gran platja, Platja Llisa,
Platja Tamarit and Platja de l’Ermita.
• Year 2016: 4.725km of urban beach and 6.130km of beaches outside the city centre certified by AENOR following the
regulations UNE-EN ISO 9.001:2008 and UNE-EN ISO 14.001:2004.0.3.4 Urban indicators
0.3.4.1Housing characteristics
Type of family homes
According to the population and housing census of
25000
2011, the total number of buildings in Santa Pola is
10,169. In these buildings, there are 43,865 family
20000
homes.
The average in the Baix Vinalopó is 1.68 inhabitants
per home and in the Valencian Community is 1.57, so 15000
the numbers are quite unalike in relation to Santa Pola.
The national average is 1.85 inhabitants per home.
10000
5000
0
Main residences Second homes Empty
* Population and housing census of 2011
The number of second homes is representative, as they are 55% of total homes. In the province, the percentage of second
homes is 25.6%, which shows the high regular use of the residences as a temporary home, for work or leisure purposes.
Empty homes (that are not the habitual residence nor used seasonally, periodically or sporadically) are 5,828 and represent
13.27% of family homes. This number is similar to the national average, 13.65%. The average of the province is lower,
16.40%. All the 13,912 main residences are classified in four typologies.
Types of main residences
IN OWNERSHIP
RENTAL
TRANSFERRED
OTHER
0 2000 4000 6000 8000 10000 12000
* Population and housing census of 2011
According to the information from the population and housing census of 2011, the relationship of inhabitants and residences
is 0.70, caused by the high quantity of secondary homes. In the province, the relationship is higher, 1.43 inhabitants per
home. In the Baix Vinalopó is 1.68 inhabitants per home, in the Valencian Community is 1.57 and in Spain is 1.85. These
numbers are much higher than the 0.70 from Santa Pola.
Inhabitants per home
National Community Province Region Santa Pola
* Population and housing census of 20110.3.4.2 Condition of the buildings
Regarding the structural condition of the buildings, Condition Number of
according to the population and housing census of 2011, buildings
they are, mostly, in good condition (95.6%). One of the
Good 9.722
possible causes is the high number of building constructions
that took place during the beginning of the XXI century. Deficient 376
Bad 50
Ruinous 21
0.3.4.3 Access to energy sources and consumption patterns
According to the population and housing census, 16.90% of main residences in Santa Pola do not have heating,
whereas 61.22% do not have, but they have some heating appliance. Furthermore, all residences, main and
secondary, have shower and toilet, as well as access to running water through public supply.
0.3.4.4 Energy consumption of buildings and streetlights
The Sustainable Energy Action Plan (PAES 2012) of Santa Pola shows the energy consumption of buildings and streetlights.
Buildings Streetlights
91.817 MWh 38.003 MWh
Energy consumption of street lighting represents 41.39% of municipal electric consumption.
0.3.5 Economic indicators along one entire year
0.3.5.1 Activity sectors
Economic activity in Santa Pola is related to seasonal tourism, fishing and the commercial sector. As it is showed on
the board, service sector has some seasonal changes.
Total Primary Secondary Construction Tertiary
2017 (1st trimester) 6.073 290 530 473 4.780
2017 (2nd trimester) 7.039 271 583 490 5.695
2017 (3rd trimester) 6.497 189 524 461 5.323
2017 (4th trimester) 6.196 240 541 505 4.910
Social Security General Treasury (TGSS) and Social Institute of La Marina (ISM)
Sustainable Economy Office, Productive, Commerce and Employment sectors0.3.5.2 Hiring related to gender Last trimester
In general and according to the
information given by SERVEF, during 2017, 300
hiring of men over women has increased
250
15%. During the entire year, 8,845 people
have been hired, 56.91% men and 43.09% 200
women.
150
100
50
Hombres
0
Women Men
Contratcs according to Men Women Total
gender in 2017
January 268 154 422
February 264 199 463
March 340 260 600
April 384 332 716
May 593 364 957
June 681 582 1263
July 848 667 1515
August 348 267 615
September 303 239 542
October 408 289 697
November 304 232 536
December 293 226 519
Annual 5034 3811 8845
Average/monthly 419,5 317,6 737,1
Standard deviation 187,1 154,9 339,3
SERVEF
0.3.5.3 Seasonality in hiring
The number of contracts shows a strong seasonality, directly related to the touristic sector, in Easter and summer.
Total hiring 2017 (SERVEF)
January February March April May June July August September October November December0.3.5.4 Hiring by sectors
Hiring in 2017 by activity sector (SERVEF)
The service sector covered a big part of
the hiring in 2017, specifically 55.50%. Primary Sector
Last trimester, 441 contracts have been S Secondary Sector
made. The sector that has a lower
Construction Sector
hiring degree is the primary sector,
registering 17 contracts (3.96%) during Te Terrtiary Sector
the last trimester.
Hiring in 2017 by activity sector (SERVEF)
Primary Seconday Construction Tertiary
Sector Sector Sector Sector
03121 - Santa Pola 350 550 556 7.389
0.3.5.5 Professional situation related to gender
Regarding the gender of people been hired in 2017, according to SERVEF, hiring of men and women is very unalike
in the primary, secondary and construction sectors. In the service sector, men contracts are more common,
although the difference is less significant.
In the south of Europe, hiring of men is repeatedly more common, and the unemployment numbers show that
there are more unemployed women.
3000
2569
2500 2341
2000
1500
1000 453
432
500 236
4 109 52
0
Men Women SERVEF 2017
0.3.5.6 Unemployed people and evolution regarding age and gender
Regarding unemployment and according to the information given by the ADL of Santa Pola, the percentage of
unemployed people concerning the working population is being reduced during the last years. In 2014 and 2015
they reached its maximum.
Evolution of the annual average of unemployed peopleUnemployed job seekers by groups of age:
Men Women
Under 25 Between 25 Over 44 Under 25 Between 25 Over 44
and 44 and 44
2017 85 454 517 83 703 764
2016 144 570 549 106 787 778
2015 143 678 599 115 928 740
2014 143 678 599 117 925 760
SERVEF
The graphs show an improvement in the number of job seekers, however, there are some aspects to take into
account. In the older group of job seekers, the descent is minor, which proves the difficulty finding a job over 44
years old. For women, numbers are more stable.
Among the job seekers under 25, there are
more men than women. This situation is
inverted in next groups, due, partially, to the
fact that women join the labour market later
than men, because women show a higher
studies level that delays their work inclusion.
0.3.5.7Situation of SME
Primary Sector Secondary Sector Construction Sector Service Sector
Enterprises
registered in the 58 56 74 681
Social Security
(annual average
2017)
As it is reflected in the information about enterprises registered in the Social Security given by the Sustainable
Economy, Productive, Commerce and Employment sectors Office, the majority of enterprises are in the service sector,
which shows the importance of this sector in the economy of Santa Pola.Number of enterprises by activity sector
registered in the Social Security
7%
6%
9%
78%
Primary Sector Secondary Sector Construction S. Service Sector
Source: Social Security General Treasury (TGSS) and Social Institute of La Marina (ISM), Sustainable Economy Office,
Productive, Commerce and Employment sectors
Tourism offer
Regarding the tourism offer of Santa Pola published Regulated tourism offer
Year 2017
for 2017 by the Valencian Tourism Agency, it is (Valencian Tourism Agency)
showed that the main offer is based on apartments, Hotel places 381
following by campsites.
Hostel places 46
At the same time, 182 restaurants with 9,876 Inn places 22
places, 5 travel agencies and 7 enterprises of active
tourism also stand out. Apartment places 5068
Campsite places 1365
Port of Santa Pola
The Generalitat Valenciana is responsible of the administration of the port of Santa Pola and, currently, it has two
administrative licences that belong to the marinas of Club Náutico and Marina Miramar.
As regards fishing, according to the information given by
the ADL in 2016, the fleet was formed by 31 trawlers and
76 small-scale fishing boats, whereas in 2009 there were
40 trawlers and 42 small-scale boats. These numbers
show a progressive abandonment of bigger boats in
favour of the smaller ones. The boats doing artisanal
fishing are smaller boats, which require less investment
at the beginning, fewer administrative licences and they
are more sustainable.
Smaller-scale fishing boats Trawlers
Source: Information provided by the ADL of Santa Pola, resulting from different sources0.3.5.8 Average budget per inhabitant
According to the municipal database of the website ARGOS from the GVA, Santa Pola had in 2016 an average budget
of 936.08€ per inhabitant. This quantity has been progressively reduced since its maximum, in 2009, with a budget
of 1220.20€ per inhabitant.
In 2017, Santa Pola has an average budget per inhabitant higher than the average budget of the province (32.10€),
and higher than the autonomous budget (911.23€), according to the ARGOS database.
Evolution of average budget per inhabitant
1400
1200
1000
800
600
400
200
0
2006 2007 2008 2009 2010 2011 2012 2013 2014 2015 2016 2017
Source: ARGOS.
0.3.5.9 Functional economic budget in
subjects (expenses) Subjects Incomes in 2017
According to the Ministry of Finances and Staff expenses 16.562.633,42€
Public Administration, in 2017, the total Goods and services expenses 9.279.211,90€
expenses of the economic budget of Santa Transfers 104.260,00€
Pola were 28,836,890.04€. Contingency funds -
Investments -
Transfers of capital -
Financial assets 156.060,72€
Financial liabilities 746.195,00€
0.3.5.10 Functional economic Subjects Incomes in 2017
budget in subjects (income)
Direct taxes 15.936.899,00€
The total incomes of the economic budget Indirect taxes 395.000,00€
of Santa Pola were 29,146,807.30€. Public prices taxes and other incomes 5.031.712,00€
Patrimonial incomes 615.539,58€
Alienation of investments -
Transfers of capital 1,00€
Financial assets 156.060,72€
Financial liabilities 0,00€
Source: Ministry of Finances and Public Administration0.3.5.11 Evolution of the municipal budget
Expenses
40.000.000,00 €
35.000.000,00 €
30.000.000,00 €
25.000.000,00 €
20.000.000,00 €
15.000.000,00 €
10.000.000,00 €
2000 2001 2002 2003 2004 2005 2006 2007 2008 2009 2010 2011 2012 2013 2014 2015 2016 2017
Incomes
40.000.000,00 €
35.000.000,00 €
30.000.000,00 €
25.000.000,00 €
20.000.000,00 €
15.000.000,00 €
10.000.000,00 €
2000 2001 2002 2003 2004 2005 2006 2007 2008 2009 2010 2011 2012 2013 2014 2015 2016 2017
Source: Ministry of Finances and Public Administration
0.3.6 Social indicators
0.3.6.1 Educational level
According to the population and housing census of 2011, Santa Pola has 4,585 students. More than half the
population, 58.60%, possess second degree studies, whereas 17.44% has third degree studies. On the other side, 8.32%
of the population do not study, a number close to the Spanish average (7.56%). Illiteracy rate is 1.02%, which is under
the Spanish average (1.57%).
Educational level
ILLITERATE DO NOT STUDY 1ST DEGREE STUDIES 2ND DEGREE STUDIES 3RD DEGREE STUDIES
Source: Population and housing census of 20110.3.6.2 Study levels regarding gender
The previous chart shows an approximate equality in study levels between women and men. On one side, there is a
trend towards the masculinisation of the high vocational training. On the other side, there is a feminisation of university
degrees.
Educational level
5 or more years of school, but unfinished studies
Last year of ESO or EGB
Bachiller, BUP, COU
Vocational training
High vocational training
Three-year university degree
Four-year university degree
Five-year university degree
Official Master’s degree
PhD
Men Women
Population and housing census of 2011
0.3.6.3 Conflict and social exclusion
According to the register of vulnerable neighbourhoods of the Ministry of development of 2011, there are no
vulnerable neighbourhoods or in conflict. However, in near cities like Elche, Torrevieja or Alicante, there are up to
345 neighbourhoods with such characteristics, some of them with high vulnerability category.
Regarding poverty indicators, there is no information at a local level. The main indicators for the Province are the
following, published by the statistical website of the Valencian Community
Risk of poverty AROPE Material Severe material Average income per
rate in 2016 deprivation deprivation rate consumption unit in
2016
rate in 2016 in 2016
2016
Valencian Community 19,0 26,2 18,7 7,5 13.589
Province of Alicante 20,9 28,7 18,7 8,6 12.293
Baix Vinalopó 17,9 26,0 12,2 6,4 12.9940.3.7 Territorial context indicators
Santa Pola belongs to the Baix Vinalopó region and it is formed by six population centres. Among them, besides the
city centre, Gran Alacant stands out with more than 8,000 inhabitants. The population living in the other centres
do not exceed 200 inhabitants. The height of the city centre is 4 metres above sea level.
38º 11’ 23”
0º 33’ 20”
The surface of the municipal boundary is 58.16 km2. Forest surface is 30.47 km2 and protected areas 23.42km2.0.4 ANALYSIS OF THE EXISTING PLANNING
0.4 ANALYSIS OF THE EXISTING PLANNING
We have followed a process to elaborate and design the City Plan Santapolavant, which integrates all the knowledge
developed in the different sector strategies and the tools of municipal planning. This knowledge has been
incorporated to the information registered during field work and the results of the participatory process.

The municipal Plans and Studies considered as tools to support the strategy are:

•Territorial Strategy of the Valencian Community
• Territorial Action Plan of the Littoral Green Infrastructure (PATIVEL)
• Land-use General Plan of Santa Pola
• Commercial Action Plan of Santa Pola
• Competitiveness Plan “International Sports Tourism”
• Sustainable Urban Mobility Plan (PMUS)
• Certificate of Adhesion to the FEMP Section: Network of Spanish cities for the climate
• Basic Plan of Actions to Prevent Forest Fires in Nature Reserves from the Valencian Community
• Mayors’ Agreement
• Adhesion to the Integrated Mayors’ Agreement for Climate and Energy
• Fishing strategy of Participatory Local Development (EDPL)
• Tourist Sustainability Diagnosis of the municipality of Santa Pola
• Diagnosis of the Regions of the Vinalopó

Territorial Strategy of the Valencian Community (ETCV)

   An advanced, flexible and rigorous tool to define an organised and
   consistent territorial model. It tackles the future of our territory with a
   global view, based on a stable and foreseeable context which will drive
   the activity of every productive sector in order to reach higher levels of
   economic growth and social welfare. It has achieved the greatest
   agreement to develop strategic territorial projects.

   The Territorial Strategy designs a territory that will activate all the
   resources and intern abilities of the Community and it will be more
   attractive to gain investments and talents. THE TERRITORY is the key to
   the competitiveness and it also:

   • Is efficient in water, soil and energy use
   • Has a high level of connectivity, inwards and outwards
   • Provides a work-to-home proximity
   • Has a great economic, social and cultural diversity
   • Has a high potential of innovation
   • Has a marked personality and is highly appreciated
   • Has high rates of social connection and a facilitating government

   It relies on a higher quality Valencian Community, more economically
   competitive, socially conciliatory and environmentally friendly.

   In the Valencian Community we have first-class territorial assets, but it is
   not enough. There are a lot of regions that also have excellent initial
   resources. The key is to know how to enhance these assets, to make the
   territory work in order to be more attractive than our competitors.

   The Territorial Strategy defines the model of territory that we want to
   have in 5, 10 and 20 years, and it identifies the actions and projects to
   create a high quality territory and to invigorate the Valencian productive
   system from the territory, since it is the support and the final addressee
   of the investment decisions made by economic agents.
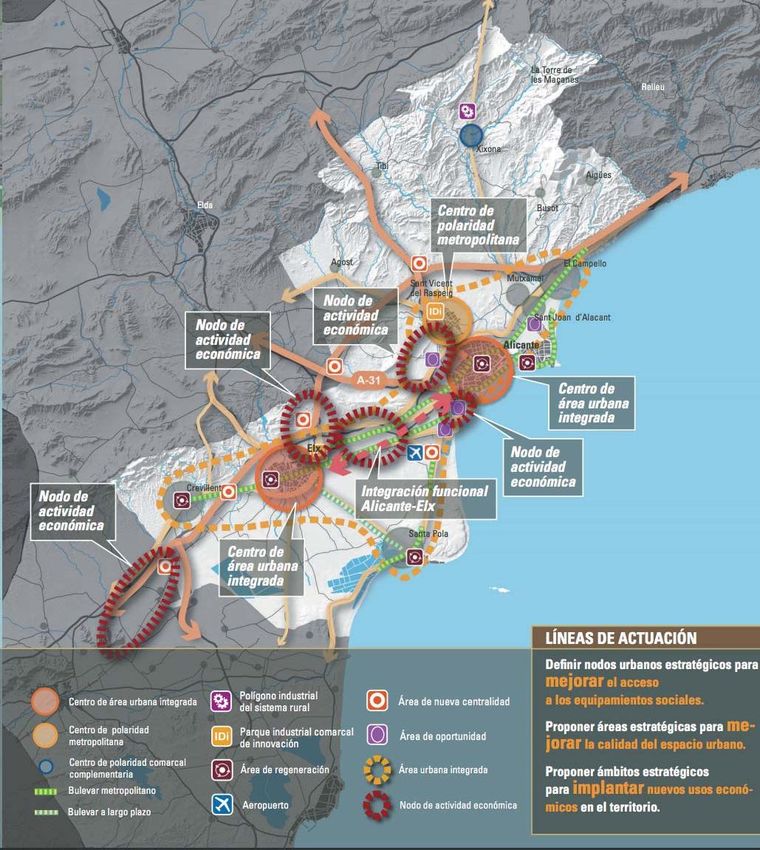
This document divides the territory of the Valencian Community in 15 functional areas, including Santa Pola in the
Functional Area of Alicante-Elche.

It highlights the functional relationship of Santa Pola in the Functional Area, acting as a centre of the green
Infrastructure, according to the Territorial Strategy of the Valencian Community (ETCV). Furthermore, Santa Pola
stands out as a city to promote and develop innovative ways of tourist activity.

   View and objectives

   A great strategic view is proposed over the Functional Area of Alicante-Elche, in order to take advantage of these
   territorial opportunities and to improve the quality of life of the citizens and the sustainable development of the
   territory. The view, scheduled for the year 2030, consists of “a transformation of the urban area of Alicante-
   Elche to be the biggest node of centrality and dynamism in the peninsular south-east”.

   Therefore, it proposes to start with the compliance of the following general and specific objectives regarding
   Santa Pola:

   1. To consolidate a Green Infrastructure which allows the preservation of the environmental and cultural assets
   of the territory.

   2. To develop a settlement system using the territory in a logical way and improving urban quality, economic
   efficiency and services rendered to the population.
3. To design a communication infrastructure diagram (hydrological and energy infrastructures) which allows the
  improvement of the competitiveness of the functional area.

4. To create new economic activities based on the qualification of the territory and innovation.

Territory opportunities

With the general objective of promoting a settlement system using the territory in a logical way and improving
urban quality, economic efficiency and services rendered to the population, the Valencian Territorial Strategy, as a
supramunicipal planning tool, suggests some opportunities for the territory regarding Santa Pola:

• The big positive impact of the high speed trains and the Mediterranean corridor of goods.
• Big possibilities of maritime passengers transport between ports in the area.
• The configuration of an urban region with various centres and more than 2 million inhabitants for 2030.
• The structuring improvement with the metropolitan area of Valencia through inland high speed trains and coastal
trains.
• The strategic position regarding the Mediterranean corridor and the peninsular centre.
• The extraordinary potential concerning relationships with North Africa, a global growing area.
• The diversity road-train-airport to boost logistical activities.
• A high business dynamism, perhaps one of the biggest in the Mediterranean arc.
• The existence of universities and state-of-the-art technological centres in strategic sectors.
• One of the most efficient spaces regarding sustainable management of hydrological resources.
• Natural spaces, mostly great international relevance wetlands.
• Territorial elements with great importance to act as biological and territorial corridors.
Strategic proposals
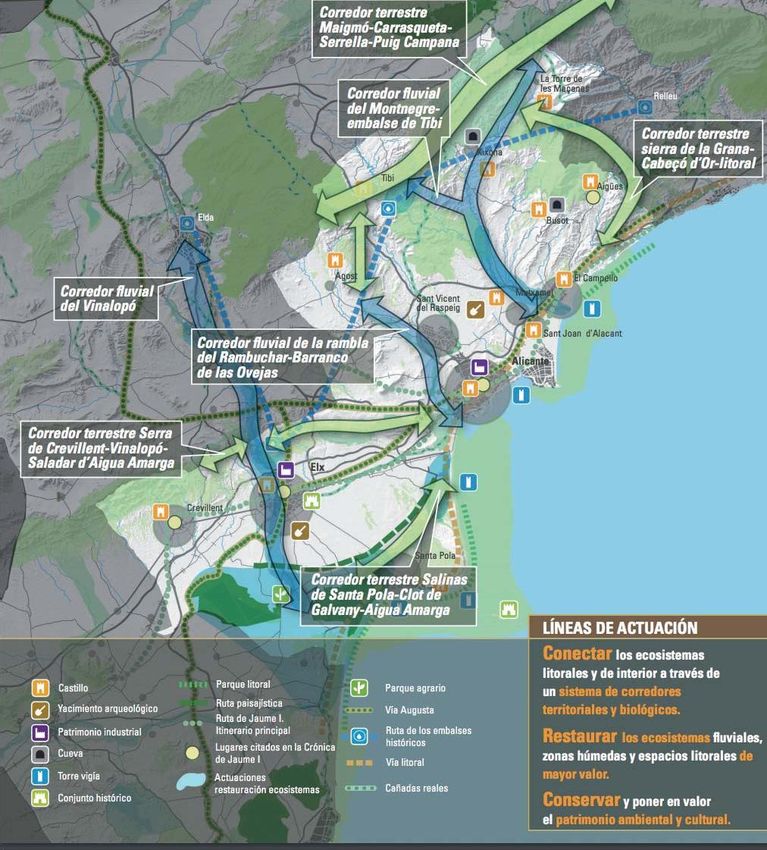
To connect littoral and inland ecosystems through a system of territorial and biological corridors:
• Land corridor Salinas de Santa Pola-Clot de Galvany-Aigua Amarga.
• Littoral parks El Campello, Aigua Amarga-litoral d’Elx-Santa Pola and Santa Pola-Torrevieja.
To preserve and highlight the environmental and cultural patrimony of the functional area.
• Littoral route El Campello-Santa Pola.
To propose a group of strategic areas in order to improve the quality of urban space.
• Metropolitan boulevard Elx-Santa Pola.
• Regeneration areas: neighbourhoods of Sauces and Calvario in Santa Pola.
To propose a group of external and internal structuring facilities to improve global connectivity of the functional
area.
• New road Elx-Santa Pola.To develop actions allowing sustainable mobility in the functional area: • Express service Santa Pola – Vinalopó. To define a diagram of energy, hydrological and telecommunication infrastructures to avoid territorial discrimination concerning the establishment of economic activities. • New electric lines 220 kv in Saladas-Santa Pola, El Palmeral-Cantalar and Alicante-Universidad. • Substations in L’Altet, Cabo Huertas, Santa Pola, Universidad, Rabassa and Alicante. To encourage the development of innovative forms of tourist activity through an association between inland and littoral. • Littoral route of observation towers. • Historical and cultural route of Jaume I. • Improvement plans for the tourist competitiveness of Santa Pola and Tabarca. • Strengthening of the nautical station Alicante-El Campello-Santa Pola. • Golf and navigation, cultural and gastronomic tourism. • Renovation of urban coastal façades • Transformation of the port maritime front in Alicante and Santa Pola.
Territorial Action Plan of the Littoral Green Infrastructure (PATIVEL)

    PATIVEL was introduced in 2015, aiming the preservation and protection of the
    Valencian Community coast, where urban development has to protect the
    littoral. The aspiration is to start a protection model, leaving behind politics
    carried out during the last 20 years in the Valencian coast.

    PATIVEL is a supramunicipal spatial planning tool provided by article 16 of Law
    5/2014, 25th July, of the Generalitat, Territory Spatial Planning, Urbanism and
    Landscaping (LOTUP). According to the legal framework, it is a group of plans
    that take place in concrete territorial areas or in specific sectors, adjusting to
    the principles and criteria marked on the Territorial Strategy of the Valencian
    Community. These plans can be sectorial or with an integrated perspective,
    which varies according to its aim for spatial planning, nature or objectives
    planned.

    Littoral spaces, because of their susceptibility and ability to obtain wealth, have
    attracted the attention for centuries. These zones gather a big part of the
    population and activities, which is the reason they also have a higher potential
    of conflict in the field of soil uses and different social and economic groups of
    interest. The need to put in order and to take advantage in a sustainable way
    the possibilities in its territorial development, is translated from a normative
    point of view into the proliferation of different planning and coastal
    management instruments.
                                                                                              Green coastal
                                                                                              infrastructure (ETCV)

    The preference of the Action Plan is:

•   To coordinate urban and sectorial planning.
•   To define the green infrastructure of its scope of action.
•   To develop, complete and even modify the Littoral Green Infrastructure (when appropriate).
•   To define objectives, principles and territorial criteria for supramunicipal actions.
•    To guarantee a territorial governance in a more logical and participatory way.

In the case of Santa Pola, both Las Salinas and El Cabo de Santa Pola are determined as spaces with a great
ecologic, cultural, agricultural, landscape and territorial value.
• Las Salinas: This space is part of the Natural Park of Las Lagunas de Santa Pola and it is near to the city
centre and the communication hub with Elche. It is also essential to guarantee environmental and territorial
connectivity between the sea, the wetlands and the agricultural space of Campo de Elche, leaving a strategic
transition area between the wetlands and the built environment.

• Cabo de Santa Pola: It is a cape with a great environmental, landscape, cultural and iconic value. It has some
Heritages of Cultural Interest, protected forest soil, borders protected marine spaces. It is home to flora micro-
reserves and possesses important geomorphological values which are necessary to preserve due to their
shortage in the Valencian territory and their great visibility.
Municipal General Plan of the Space Planning of Santa Pola
The General Plan of the Space Planning has been taken as a frame of reference to the territorial model which has
determined the main decisions adopted in the urban evolution and territorial use. The General Plan from the 28 th of
March of 1985 appears as a revision of the Plan from 1973.
The last revision of the General Plan was approved in April 2009 and it updates the GP from 1985. To date, the same
territorial model proposed on the last revision of the GP is exposed, joining different approach initiatives of interest
to the municipality. Therefore, the aim is to rearrange the model by adjusting it to new initiatives that have appear
afterwards, keeping the initial criteria and renaming actions in order to adapt them to the valid legislation.
In 2005 the Environmental Impact Study of Santa Pola was approved. It proposes a territorial model based on social,
demographic and economic necessities of the municipality in order to adequate to future needs. To introduce the
environmental factor in the decision making, the Environmental Impact Study has been developed at the same time
than the General Plan.
Commercial Action Plan of Santa Pola
Commercial Action Plans are a reference tool at the service of the municipalities which must allow City Councils and
other public and private bodies to adopt necessary measures to invigorate the commercial sector and the
strengthening of a commercial, balanced and efficient city model at the service of consumers. These Plans integrate
the analysis of social, economical, commercial and urban aspects that may influence the commercial development of
the municipalities and they allow the diagnosis of the commerce competitive situation of a municipality. From that
point on, the course of action is developed in order to create a detailed program addressed to the achievement of
the objectives specified by the Plan.
Currently, no revision of the Commercial Action Plan is registered.The objectives aimed by the Commercial Action Plan of Santa Pola are: • To determine the role that Santa Pola plays regarding its commercial influence area and its territorial environment. • To quantify and characterise the commercial offer of Santa Pola. • To analyse the consumption habits of the population of Santa Pola, both residents and tourists, in order to detect the adequacy of the existent commercial structure, considering the factors in this kind of equipments, to the demand, and identifying problems that may arise. • To identify and quantify the flow of expenses produced in the municipality, especially analysing the expenses evaded from the municipality to others or to near commercial equipments that represent the main commercial competence of Santa Pola. • To make a commercial urban analysis of the main commercial points of Santa Pola in order to determine their adequacy regarding the commercial function they must carry out. • To diagnose the situation of the commercial sector in Santa Pola and to propose some measures in order to modernise and professionalise the city. Competitiveness Plan “International Sports Tourism” "Santa Pola, Destination of INTERNATIONAL SPORTS TOURISM", this is how the Tourism Competitiveness Plan is titled. It began to bear fruit after the signing, on September 10, 2009, of the Agreement between Turespaña, the Valencian Agència de Turisme, the Santa Pola City Council and the Merchants Association of Santa Pola. The three public administrations, state, autonomous and local, committed a program of actions. The study prior to the drafting of the Strategic Plan showed the great potential of Santa Pola as a sports tourism destination based, mainly, on the great success in the organization of events, orientation that, in addition, will serve as a fundamental tool for the deseasonalisation of the tourism and activation of the local economy during the so-called low season. The Plan must propose the actions to be taken to resolve those weaknesses in the value of resources and offer in order to facilitate the increase of the stay. The main objective assigned to the Plan is to complement the traditional offer of sun and beach tourism and introduce a differentiating element by taking advantage of the sporting events organised in the town that attracts so many visitors each year; the internationalisation of events and the consolidation of others with great possibilities, such as the open water swimming to Tabarca-Santa Pola. And it seems that, Santa Pola has been betting for years on this activity as a source of generation of resources and as a way to complement adverse situations of other sectors. Currently there is no review of the competitiveness plan. Certificate of Adhesion to the Section of the FEMP: "Spanish Network of Cities for Climate" It should be considered a constant concern of each and every one of the actors of Santa Pola to ensure the sustainability of the destination and of the actions carried out in the city, as shown in the letter of commitment of the Municipality to the Environment, included in the CERTIFICATE OF ACCESSION TO THE SECTION OF THE FEMP "Spanish network of cities for the climate". Santa Pola’s City Council has been a member since March 2008. The Spanish Network of Cities for Climate is the Section of the FEMP formed by Local Governments that are integrating mitigation and adaptation to climate change into their policies. The Network arises from the need detected among the municipalities to coordinate each other in the fight against climate change. Since its creation, it coordinates and promotes the local policies to fight against climate change in Spanish cities and towns, making it possible to achieve better results in the fight against climate change and in mitigating its effects. The Network is a technical support instrument that offers tools for Local Governments to achieve their objectives. It is also the main means of transferring the objectives of the national policy on climate change and energy management to the local scale.
You can also read