Scoring personalized molecular portraits identify Systemic Lupus Erythematosus subtypes and predict individualized drug responses, symptomatology ...
←
→
Page content transcription
If your browser does not render page correctly, please read the page content below
Briefings in Bioinformatics, 2022, 23(5), 1–13
                                                                                                                       https://doi.org/10.1093/bib/bbac332
                                                                                                                               Problem Solving Protocol

Scoring personalized molecular portraits identify
Systemic Lupus Erythematosus subtypes and predict
individualized drug responses, symptomatology and
disease progression

                                                                                                                                                                 Downloaded from https://academic.oup.com/bib/article/23/5/bbac332/6659743 by guest on 05 October 2022
Daniel Toro-Domínguez          , Jordi Martorell-Marugán         , Manuel Martinez-Bueno, Raúl López-Domínguez, Elena Carnero-Montoro,
                                                                                           †
Guillermo Barturen, Daniel Goldman, Michelle Petri, Pedro Carmona-Sáez                         and Marta E. Alarcón-Riquelme†
Corresponding author: Daniel Toro-Domínguez, Daniel.toro@genyo.es. Tel: +34 958715500-143.
† The last two authors should be regarded as Joint Last Authors.

Abstract
Objectives: Systemic Lupus Erythematosus is a complex autoimmune disease that leads to significant worsening of quality of life and
mortality. Flares appear unpredictably during the disease course and therapies used are often only partially effective. These challenges
are mainly due to the molecular heterogeneity of the disease, and in this context, personalized medicine-based approaches offer major
promise. With this work we intended to advance in that direction by developing MyPROSLE, an omic-based analytical workf low for
measuring the molecular portrait of individual patients to support clinicians in their therapeutic decisions.
Methods: Immunological gene-modules were used to represent the transcriptome of the patients. A dysregulation score for each
gene-module was calculated at the patient level based on averaged z-scores. Almost 6100 Lupus and 750 healthy samples were used
to analyze the association among dysregulation scores, clinical manifestations, prognosis, f lare and remission events and response
to Tabalumab. Machine learning-based classification models were built to predict around 100 different clinical parameters based on
personalized dysregulation scores.
Results: MyPROSLE allows to molecularly summarize patients in 206 gene-modules, clustered into nine main lupus signatures. The
combination of these modules revealed highly differentiated pathological mechanisms. We found that the dysregulation of certain
gene-modules is strongly associated with specific clinical manifestations, the occurrence of relapses or the presence of long-term
remission and drug response. Therefore, MyPROSLE may be used to accurately predict these clinical outcomes.
Conclusions: MyPROSLE (https://myprosle.genyo.es) allows molecular characterization of individual Lupus patients and it extracts
key molecular information to support more precise therapeutic decisions.

Keywords: Systemic Lupus Erythematosus, autoimmune diseases, computational models, molecular profiling, personalized medicine

Introduction                                                                     only three new FDA-approved SLE therapies in 65 years,
Systemic Lupus Erythematosus (SLE) is a heterogeneous                            there is a large unmet need to develop new and effective
autoimmune disease with a nonlinear clinical course                              therapeutic approaches [2, 3]. One contributing cause
and unpredictable patterns of f lares and remissions with                        of treatment failure is the heterogeneous dysregulation
involvement of a wide range of tissues and organs [1].                           of molecular mechanisms that are uncharacterized at
SLE causes significant suffering and mortality, and with                         the individual patient level [4]. A large proportion of

Raul López Domínguez: He is a biologist and bioinformatician with expertise in big data applied to immunology.
Jordi Martorell-Marugán: He is a researcher focused on the development of omics data analysis and integration methods and their application to complex disease
data.
Manuel Martinez-Bueno: He is a researcher focused on genetic analysis applied to complex diseases.
Daniel Toro Domínguez: He specialized in computational biology applied to the study of autoimmune diseases, omics data analysis, machine learning and
molecular clustering analysis.
Elena Carnero-Montoro: She is a researcher specialized in genetic epidemiology and epigenomics.
Guillermo Barturen: He is a researcher with computational expertise on high-throughput technologies analysis.
Daniel Goldman: He is a professor of medicine specialized in autoimmune diseases.
Michelle Petri: She is a professor of medicine specialized in autoimmune diseases.
Pedro Carmona-Sáez: He is a professor of biostatistics with computational expertise in bioinformatics.
Marta E. Alarcón-Riquelme: She specialized in the genetics of complex diseases and autoimmunity.
Received: March 7, 2022. Revised: July 4, 2022. Accepted: July 21, 2022
© The Author(s) 2022. Published by Oxford University Press.
This is an Open Access article distributed under the terms of the Creative Commons Attribution Non-Commercial License (https://creativecommons.org/licenses/
by-nc/4.0/), which permits non-commercial re-use, distribution, and reproduction in any medium, provided the original work is properly cited. For commercial
re-use, please contact journals.permissions@oup.com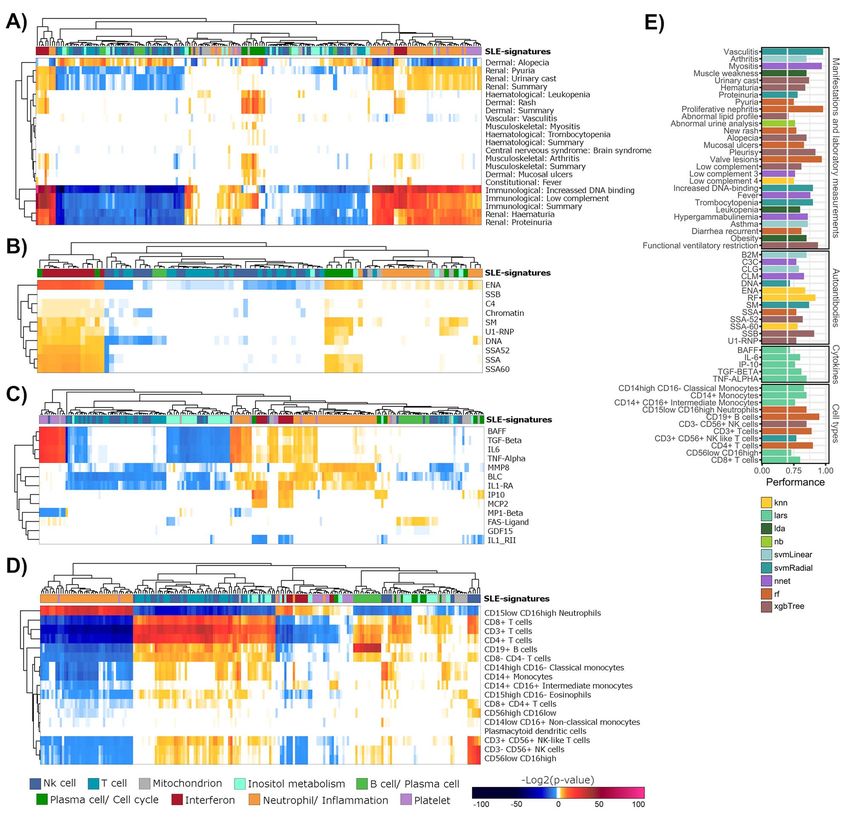
2   |   Toro-Domínguez et al.

patients show none or partial response to therapies,             new scoring system capable of measuring the personal-
which are prescribed based on a trial-and-error approach         ized Molecular dYsregulated PROfiles of SLE patients
that clearly requires improvement [5].                           (MyPROSLE) was developed, which allows relatively
   It is during periods of disease activity, either chronic or   simple identification and standardized quantification
flares, when organs suffer most damage. Disease activity         of the molecular fingerprints that drive the SLE activity
indexes, such as the SLE Disease Activity Index (SLEDAI),        in individual patients. Interestingly, two clearly differ-
the British Isles Lupus Assessment Group Index (BILAG)           entiated SLE subtypes at the clinical and molecular level
or the Physician Global Assessment (PGA), are used by            were identified and their stability over time was assessed,
clinicians as a support for the immediate therapeutic            which supports different pathological mechanisms.
decision [6, 7]. These indexes are based on a summation          Finally, a web tool to easily assess SLE molecular portraits
of organ manifestations, sometimes in a weighted fash-           from transcriptome information through MyPROSLE in
ion. An equal activity index value can be generated by           individual patients has been developed. Figure 1 shows a
different combinations of manifestations, thus hinder-           general scheme of the different steps of the workflow.

                                                                                                                                Downloaded from https://academic.oup.com/bib/article/23/5/bbac332/6659743 by guest on 05 October 2022
ing systematic comparisons across patients. In addition,
activity indexes do not ref lect the molecular portrait of
the patients, that is, the dysregulated biological pathways      Materials and Methods
and molecular mechanisms associated with the disease             SLE datasets and data pre-processing
status, which may also be different between patients and         Genome-wide gene expression levels and clinical and
even throughout the course of the disease. The molecular         demographic information (when available) for nine
portrait impacts on the clinical manifestations and the          datasets (six and three cross-sectional and longitudinal
response to drugs. Currently, the use of personalized            datasets, respectively) were downloaded from the
therapies based on molecular information is advanced in          National Center for Biotechnology Information (NCBI)
some diseases, such as cancer [8–10], and it is considered       Gene Expression Omnibus (GEO) database [19]. We also
a promising strategy to overcome disease heterogeneity.          included the dataset from the PRECISESADS project [12].
However, in autoimmunity, individualized prescription of         Datasets were used for different purposes depending
therapies based on molecular patterns does not exist for         on the information they contain, as detailed in Table 1.
routine clinical care, mainly due to the lack of specific        The clinical data of the patients from the GSE121239
and easy-to-use tools for these purposes.                        cohort were provided by Johns Hopkins University
   Despite this, there is an increasing interest to address      School of Medicine. Clinical drug response indices to
such heterogeneity both in autoimmunity [11–13] as               Tabalumab for patients from the GSE88887 [20] dataset
in SLE specifically through molecular stratification             were collected by Eli Lilly and Company (ClinicalTrials.
[14–16] and biomarker discovery for specific conditions          gov Identifiers NCT01205438 and NCT01196091).
[17]. While stratification studies have shown how                  Raw data from each dataset were processed following
different molecular patterns ref lect different pheno-           a platform-specific workflow, as described in Martorell-
types, clustering results depend on technical variables          Marugán et al. [21]. Expression data were transformed to
such as the cohort features, the sample sizes and the            logarithmic scale and transcripts were annotated from
statistical approaches used. For this reason, numerous           probes to gene symbol for each dataset. Duplicated genes
cross-sectional clustering studies often obtain different        were merged assigning their mean expression value and
subgroups of patients. In addition, studies are mostly           genes with zero or near to zero variance were filtered
exploratory and they are not intended for a direct               using caret R package (version 6.0–91, 22].
clinical practice application. On the other hand, many             In summary, 10 different cohorts comprising a total of
clinical and omics-based markers for different clinical          6134 whole blood SLE samples and 757 healthy controls
outcomes have been identified using machine learning             were collected.
(ML) techniques. However, clinical markers are often
subject to enormous variability across patients, and             MyPROSLE score
omics experiments are often not validated in external            Most genes form regulatory networks, acting as gene-
cohorts due to the enormous biases caused by the use             modules in specific biological functions and are likely co-
of different technical platforms [18]. Therefore, it is          expressed. Based on this principle, we summarized indi-
necessary to analyze in detail the connections between           vidual gene expression into 606 co-expressed gene mod-
the molecular portraits and their implications in the            ules that regulate biological and immunological mecha-
medical environment, but also to use a standardized              nisms previously described by Li et al. [23] and Chauss-
approach to incorporate this knowledge in practice               abel et al. [24]. Genes and gene-module connections were
reproducibly.                                                    obtained from tmod R package (version 0.46.2) [25]. This
   In this multi-cohort study, we sought to define the           process reduced the dimensionality by projecting thou-
relevant connections between personalized molecular              sands of genes into 606 functional gene-modules.
portraits and consequent medical implications in order             Next, a score for each gene-module was calculated to
to predict drug response, disease course, remissions             quantify the dysregulation of each function for individ-
and f lares and clinical manifestations. For this goal, a        ual patients compared with the healthy state. For this, we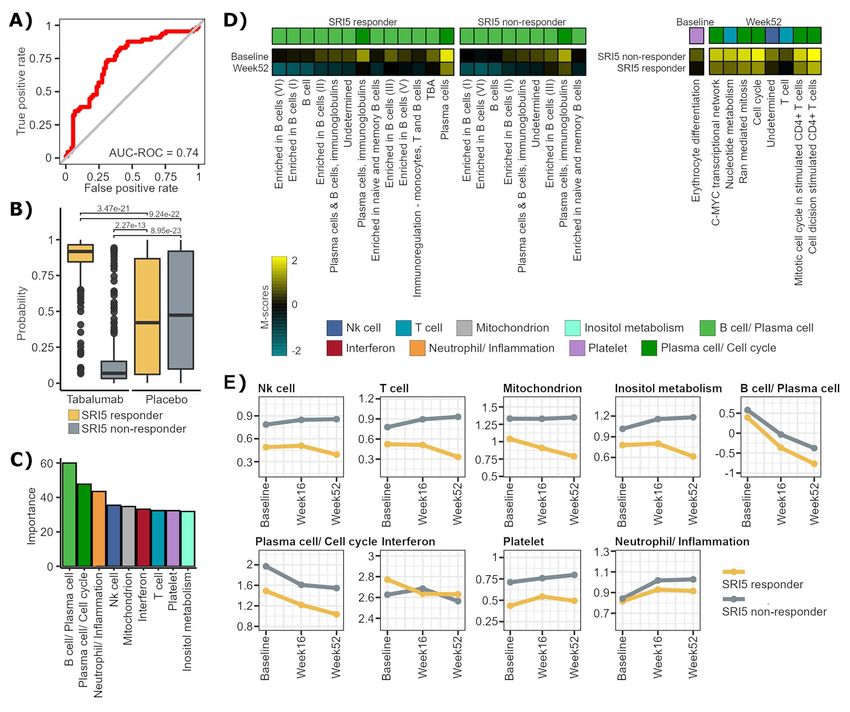
Systemic Lupus Erythematosus            |   3

                                                                                                                                                                       Downloaded from https://academic.oup.com/bib/article/23/5/bbac332/6659743 by guest on 05 October 2022
Figure 1. Summary of the main steps of the workf low. First, the M-scores for immune related gene-modules are calculated for nine different cohorts,
those relevant to the disease were selected and clustered into nine main SLE-signatures that ref lect nine well-differentiated biological functions.
Secondly, different approaches were carried out relating the molecular profiles with different clinical outcomes, and predictive models were built for
each of them. Finally, a web tool was developed to calculate the M-scores and apply the prediction models on new patient samples.

Table 1. Description of datasets used in the study

Dataset ID               SLE samples                   Healthy samples         Data description                                                      Used for

GSE45291 [45]            292                           20                      One gene expression sample per patient                                A
GSE61635                 79                            30                      RNP autoantibody+ SLE samples                                         A
GSE72509 [46]            99                            18                      One gene expression sample per patient                                A
GSE108497                325                           187                     Samples taken during pregnancy                                        A
GSE110169 [47]           82                            77                      One gene expression sample per patient                                A
GSE110174 [47]           144                           10                      One gene expression sample per patient                                A
GSE65391 [14]            924                           72                      158 pediatric longitudinal SLE patients and 48 age-matched            A, B, C
                                                                               controls
GSE121239 [15]           727                           20                      301 adults longitudinal SLE patients and 20 healthy controls          A, B, C
GSE88887 [20]            3086                          60                      3 follow-up points of patients treated with Tabalumab or              D
                                                                               placebo
PRECISESADS [12]         376                           263                     Genotyped and fully clinically characterized patients.                A, C

(A) Datasets used for MyPROSLE system construction, selection of SLE-related gene-modules and clustering of gene-modules and patients. (B) Datasets used for
longitudinal and time-dependent analysis and for the construction of predictive models for future disease flares. (C) Datasets used for measure the association
between molecular portraits and clinical manifestations and for the construction of predictive models for clinical variables. (D) Dataset used for drug response
analysis and for drug response prediction models construction.

adapted the methodology developed by Meche et al. [26].                             the standard deviation of gene j in healthy samples and ni
Brief ly, for each patient, the z-score of the expression of                        is the number of genes from the module i. The M-scores
each gene was calculated with respect to the expression                             follow a centered normal distribution given that it is a
of the gene in a pool of healthy controls (from the same                            mean of z-scores. The interval of 1.65 and −1.65 in such
dataset). Then, the score for a gene-module i (M-score i)                           distribution contain 90% of the data, which correspond
was computed as the mean of the z-scores of all its genes,                          to a P-value of 0.05 for each tail [27]. Therefore, we can
as shown in Equation 1:                                                             consider statistically significant those M-scores that take
                                                                                    values greater than 1.65 or less than −1.65.

                                   ni          xj −μjH                                Next, only those gene-modules that could be related to
                                      j=1        σjH                                the disease were selected. For this aim, the gene-modules
                      Mscorei =                                          (1)
                                            ni                                      that did not achieve significantly high M-scores in at
                                                                                    least 10% of the samples and at least three of the nine
where xj is the expression of gene j in an individual                               datasets were removed. This selection step allowed to
patient, μjH and σjH are the mean of the expression and                             retain gene-modules that, on the one hand, may appear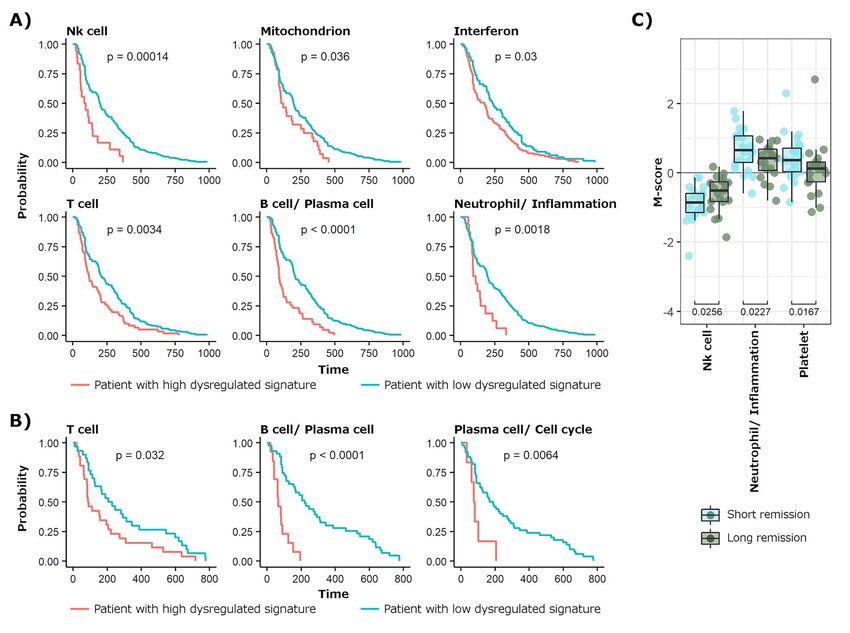
4   |   Toro-Domínguez et al.

in small subsets of patients, but on the other hand, do       among all combinations and permutations was selected
so recurrently between studies, dealing with potential        as the optimal k. The process was repeated switching
biases caused by individual studies. Finally, 206 gene-       randomly the M-scores within each dataset to obtain the
modules were selected. In order to test the consistency of    frequencies of optimal number of clusters in randomized
M-scores, multiple random sampling of healthy controls        data to discard all those results below those obtained
was applied to each dataset to generate various subsets       by chance. Finally, gene-modules were grouped into k
(100 subsets for each dataset and sample size, ranging        selected SLE-signatures using ConsensusClusterPlus R
from 90 to 10% of the total healthy samples) and M-           package (version 1.54.0) [30].
scores of patients were recalculated among subsampling.          We defined the SLE-signature M-scores (M-sig) as the
   In summary, MyPROSLE system summarizes the                 average of M-scores of all gene-modules grouped in the
molecular portrait of a patient by measuring dysregula-       same signature (Equation 2) as a value summarizing
tion scores (or M-scores) for 206 functional gene-modules     dysregulation at signature level.
with respect to healthy distribution.

                                                                                                                              Downloaded from https://academic.oup.com/bib/article/23/5/bbac332/6659743 by guest on 05 October 2022
                                                                                             ni
                                                                                              j=1
                                                                                                     Mj
Measuring M-scores without healthy samples                                         Msigi =                              (2)
                                                                                                ni
One of the strengths of MyPROSLE is that it may calculate
the M-scores without providing healthy controls data          where ni is the number of gene-modules in the cluster (or
using our standardized reference of SLE samples. Such         signature) i and Mj is the M-score of the gene-module j.
SLE reference was built using the SLE samples from our           The optimal number of subgroups of patients was also
datasets and the genes within the 206 gene-modules.           calculated on the matrix of M-scores of all patients using
Each patient is individually normalized by centering the      NbClust.
mean of the selected genes and dividing it by its stan-
dard deviation. The M-scores of these patients have been      Gene-modules switching in patients during
previously calculated with respect to their controls. To      disease lifetime
analyze a new patient, first, their expression is centered    We measured whether there were different and exclusive
and scaled. Then, patient–patient similarity between the      pathological mechanisms for subgroups of patients, or
provided sample and the reference SLE samples is mea-         if highly dysregulated gene-modules switch within the
sured using the Euclidean distance. The M-scores for          same patient. For that, M-scores of patients having more
the new patient are calculated as the mean of the M-          than three visits from two available longitudinal datasets
scores of the k most similar SLE samples of the reference     (Table 1) were merged. Then, the number of times each
(Supplementary Figure 1). In this way, we can estimate        pair of gene-modules appeared strongly dysregulated in
the dysregulation score of each gene-module in a patient,     the same patient regardless the time point was counted.
without the need of new healthy individuals profiling         Pearson’s chi-squared test was used to evaluate the sta-
and avoiding potential variations in the M-scores calcu-      tistical association.
lation due to the use of different healthy references. This
system was tested using the patients from one of the          Classification models for clinical variables
datasets (GSE61635), not included in the reference, and       In order to predict drug response, clinical manifestations
measuring the correlation between the M-scores calcu-         and other disease-related events based on gene-modules,
lated with respect to their controls and those imputed        caret R package (version 6.0–91) was used to build ML-
with the described method.                                    based prediction models [22]. For each variable, 80%
                                                              and 20% of patients were class-balanced and randomly
Clustering of gene-modules                                    selected as training and test sets (using specific datasets
We aimed to identify groups of gene-modules that are          for the different variables to predict, see Table 1), respec-
jointly dysregulated, and to subsequently analyze their       tively. First, to select optimal parameter, parameter
co-regulation in different patients. First M-scores for the   tuning was performed on training set for each model
206 gene-modules across nine different datasets (Table 1)     by 10-fold-cross validation iterated 30 times. For binary
were calculated. In order to obtain the number of sta-        variables, such as response or not response to a drug,
ble groups of gene-modules (k), or SLE-signatures, the        different classification algorithms were tested, including
matrices of M-scores from different datasets were inte-       Gaussian linear model, linear discriminant analysis,
grated by similarity network fusion (SNF) using SNFtool       extreme gradient boosting, random forest, k-nearest
R package (version 2.3.1) [28]. This process was repeated     neighbors, linear and radial super vector machine,
500 times selecting different numbers of datasets (from       neural networks, CART or naive bayes. For continuous
2 to 9) and different parameters for the SNF algorithm        variables, the previous algorithms that can be adapted
(number of neighbors from 10 to 30 and alpha hyper-           for regression and some additional ones were used, such
parameter from 0.3 to 0.8). Then, NbClust R package (ver-     as linear model or least angle regression, covering the
sion 3.0) was applied to obtain the best number of groups     main ML approaches [22]. Performance results of each
for each iteration across 30 different stability metrics      algorithm were measured on the test sets using different
[29]. Most frequently optimal number of groups obtained       metrics, including the area under the curve (AUC),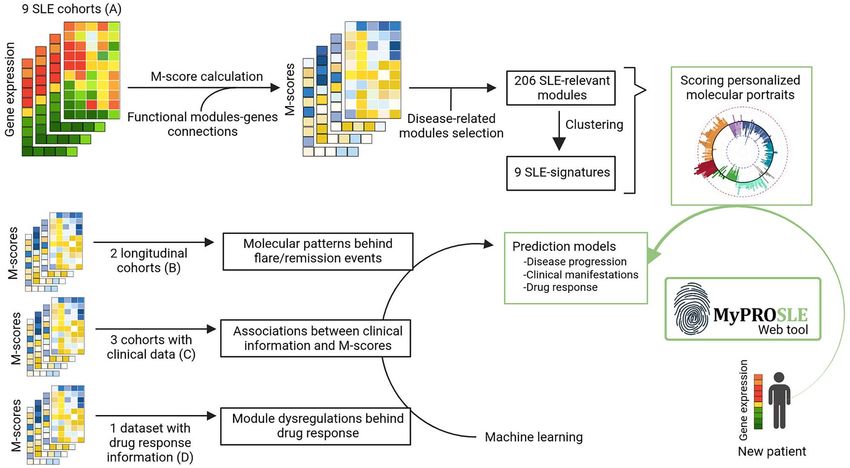
Systemic Lupus Erythematosus   |   5

precision, recall, F1 and the balanced accuracy [31]. The       future flares (at 3 and 6 months) to predict near wors-
entire process was repeated 10 times from train/test            ening in patients.
selection (outer folds) and we selected as adequate
variables to predict those that obtained a mean AUC             Drug response prediction based on M-scores
(or correlation for continuous variables) greater than          Clinical response information to Tabalumab for the
0.6 across iterations with any of the algorithms. With          patients from the GSE88887 dataset [20] was provided by
this step, overfitting and selection bias were avoided. For     Eli Lilly and Company. Clinical response was measured at
each variable, the algorithm that achieved the highest          Week 52 after initiation of treatment using the Systemic
mean AUC across the 10 outer folds and the model based          lupus erythematosus Responder Index–5 (SRI5). SRI5
on that algorithm with best performance were selected,          defines as good responders those patients in whom
as long as their AUC or correlation was greater than            a reduction of ≥5 points from baseline in SELENA-
0.7. Supplementary Figure 2 shows a summary of the              SLEDAI score is achieved, no new BILAG A or no more
workf low for the construction of the prediction models.        than one new BILAG B disease activity scores and no

                                                                                                                                      Downloaded from https://academic.oup.com/bib/article/23/5/bbac332/6659743 by guest on 05 October 2022
                                                                worsening (defined as an increase of ≥0.3 points from
Association among gene-modules and clinical                     baseline) in PGA [32]. Main selection criteria for patients
variables                                                       were the presence of antinuclear antibodies, age 18 or
Association among M-scores of each gene-module and              older with active SLE (SELENA-SLEDAI ≥6) and without
different clinical variables were measured, including           active lupus nephritis or active central nervous system
clinical manifestations, comorbidities, presence/absence        involvement. A total of 60 healthy controls, 300 placebo-
of auto-antibodies, levels of cytokines and blood cell type     treated patients and 699 Tabalumab-treated patients
proportions, comprising 111 different clinical outcomes         were collected. Patients were sampled at baseline before
(Supplementary Table 1). Levels of cytokines were               treatment, and at 16 and 52 weeks after treatment.
measured in picograms per milliliter (pg/ml) and the            First, predictive models for SRI5 response were built
presence/absence of each autoantibody was measured              using the M-scores at baseline of Tabalumab-treated
in units/ml (with specific cutoffs for each one as it is        patients. Changes in M-scores between responder and
described in Barturen et al. [12]). Analysis of variance test   non-responder patients at baseline, at Week 52 and
was used to measure differences in gene-modules M-              over time were measured by linear models using limma
scores for categorical variables and Pearson’s correlation      package [33] (version 3.22.7).
coefficients were computed for continuous variables.
ML-based prediction models for each clinical variable
were built.                                                     Results
                                                                Gene-modules are clustered into nine main
Molecular background of disease remissions and                  SLE-signatures
flares                                                          M-scores were computed for all SLE patients from nine
To investigate how gene-modules change at different             different datasets (Table 1) with respect to their healthy
stages of clinical disease activity, samples from the lon-      controls. The consistency of the M-scores was demon-
gitudinal datasets were selected having a low SLEDAI            strated by selecting random subsets of healthy controls
index value (SLEDAI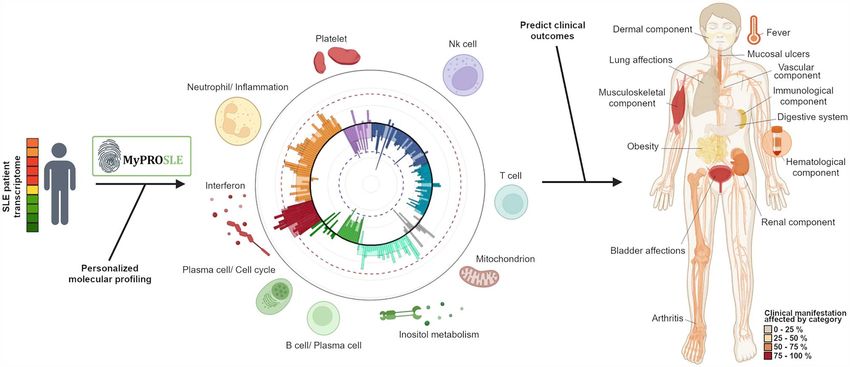
6 | Toro-Domínguez et al.
Downloaded from https://academic.oup.com/bib/article/23/5/bbac332/6659743 by guest on 05 October 2022
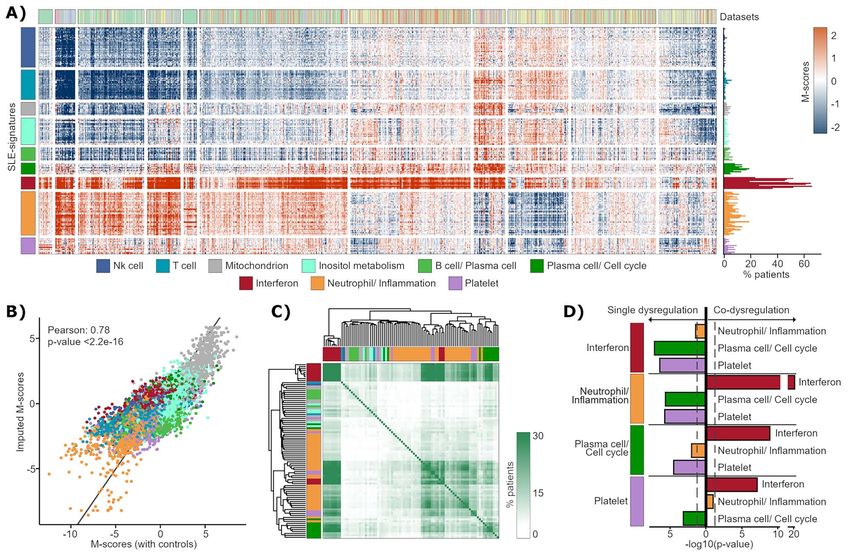
Figure 2. Clustering of gene-modules. (A) M-scores of patients from nine datasets (Table 1). Rows represent gene-modules, clustered into nine SLE-
signatures, and patients are in columns. Frequency of significant dysregulated gene-modules across patients are shown to the right. (B) Correlation
between M-scores from a test dataset calculated with respect to their controls and imputed by patient–patient similarity. Gene-modules are colored
based on the SLE-signature in which they have been previously clustered. (C) Heatmap showing the frequency at which each pair of modules (represented
in rows and columns) appears strongly and jointly dysregulated in the same patients. (D) P-values obtained comparing the proportion in which each
one of the signatures (from left) is significantly dysregulated (using M-scores signification threshold) jointly with others signatures and the proportion
in which it is dysregulated in isolation. The test of proportions assumes that all events occur in equal proportions (null hypothesis).
The M-scores obtained using healthy controls were do not present dysregulation) (90.37%) (Figure 2A). To
compared with those obtained using patient–patient delve into this point, we measured if patients always
similarity (see Methods), resulting in a correlation of showed high dysregulation in the same gene-modules
0.78 between both (Figure 2B) and a P-valueSystemic Lupus Erythematosus | 7
that Plasma cell/Cell cycle and Neutrophil/Inf lammation the genes regulated by interferon, which are expressed
signatures were dysregulated separately with respect almost equally in the rest of the blood cells [12, 35].
to being dysregulated in the same patients (Figure 2D). Models to predict each clinical feature were tested and
Platelet signature was also dysregulated in the opposite a total of 57 different clinical outcomes were successfully
direction to Plasma cell/Cell cycle, although it is linked to predicted with AUC or correlation values greater than
the Neutrophil/Inf lammation signature. Platelet signature 0.7 (Figure 3E and Supplementary Table 3). It should be
does not seem to be independent because very few noted that we obtained a model with an AUC value of
patients had this signature highly dysregulated. As 0.98 to predict severe or proliferative nephritis (Supple-
summary, these observations suggest that there are mentary Figure 4A and Supplementary Table 3), one of
two main pathological mechanisms that differentiate the most serious affections of the pathology, which is
patients over time, since the rest of the signatures appear mainly diagnosed invasively by kidney biopsy. To train
combined with them. These mechanisms are associated and test the model, we selected 30 patients from the
with alterations in Neutrophil/Inf lammation (iSLE) or in longitudinal cohorts that did not have severe nephritis
Downloaded from https://academic.oup.com/bib/article/23/5/bbac332/6659743 by guest on 05 October 2022
Plasma cell/Cell cycle (pSLE) signatures. and 89 patients with biopsy-confirmed nephritis less
than 1 year after/before sampling. Interestingly, B cell/
Plasma cell and Neutrophil/ Inflammation signatures were
Association between molecular dysregulated the most relevant signatures for the model (Supplemen-
profiles and clinical manifestations tary Figure 4B). Significant differences in the M-scores
Association between gene-modules and different types of the signatures comparing samples with and without
of clinical variables were measured (Supplementary nephritis were obtained, being more strongly dysregu-
Table 1). Strong significant associations between mod- lated the Neutrophil/Inflammation, Interferon and Platelet
ules related to Neutrophil/Inf lammation signature and signatures during nephritis (Supplementary Figure 4C).
immunological and renal manifestations, such as
hematuria or proteinuria, were obtained (Figure 3A), Specific dysregulations guide disease remissions
consistent with the previous literature [15]. On the other and flares
hand, the Plasma cell/Cell cycle signature was associated We hypothesized that two samples with the same SLEDAI
with a very different clinical picture, mainly represented can be molecularly very different. For example, the tran-
by a dermal and musculoskeletal component, such as scriptome of samples with low SLEDAI would be different
a higher frequency of arthritis. That is, the signatures if the sample is taken at the beginning of a remission
associated with iSLE (inf lammatory) and pSLE (plasma period or after a long-standing remission. With our sys-
cell) subtypes enriched in different manifestations. tem, different scenarios of clinical remission (defined
Interferon signature was associated with both clini- as SLEDAI8 | Toro-Domínguez et al.
Downloaded from https://academic.oup.com/bib/article/23/5/bbac332/6659743 by guest on 05 October 2022
Figure 3. Associations between gene-modules and clinical variables. (A) Gene-modules and manifestation and lab measurements used in SLEDAI are
represented in columns and rows, respectively. Modules are colored according to the SLE-signatures they belong to. Color ranges for heatmap entries
show the P-values for each association (enrichment and depletion) in a negative logarithmic scale. Association for autoantibodies, cytokines and cell
percentages is recovered in (B), (C) and (D), respectively. (E) Performance results obtained with the ML-based predictive models selected for each clinical
outcome. The x-axis shows the AUC (for categorical variables) or the correlation (for numerical variables). Colors represent the algorithm selected for
each model.
manifestations. M-scores of samples under remission precede to at least 1 year of inactive disease) were
were used to build ML models able to predict whether compared against patients with a short drop of SLEDAI
the patients would suffer or not a f lare in the next 3 (sample in remission, taken within 3 months from an
and 6 months, obtaining AUC values of 0.76 and 0.8 for active disease state and that had a flare within the next
naive bayes and neural network algorithms, respectively 3 months). Significant differences at both gene-modules
(Supplementary Table 3). That is, with our system the and signature levels were obtained, mainly related to
patients without apparent clinical manifestations but Neutrophil/Inflammation, NK cells and Platelet (Figure 4C
with the worst incipient prognosis can be anticipated and Supplementary Figure 5C). This suggests that if
based on molecular data. the SLEDAI drop is not followed by the M-score drop
To identify molecular patterns behind time-stable of these signatures, the patient has a high probability
remissions, first time points of patients entering in a of suffering a clinical relapse of the disease within
long SLEDAI remission (samples in remission, taken the next 3 months. These changes were accompanied
within 3 months from an active disease state and that by significant differences in neutrophils and NK cellsSystemic Lupus Erythematosus | 9
Downloaded from https://academic.oup.com/bib/article/23/5/bbac332/6659743 by guest on 05 October 2022
Figure 4. Molecular dysregulation behind clinical remission and f lares. (A) Kaplan–Meier plots for the significant SLE-signatures obtained, where time
after clinical remission is compared in patients having each signature significantly highly dysregulated (red line) versus the rest of patients (blue line).
(B) The SLE-signatures are compared as a function of the time remaining until a new f lare. (C) Result of comparing the SLE-signatures occurring at the
first time points preceding long SLEDAI remissions against time points that represent short drops in SLEDAI occurring between active disease states.
proportions, remained higher and lower, respectively, in they belong to, being B cells and plasma cells related
short drops of the SLEDAI (Supplementary Figure 5D). signatures the main contributors.
Only one gene-module related to Platelet signature
MyPROSLE predicts Tabalumab response was significant comparing gene-modules between
We analyzed the effect of Tabalumab on gene-modules, responders and non-responders at baseline, while at
a BAFF blocker that inhibits B cell maturation and Week 52, significant differences in gene-modules related
differentiation into autoantibody-secreting plasma cells to T cell, Plasma cell/ Cell cycle and NK cell signatures
[36]. SRI5 response to Tabalumab at baseline based on were found (Figure 5D). Comparing M-scores over time
M-scores can be predicted with high accuracy, as it between baseline and week 52, the main differences
is shown in Figure 5A (AUC value = 0.74 and balanced were obtained in the signatures related to B cells in both
accuracy = 0.7 were obtained by a neural networks-based responders and non-responders. These observations are
model, Supplementary Table 3). The response prediction coherent with the fact that Tabalumab targets B cells
probabilities were significantly different comparing (Figure 5D). Figure 5E shows SLE-signature changes on
patients treated with Tabalumab and placebo (Figure 5B). time in responders and non-responders. B cell/Plasma
High and low probabilities were obtained for responders cell signature was significantly reduced in both groups,
and non-responders to Tabalumab, respectively, while something that also occurred in Plasma cells/Cell cycle
for placebo the probabilities were distributed randomly, signature, although in less magnitude in non-responders.
thus, demonstrating that our prediction model is capable Interestingly, M-scores of NK cell, T cell, Mitochondrion
of differentiating the improvements in patients caused and Inositol metabolism signatures change in the opposite
by the drug and the improvements that occur by way over time between responders and non-responders
chance or by f luctuations in the disease itself. Figure 5C (Figure 5E), so they could be influencing the inefficacy of
shows the average importance average for the predictive the drug in non-responder patients, directing the disease
model of the genes-modules grouped by the signatures through other pathways.10 | Toro-Domínguez et al.
Downloaded from https://academic.oup.com/bib/article/23/5/bbac332/6659743 by guest on 05 October 2022
Figure 5. Tabalumab response based on M-scores. (A) ROC curve of the best predictive model for SRI5 response to Tabalumab based on M-score of patients
at baseline. (B) Probabilities of SRI5 response retrieved by the predictive model for responder and non-responder patients treated with Tabalumab or with
placebo. (C) Average of importance of the genes-modules for the predictive model grouped by the signatures they belong to. Importance was calculated
using varImp function from caret R package. (D) The heatmaps show the mean values of the M-scores for each group of patients for each comparison.
From left to right, samples from responders were compared at baseline against Week 52, non-responders were compared between the same times and
then, responders and non-responders were compared at baseline and at Week 52, specifically. (E) The figure shows the mean M-scores of each signature
(M-sig) and how they vary over time in responders and non-responders.
MyPROSLE implementation and (2) clinical outcomes prediction. MyPROSLE user
The R code to calculate M-scores for all functionally interface was designed with RStudio Shiny package
annotated gene-modules is available in GitHub (https:// (version 1.7.1) [37] and it is available at https://myprosle.
github.com/GENyO-BioInformatics/MyPROSLE), includ- genyo.es. The tool runs on our own server with Ubuntu
ing all the scripts used for each analysis described in this 20.0 operating system, 16 processors and 64 Gb of RAM
work. We have also included an additional R function memory. Some figures have been created using https://
(named M2ML, available on GitHub) that can be used to app.biorender.com.
build new predictive models based on M-scores starting
from gene expression data. We have also developed a web
Discussion
tool in which data from new patients can be loaded to
perform their personalized molecular characterization This work is structured around two main objectives:
and to apply the predictive models generated during this (1) the development of a new system to measure the
work for prediction of clinical manifestations, disease molecular portraits of individual SLE patients (called
flares, autoantibodies, cytokine levels and response to MyPROSLE) and (2) the in-depth characterization of
Tabalumab. Figure 6 shows a summary of the web output such molecular patterns to understand the clinical and
for each of the main steps: (1) M-scores calculation pathological implications behind them. In the first place,Systemic Lupus Erythematosus | 11
Downloaded from https://academic.oup.com/bib/article/23/5/bbac332/6659743 by guest on 05 October 2022
Figure 6. Web tool output example. The figure shows a summary of the web output for each of the two main steps, the personalized molecular profiling
of the patients by calculating the M-scores and the clinical outcomes prediction.
the molecular state of patients can be summarized to predict proliferative nephritis, which is commonly
according to their dysregulation in 206 gene-modules, diagnosed invasively by renal biopsy [40].
grouped into nine main functional signatures. MyPROSLE To date, some studies correlated satisfactorily clinical
quantifies specific dysregulation in each patient through variables with disease activity in order to estimate dis-
M-scores, so it can manage disease heterogeneity, ease activity [41], but studies that have tried to predict
assuming that not all patients will have the same active the occurrence of upcoming flares and remissions in
biological pathways throughout the disease course. M- SLE have not been successful [42]. We have obtained
scores are normalized values and therefore directly AUC values greater than 0.75 using the M-scores of the
comparable between different studies. Although these gene-modules to predict future flares at 3 and 6 months.
scores initially needed a reference of healthy controls In addition, signatures that precede clinical worsening
to be calculated, an additional way of calculating them have been identified and how long the signatures remain
has been proposed for new patients through patient– dysregulated after the patient stops having the clinical
patient similarity. In this way, the M-scores can be manifestations, highlighting that the Interferon signa-
standardized using always the same reference for their ture is the one that remains active longest after clinical
calculation. remission. Therefore, dysregulation of the Interferon sig-
The molecular dysregulations have also allowed to nature is not a good marker for disease activity, as some
identify two well-differentiated and time-stable subtypes studies previously proposed [43].
of SLE: an inf lammatory type, iSLE, and a plasma cell Regarding drug response, Tabalumab mainly affects
type, pSLE. These subtypes have differences at the molec- the plasma cell and B cell related functions [36].
ular and clinical level. Tabalumab clinical trials failed [44], and we hypothesize
During the development of this work, we have demon- that this is due to having studied all patients as a
strated how dysregulation or its absence in certain gene- single homogeneous group. Tabalumab clinical trials
modules and signatures can provide key information failed [44], although Tabalumab shares the same target
from ref lecting different clinical characteristics, predict- pathway as another accepted drug, Belimumab, which
ing close coming flares or a better or worse response to did meet clinical endpoints (being SRI5 the main
Tabalumab. Prediction models for a total of 60 clinical standard endpoint) in multiple trials. We hypothesize
outcomes were obtained (with AUC values greater than that the trial failure is due to having studied all patients
0.7), including SLEDAI components, cytokine and auto- as a single homogeneous group. In this article, we have
antibody levels, cell types proportions and comorbidities. created a model that predicts the SRI5 response to the
The relationship between molecular profiles and clinical drug for individual patients (with AUC value of 0.74), a
manifestations, such as the association between Neu- methodology that can be used to prior or select those
trophil/Inf lammation signature and kidney-related mani- patients who are candidates to be responders. With the
festations and severe nephritis [38, 39], which has been appropriate data, this approach could be easily adapted
previously described, can be used in the clinic as a sup- for other drugs (or any clinical outcome). Indeed, we
port to emphasize which are the risks more likely to have provided R functions with which new predictive
occur in SLE patients and to be able to anticipate them. models can be created based on M-scores for new clinical
In fact, one of the potential applications is to be able outcomes starting from expression data. In addition, we12 | Toro-Domínguez et al.
have identified the main signatures that change both patients included in the GSE88887 dataset (ClinicalTrials.
after response to the drug and differentially over time gov Identifiers NCT01205438 and NCT01196091).
between responders and non-responders, which opens
the door to possible more detailed studies aimed at Funding
identifying the cause behind the non-response.
This project has received funding from grant PID2020-
In conclusion, MyPROSLE is a powerful system to deal
119032RB-I00 supported by MCIN/AEI/10.13039/
with the molecular heterogeneity of SLE and provides the
501100011033: FEDER and the Innovative Medicines
molecular portrait of the individual patients in a stan-
Initiative 2 Joint Undertaking (JU) under grant agreement
dardized way, information that may be used in the future
No 831434 (3TR). The JU receives support from the
to support the choice of more effective personalized
European Union’s Horizon 2020 research and inno-
therapies and patient monitoring. MyPROSLE has been
vation programme and EFPIA. P.C.-S.’s group is also
packaged within a web tool (https://myprosle.genyo.es),
funded by FEDER/Junta de Andalucía-Consejer’a de
where any user can execute it in a friendly environment
Downloaded from https://academic.oup.com/bib/article/23/5/bbac332/6659743 by guest on 05 October 2022
Transformación Económica, Industria, Conocimiento y
needing only expression data from patients, without
Universidades (grants P20_00335 and B-CTS-40-UGR20).
the need of expression data from healthy controls. This
D.T-D. is supported through the aid granted of the
workf low is easily scalable to incorporate new models
‘Consejería de Transformación Económica, Industria,
for other clinical manifestations and drugs as well as
Conocimiento y Universidades’ (CTEICU), in the 2020 call,
for other diseases. In addition, prediction of response
being co-financed by the European Union through the
to Tabalumab, clinical manifestation, such as severe
European Social Fund (ESF) named ‘Andalucía se mueve
nephritis and disease prognosis, is provided by the web
con Europa”, within the framework of the Andalusian
tool. Therefore, we set a precedent and an important
ESF Operational Program 2014–2020. G.B. is supported by
advance in terms of personalized research oriented to a
a Sara Borrell grant # ISCIII CD18/00149. J.M.-M. is funded
near future clinical practice within autoimmunity.
by Ministerio de Universidades (Spain’s Government) and
the European Union – NextGenerationEU.
Author Contributions
All authors contributed to the analysis of the results, to
References
the writing and the revision of the manuscript. D.T.-D.
planned the entire study and actively worked on all of its 1. Goldblatt F, O’Neill SG. Clinical aspects of autoimmune
rheumatic diseases. Lancet Lond Engl 2013;382:797–808.
subsections and wrote the manuscript. R.L.-D. handled
2. Carter PJ, Lazar GA. Next generation antibody drugs: pursuit of
the raw data processing and some time-related analysis.
the ‘high-hanging fruit’. Nat Rev Drug Discov 2018;17:197–223.
J.M.-M. set up the web application. G.B., M.M.-B. and
3. Casey KA, Smith MA, Sinibaldi D, et al. Modulation of Car-
E.C.-M. worked with clinical data from the PRECISESADS diometabolic Disease Markers by Type I Interferon Inhibition
cohort. D.G. and M.P. provided clinical data from the in Systemic Lupus Erythematosus. Arthritis Rheumatol 2021;73:
GSE121239 cohort. P.C.-S. provided statistical support and 459–71.
contributed to decision making and M.E.A.-R. supervised 4. Allen ME, Rus V, Szeto GL. Leveraging Heterogeneity in Sys-
the entire study, being a fundamental active part in the temic Lupus Erythematosus for New Therapies. Trends Mol Med
interpretation of the results. All authors reviewed the 2021;27:152–71.
manuscript. 5. Chasset F, Arnaud L. Targeting interferons and their pathways in
systemic lupus erythematosus. Autoimmun Rev 2018;17:44–52.
6. Bombardier C, Gladman DD, Urowitz MB, et al. Derivation of
the SLEDAI. A disease activity index for lupus patients. The
Key Points
Committee on Prognosis Studies in SLE. Arthritis Rheum 1992;35:
• MyPROSLE allows identification and quantification of
630–40.
the personalized dysregulated molecular mechanisms in
7. Romero-Diaz J, Isenberg D, Ramsey-Goldman R. Measures of
individual Systemic Lupus Erythematosus patients.
adult systemic lupus erythematosus: updated version of British
• Molecular portrait of a patient can be summarized into
Isles Lupus Assessment Group (BILAG 2004), European Con-
nine different functional signatures.
sensus Lupus Activity Measurements (ECLAM), Systemic Lupus
• We identified two subgroups of patients differentiated
Activity Measure, Revised (SLAM-R), Systemic Lupus Activity
over time guided by Neutrophil/ Inf lammation and Plasma
Questionnaire for Population Studies (SLAQ), Systemic Lupus
cell/ Cell cycle signatures.
Erythematosus Disease Activity Index 2000 (SLEDAI-2K), and
• Clinical manifestations, disease prognosis and drug
Systemic Lupus International Collaborating Clinics/American
responses to Tabalumab can be predicted based on
College of Rheumatology Damage Index (SDI). Arthritis Care Res
molecular portrait of each patient.
2011;63(Suppl 11):S37–46.
8. Sicklick JK, Kato S, Okamura R, et al. Molecular profiling of
cancer patients enables personalized combination therapy: the
I-PREDICT study. Nat Med 2019;25:744–50.
Acknowledgement 9. Madani Tonekaboni SA, Beri G, Haibe-Kains B. Pathway-Based
We thank Eli Lilly and Company for providing us the clin- Drug Response Prediction Using Similarity Identification in Gene
ical response information (SRI5) to tabalumab for the SLE Expression. Front Genet 2020;11:1016.Systemic Lupus Erythematosus | 13
10. Franco M, Jeggari A, Peuget S, et al. Prediction of response to 30. Wilkerson MD, Hayes DN. ConsensusClusterPlus: a class dis-
anti-cancer drugs becomes robust via network integration of covery tool with confidence assessments and item tracking.
molecular data. Sci Rep 2019;9:2379. Bioinformatics 2010;26:1572–3.
11. Tavakolpour S. Towards personalized medicine for patients with 31. Larner AJ. Accuracy of cognitive screening instruments recon-
autoimmune diseases: Opportunities and challenges. Immunol sidered: overall, balanced or unbiased accuracy? Neurodegener.
Lett 2017;190:130–8. Dis Manag 2022;12:67–76.
12. Barturen G, Babaei S, Català-Moll F, et al. Integrative Analysis 32. Luijten KM a C, Tekstra J, JWJ B, et al. The Systemic Lupus
Reveals a Molecular Stratification of Systemic Autoimmune Erythematosus Responder Index (SRI); a new SLE disease activity
Diseases. Arthritis Rheumatol 2021;73:1073–1085. assessment. Autoimmun Rev 2012;11:326–9.
13. Lewis MJ, Barnes MR, Blighe K, et al. Molecular Portraits of Early 33. Ritchie ME, Phipson B, Wu D, et al. limma powers differential
Rheumatoid Arthritis Identify Clinical and Treatment Response expression analyses for RNA-sequencing and microarray stud-
Phenotypes. Cell Rep 2019;28:2455–2470.e5. ies. Nucleic Acids Res 2015;43:e47.
14. Banchereau R, Hong S, Cantarel B, et al. Personalized 34. Vremec D, O’Keeffe M, Hochrein H, et al. Production of interfer-
Immunomonitoring Uncovers Molecular Networks that Stratify ons by dendritic cells, plasmacytoid cells, natural killer cells,
Downloaded from https://academic.oup.com/bib/article/23/5/bbac332/6659743 by guest on 05 October 2022
Lupus Patients. Cell 2016;165:551–65. and interferon-producing killer dendritic cells. Blood 2007;109:
15. Toro-Domínguez D, Martorell-Marugán J, Goldman D, et al. Strat- 1165–73.
ification of Systemic Lupus Erythematosus Patients Into Three 35. Rönnblom L, Leonard D. Interferon pathway in SLE: one
Groups of Disease Activity Progression According to Longitu- key to unlocking the mystery of the disease. Lupus Sci Med
dinal Gene Expression. Arthritis Rheumatol Hoboken NJ 2018;70: 2019;6:e000270.
2025–35. 36. Davidson A. Targeting BAFF in autoimmunity. Curr Opin Immunol
16. Guthridge JM, Lu R, Tran LT-H, et al. Adults with systemic 2010;22:732–9.
lupus exhibit distinct molecular phenotypes in a cross-sectional 37. Chang W, Cheng J, Allaire JJ, et al. shiny: Web Application Frame-
study. EClinicalMedicine 2020;20(100291):100291. work for R. 2021.
17. Díaz-Peña R. Personalized Medicine in Autoimmune Diseases. J 38. Nishi H, Mayadas TN. Neutrophils in lupus nephritis. Curr Opin
Pers Med 2021;11:1181. Rheumatol 2019;31:193–200.
18. Yu H, Nagafuchi Y, Fujio K. Clinical and Immunological Biomark- 39. Jourde-Chiche N, Whalen E, Gondouin B, et al. Modular tran-
ers for Systemic Lupus Erythematosus. Biomolecules 2021;11:928. scriptional repertoire analyses identify a blood neutrophil signa-
19. Clough E, Barrett T. The Gene Expression Omnibus database. ture as a candidate biomarker for lupus nephritis. Rheumatology
Methods Mol Biol Clifton NJ 2016;1418:93–110. 2017;56:477–87.
20. Hoffman RW, Merrill JT, Alarcón-Riquelme MME, et al. Gene 40. Rovin BH, Parikh S, Alvarado A. The Kidney Biopsy in Lupus
Expression and Pharmacodynamic Changes in 1,760 Systemic Nephritis: Is it Still Relevant? Rheum Dis Clin North Am 2014;40:
Lupus Erythematosus Patients From Two Phase III Trials of 537–52.
BAFF Blockade With Tabalumab. Arthritis Rheumatol Hoboken NJ 41. Bauer JW, Baechler EC, Petri M, et al. Elevated serum lev-
2017;69:643–54. els of interferon-regulated chemokines are biomarkers for
21. Martorell-Marugán J, López-Domínguez R, García-Moreno A, active human systemic lupus erythematosus. PLoS Med 2006;3:
et al. A comprehensive database for integrated analysis of omics e491.
data in autoimmune diseases. BMC Bioinformatics 2021;22:343. 42. Andrade S d O, Julio PR, Nunes de Paula Ferreira D, et al. Predict-
22. Wing MKC from J, Weston S, Williams A, et al. caret: Classifica- ing lupus flares: epidemiological and disease related risk factors.
tion and Regression Training. 2019; https://CRAN.R-project.org/ Expert Rev. Clin Immunol 2021;17:143–53.
package=caret. 43. Crow MK, Type I. Interferon in the Pathogenesis of Lupus. J
23. Li S, Rouphael N, Duraisingham S, et al. Molecular signatures of Immunol Baltim Md 1950;192(192):5459–68.
antibody responses derived from a systems biology study of five 44. Isenberg DA, Petri M, Kalunian K, et al. Efficacy and safety
human vaccines. Nat Immunol 2014;15:195–204. of subcutaneous tabalumab in patients with systemic lupus
24. Chaussabel D, Quinn C, Shen J, et al. A Modular Analysis Frame- erythematosus: results from ILLUMINATE-1, a 52-week, phase
work for Blood Genomics Studies: Application to Systemic Lupus III, multicentre, randomised, double-blind, placebo-controlled
Erythematosus. Immunity 2008;29:150–64. study. Ann Rheum Dis 2016;75:323–31.
25. Weiner J, Domaszewska T. tmod: an R package for general and 45. Petri M, Fu W, Ranger A, et al. Association between changes
multivariate enrichment analysis. PeerJ Preprints, 2016;4:e2420v. in gene signatures expression and disease activity among
26. Menche J, Guney E, Sharma A, et al. Integrating personalized patients with systemic lupus erythematosus. BMC Med Genomics
gene expression profiles into predictive disease-associated gene 2019;12:4.
pools. Npj Syst Biol Appl 2017;3:1–10. 46. Hung T, Pratt GA, Sundararaman B, et al. The Ro60 autoantigen
27. Bolaños AB. Probability & Statistical Concepts: an Introduction 1977. binds endogenous retroelements and regulates inflammatory
28. Wang B, Mezlini A, Demir F, et al. SNFtool: Similarity Network gene expression. Science 2015;350:455–9.
Fusion. 2021. 47. Hu Y, Carman JA, Holloway D, et al. Development of a Molecular
29. Charrad M, Ghazzali N, Boiteau V, et al. NbClust: An R Package Signature to Monitor Pharmacodynamic Responses Mediated by
for Determining the Relevant Number of Clusters in a Data Set. In Vivo Administration of Glucocorticoids. Arthritis Rheumatol.
J Stat Softw 2014;61:1–36. Hoboken NJ 2018;70:1331–42.You can also read