Service Development Plan - Midwest Regional Rail System - Michigan Department of Transportation
←
→
Page content transcription
If your browser does not render page correctly, please read the page content below
Midwest Regional Rail System
Service Development Plan

Michigan Department of Transportation

         September 29, 2009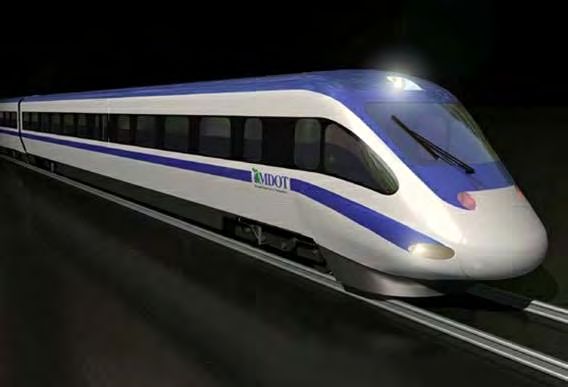
SECTION 1

                     MWRRI INTRODUCTION & SUMMARY

MWRRS Service Development Plan
Midwest Regional Rail System
Service Development Plan September 29, 2009
Service Development Plan for the
Midwest Regional Rail System
The Midwest Regional Rail System (MWRRS) has been under development since 1995, when the states
of Illinois, Wisconsin, Michigan, Indiana, Ohio, Minnesota, Iowa, Nebraska, and Missouri in partnership
with the Federal Railroad Administration and Amtrak, began to evaluate the potential role of High Speed
rail in the Midwest. The work of this initiative (MWRRI) has resulted in a well coordinated and integrated
110-mph rail Business Plan that defines the way in which the rail system should be implemented. This
Business Plan consists of an Executive Summary, MWRRI Project Notebook, Appendices, and
Cost/Benefit Updates (Attachments 1,2,3, and 4)
On July 27, 2009 the Governors of the States of Illinois, Indiana, Iowa, Michigan, Minnesota, Missouri,
Ohio, and Wisconsin and the Mayor of the City of Chicago executed a Memorandum of Understanding
for the “Implementation of High- Speed Rail Passenger Service and Connections Involving Corridors
Linking Cities in their Respective States” (Attachment 5). This document affirms that “all MOU
Participants recognize a priority to establish the Chicago Hub to corridors consisting of Chicago-St. Louis,
Chicago to Milwaukee-Madison, and Chicago to Detroit-Pontiac, (MWRRI Phase 1) that would form a
high speed hub in the heart of the nation with high-speed and conventional passenger service
connections radiating to seven other Midwestern states”.
The US Department of Transportation, Federal Railroad Administration’s (FRA) High Speed Intercity
Passenger Rail Program (HSIPR) provides an opportunity for the MWRRS to implement a number of the
corridors identified in MWRRI Business Plan. While the MWRRI recommended these corridors as part of
its Phase I Implementation, various financial and development issues have resulted in phasing
refinements within the MWRRI Phase 1 and Phase 3 plans and the delay in the implementation of Phase
2. These refinements in the MWRRI Phase 1 plans were necessary due to the complexity of the Chicago
Terminal Limits, particularly environmental and capacity issues between Chicago and Rondout on the
Chicago-Milwaukee-Madison corridor; Chicago to Dwight on the Chicago – St Louis corridor; and Chicago
to Porter on the Chicago to Detroit corridor. The MWRRI States submitted a Track 1B application,
Chicago Terminal Limits PE/NEPA (Illinois is the lead state) to resolve these complex issues. Therefore,
the MWRRI States have coordinated their Track 2 applications with the intention to “jumpstart” the
development of the entire MWRRS in accordance with the long term planning effort that has resulted in
this MWRRS Service Development Plan as the “overarching” SDP to the phased implementation of the
MWRRS. The refinements in the MWRRI implementation plan focused on assuring that the major
corridors emanating from the Chicago Hub are included in the “jumpstart”.
The refinements in the implementation plan of the MWRRI Phase I to “jumpstart’ the MWRRS are as
follows:
MWRRI Phase 1:
Midwest Regional Rail Initiative Page 1Midwest Regional Rail System
Service Development Plan September 29, 2009
Chicago – Milwaukee – Madison (Wisconsin is the lead state): The original MWRRI Phase 1 has
10 round trip trains per day from Chicago to Milwaukee operating at a maximum speed of 79
mph with 6 trains continuing to Madison operating at a maximum speed of 110 mph. Due to
capacity constraints and needed associated environmental clearances within the Chicago
Terminal Limits, this corridor has been refined to retain the current 7 round trip trains per day
to Milwaukee with 6 continuing to Madison. Speed increases in the Milwaukee to Madison
corridor will be consistent with progress on Positive Train Control. The Milwaukee to Madison
Corridor Service Development Plan contains the operations and ridership metrics of this service.
Chicago – St Louis (Illinois is the lead state): The original MWRRI Phase 1 has 8 round trip trains
per day from Chicago to St Louis operating at a maximum speed of 110 mph. Due to
environmental and capacity issues in the Chicago Terminal Limits and the addition of the Union
Pacific Intermodal Facilities south of Joliet, the phasing of this corridor has been refined to
complete the initial implementation of 5 round trip trains per day, with 3 trains operating at
maximum speed of 110 mph and 2 trains operating at a maximum speed of 79 mph between
Chicago and St Louis in accordance with the previous environmental clearances. Concurrently,
Chicago-St Louis will be developed to the original MWRRI Phase 1 service resulting in an
increase in track capacity needed to permit the operation of 8 round trip trains at a maximum
speed of 110 mph with the increased UP freight traffic on shared right of way.. The Chicago to
St Louis Corridor Service Development Plans for the two concurrent phases outline the
operations and ridership metrics associated with this service.
Chicago – Detroit / Pontiac (Michigan is the lead state): The original MWRRI Phase 1 has 6
round trip trains per day from Chicago to Detroit/Pontiac operating at a maximum speed of 110
mph. Due to capacity constraints and associated environmental issues within the Chicago
Terminal Limits (South of the Lake Corridor), the phasing of this corridor has been refined to
maintain the current 3 round trip trains per day between Chicago and Detroit/Pontiac and
complete significant improvements within the corridor consistent with associated
environmental documentation. These significant improvements consist of a coordinated and
comprehensive grouping of projects that eliminate a series of chokepoints between Chicago and
Porter and improve track conditions and signals between Porter and Ann Arbor resulting in
operations in this segment (Porter to Ann Arbor) at a maximum speed of 110 mph. The Chicago
to Detroit/Pontiac Service Development Plan contains detailed operation and ridership metrics
associated with this service.
MWRRI Phase 2:
Chicago to Minneapolis/St. Paul (Minnesota is the lead state): This phase was predicated on 6
round trip trains per day to Twin Cities with 4 additional round trip trains per day to Madison and
was scheduled for implementation one year after Phase 1. Due to the environmental requirements
to determine the exact route between Milwaukee and Minneapolis/St Paul, this phase has been
deferred until the route has been selected and environmental requirements for funding completed.
Minnesota, as the lead state, has submitted a Track 3 application to fund a study in this corridor
Midwest Regional Rail Initiative Page 2Midwest Regional Rail System
Service Development Plan September 29, 2009
MWRRI Phase 3:
Chicago – Iowa City (Iowa is the lead state): This phase was based on 5 round trip trains per day
from Chicago to Iowa City and was scheduled for implementation two years after Phase 1
operating at maximum speed of 90 mph between Aurora and Wyanet and a maximum speed of
79 mph between Wyanet and Iowa City. Since the announcement of the American Recovery
and Reinvestment Act, Iowa, in partnership with Illinois, decided to advance this phase into Year
1 with an initial phase consisting of 2 round trip trains per day to Iowa City operating at a
maximum speed of 79 mph. Advancing this corridor to Year 1 meets the goal of the MWRRI
States to” jumpstart” all corridors emanating from the Chicago Hub to the states neighboring
Illinois and is consistent with the Memorandum of Understanding signed by the Governors.
The selection of the MWRRI Phase 1 corridors for initial implementation was made as a result of a
Quality Audit Review and Risk Analsyis (Attachment 6)conducted in 2006 (participants included experts
from AECOM, RL Banks, Amtrak, and the MWRRI States). The Quality Audit concluded that the work
performed to develop the MWRRS ridership and revenue forecasts, capital cost estimates, and financial
plan was sound. Subsequent ridership studies undertaken by MWRRI States as part of their “work in
progress” in developing their corridors have confirmed that the MWRRI ridership projections are
reasonable.
The Quality Audit Review also determined that the operating cost projections were reasonable although
lower than historical Amtrak operating costs. The maintenance and cyclic capital costs were calculated
by the MWRRI in coordination with Amtrak using the FRA Technical Report by Zeta Tech. These
calculations (Attachment 7)produced an annual maintenance cost of $3.79 per passenger train mile and
an annual cyclic capital cost of $3.21 per passenger train mile. Although the FRA Zeta Tech study was
based on freight railroad cost metrics, the freight railroads have indicated that the States should pay
more than these amounts. The overall operating costs for modern high speed rail equipment and,
particularly the maintenance cost component, will continue to be subject of future negotiation with
Amtrak and the host freight railroads.
The MWRRI States understand the importance of Risk Management in their decision making process.
The Risk Analysis undertaken as part of the Quality Audit identified certain risk factors to the successful
implementation of the entire MWRRS. These risk factors were generally associated with operational
efficiency and funding. These risk factors were essentially mitigated by phasing the MWRRS to initially
build-out the most developed and high density Phase 1 corridors. The addition of the Chicago to Iowa
City corridor into Year one meets the criteria established to connect the Chicago Hub to the neighboring
states of Illinois and adds minimal risk. The operations and ridership metrics developed for the
refinements in the implementation of the MWRRI Phase 1 and Phase 3 have been reviewed and are
consistent with the risk mitigation strategy.
In 2007, the MWRRI States developed a Draft Purpose and Need for the MWRRS (Attachment 8), a
Scope of Work for undertaking preliminary engineering and environmental studies of the MWRRI Phase
Midwest Regional Rail Initiative Page 3Midwest Regional Rail System
Service Development Plan September 29, 2009
1 corridors (Attachment 9), and a Scope of Work for undertaking a programmatic environmental study
of the other MWRRS corridor outside of Phase 1 (Attachment 10).
To meet the HSIPR application requirements, the following provides a Service Development Plan (SDP)
for the MWRRS as a whole to support the formulation of a Service Development Plan for each corridor
of the MWRRS for which a Track 2 application is submitted. As defined by the FRA, a Service
Development Plan is a plan for developing High-Speed Rail/Intercity Passenger Rail Service, either by
initiating new service or improving existing service. It is typically focused on distinct phases and /or
geographic areas. The SDP includes three general topics:
1. Rationale: including purpose and need; a description of the Midwest Regional Rail System
(MWRRS) transportation challenges and opportunities based on current and forecasted travel
demand and capacity conditions
2. Service/operating plan and prioritized capital plan: including the description of the train service
to be provided for each phase of new or improved Intercity Passenger Service.
3. Implementation plan: including project management approach, stakeholder agreements and
financial plan
The MWRRS completed a major planning effort in June 2004, and documented its conclusions in the
Project Notebook. This Project Notebook and Appendices addresses all the subject areas required by the
SDP, so the Project Notebook can in essence, be considered an SDP for the entire MWRRS network. An
Executive Report was issued in September 2004 and the Project Notebook was amended in November
2006 with an update to Chapter 11, Benefit and Cost Analysis. (Refer to Attachments 1,2,3, and 4)
Previous Midwest High Speed Passenger Rail studies supported the development of the project
notebook. A total of 49 studies (refer to the list in Attachment 11) have been completed as follows:
Corridor Number of Studies
Midwest System (as a whole) 5
Chicago – Detroit/Pontiac 6
Chicago-Toledo-Cleveland 7
Chicago-Indianapolis-Cincinnati 4
Chicago-Carbondale 3
Chicago-St. Louis 5
St. Louis – Kansas City 5
Chicago-Quincy-Des Moines-Omaha 4
Chicago-Milwaukee-Madison-St Paul 10
Grand Total MWRRI Studies 49
Midwest Regional Rail Initiative Page 4Midwest Regional Rail System
Service Development Plan September 29, 2009
Since 2004, states have been working individually on development plans for their own corridors. All
these efforts can be considered “work in progress” or interim work that is still under development. With
respect to the overall MWRRS vision, the most recent update consists of the 2004 Project Notebook.
This document continues to guide and direct the efforts of the individual states, as they seek to develop
their own respective parts of the system, in a manner consistent with the overall framework and vision
that the Project Notebook provides.
In March, 2008, the MWRRI prepared a Draft Purpose and Need Statement for Phase 1 of the MWRRS
(Attachment 7). This document stated that the purpose of the MWRRI and the proposed action is to
provide a means to help meet future regional travel needs through improvements to the level and
quality of regional passenger rail service. The proposed action offers an opportunity to provide reliable
and competitive passenger rail service as an attractive alternative transportation choice. To address the
purpose of meeting regional travel needs by preserving, improving, and expanding the passenger rail
service in the Phase 1 corridors, market research to gauge the feasibility of the MWRRS was conducted.
The research concluded that the most important prerequisites for attracting and retaining rail riders are
to overcome the current lack of reliability, infrequent service and provide travel times that are equal or
better than the auto mode. The needs (principal service attributes) of the MWRRS are:
Improved travel times and frequencies
Competitive fares that maximize revenue yields
Use of modern equipment
Improved accessibility and reliability
Upgraded on-board and station amenities
The MWRRS Service Development Plan and the complementary MWRRI Phase 1 and Phase 3 Corridor
Service Development Plans are consistent with this Purpose and Need as further explained in the
individual Corridor-wide Service NEPA documents.
For the purpose of this submission, the SDP for individual states’ Corridor Programs will remain
consistent with the Project Notebook. Specific corridor level information has been documented as it
currently exists within the Project Notebook, with some selective updates to reflect more recent
information, particularly in the area of Capital costs.
While capital costs have been updated, the related ridership, revenue, operational, financial and
economic analyses have not yet been correspondingly updated. Dollar values need indexing from $2002
up to $2009, but there have also been changes in the transportation market, largely driven by higher
fuel prices, but also demographic changes and structural economic shifts. Amtrak and all passenger rail
operators have noticed a strong increase in demand since the Project Notebook was completed in 2004.
While capital costs may have gone up, so too have ridership, revenue, consumer surpluses and all the
social benefits associated with operation of the MWRRS system.
Midwest Regional Rail Initiative Page 5Midwest Regional Rail System
Service Development Plan September 29, 2009
Because of this, the MWRRS Cost Benefit results calculated in 2006 are, if anything, conservative in
today’s transportation environment, despite the apparent increase in capital costs. The time frame for
developing this submission has not permitted recalibration of the ridership models or recalculation of all
the financial projections for all corridors.
Because the material in the SDP is largely drawn from the MWRRS Project Notebook, the Project
Rationale, Financial, Economic and Implementation Plan will be addressed at the level of the whole
network. Some parts of the service/operating plan, such as equipment cycling and train equipment
consist standards, also make more sense to address at the network rather than individual corridor level.
Crew and timetabling requirements, as well as line capacity simulation and capital investment strategies
are presented at the individual corridor level.
Topic #1: Rationale
Since 1996, the Midwest Regional Rail System (MWRRS) has advanced from a series of individual
corridor service concepts, into a well-defined, integrated vision to create a 21st century regional
passenger rail system. This vision reflects a paradigm shift in the manner in which passenger rail service
will be provided throughout the Midwest, and forges an enhanced partnership between USDOT, FRA
and the Midwestern states for planning and providing passenger rail service. This system would use
existing rights-of-way shared with existing freight and commuter services and would connect nine
Midwestern states and their growing populations and business centers. System synergies and
economies of scale, including higher equipment utilization, more efficient crew and employee
utilization, and a cooperative federal and state infrastructure and rolling stock procurement, can be
realized by developing an integrated regional rail system.
Collectively, the key elements of the MWRRS plan will improve Midwestern travel well beyond currently
available train service. These elements include:
Upgrading existing rail rights-of-way to permit frequent, reliable, high-speed passenger train
operations. These generate significant improvements in rail efficiency, reliability and on-time
performance.
Operation of a hub-and-spoke passenger rail system providing through service and connectivity
in Chicago, to locations throughout the Midwest region.
Introduction of modern train equipment with improved amenities operating at speeds up to
110-mph.
Provision of multimodal connections and feeder bus systems to improve system access.
Development of a rail service that satisfies FRA’s Public/Private partnership requirements, as
defined in FRA’s document High-speed Ground Transportation for America (1997). Accordingly,
it has been shown that the MWRRS has the potential to run without operating subsidy and its
implementation will generate substantial public benefits, exceeding its cost, for the regional and
US economies.
Midwest Regional Rail Initiative Page 6Midwest Regional Rail System
Service Development Plan September 29, 2009
The MWRRS would encompass a rail network of more than 3,000 route miles and serve nine states with
a combined population of 60 million people. About 80 percent of the region’s population lives within an
hour drive of either an MWRRS rail station or a feeder bus station. As a result of the interstate character
of the MWRRS network, a strong Federal role is both necessary and appropriate for promoting its
development.
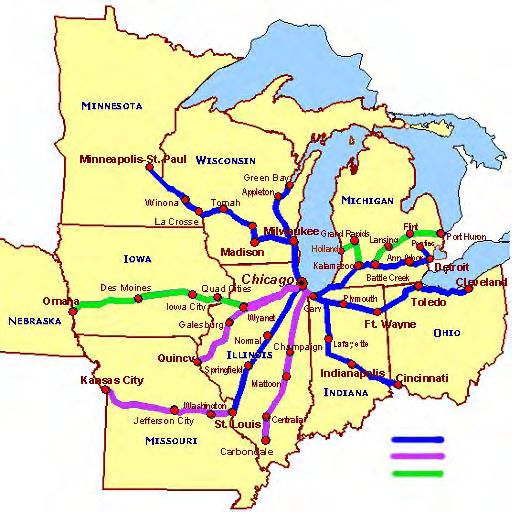
The frequent service proposed for the MWRRS (Exhibit 1-1 from the Project Notebook) serves
intermediate sized cities on each corridor, such as Jefferson City, Springfield, Des Moines, Indianapolis,
Madison and Toledo, as well as their respective larger endpoint cities such as Kansas City, St. Louis,
Omaha, Cincinnati, Twin Cities and Cleveland.
Mainline service to destinations such as Detroit and Twin Cities is supplemented by branch line services
to Lansing, Grand Rapids and Green Bay.
Exhibit 1-1
Proposed Midwest Regional Rail System
Midwest Regional Rail Initiative Page 7Midwest Regional Rail System
Service Development Plan September 29, 2009
Implementation of the MWRRS will increase mobility choices and stimulate economic development
throughout the region. The system affords the opportunity to:
Develop attractive public/private partnerships that will enhance both rail and bus travel in the
Midwest
Achieve significant reductions in travel times and improve service reliability
Introduce passenger rail service to Midwest areas currently not served by passenger rail
Introduce an alternative to auto travel to many small towns and cities of the Midwest that lack
travel choices
Introduce a regional passenger rail system designed to generate revenues that cover operating
costs when it is fully implemented
Provide major capital investments in rail infrastructure to improve passenger and freight train
efficiency, safety and reliability on shared rights-of-way
Provide impetus for station-area development
The analysis demonstrated that the proposed service, with modern stations and a high level of on-board
amenities could attract significant numbers of riders and achieve a respectable modal market share for
trips up to 500 miles.
Intermodal Complementarity
The passenger rail market analysis confirms there is a substantial market for intercity travel between all
the cities on the MWRRS network. In many markets, the MWRRS provides a faster and more cost-
effective alternative to auto and bus travel. Furthermore, the MWRRS provides a more cost-effective
means of travel than air in many of the smaller, urban areas on or near an MWRRS corridor.
In the 2000 base year, 498 million trips within the Midwest region, 98 percent were made by auto; 1.3
percent by air; 0.4 percent by bus and 0.3 percent by rail. Auto trips include a large number of relatively
short trips (100 to 150 miles), while the public modes generally include longer trip lengths, typically 150
to 250 miles for bus and rail and 250 to 500 miles for air. In other words, while the market share of the
public modes is small (2.0 percent for air, rail and bus), the public modes have a larger share of the total
vehicle or passenger miles, and therefore account for a much larger proportion of the person miles
traveled. Of the public modes, of the existing market, 67 percent of the trips are made by air, 21 percent
by bus and 12 percent by rail.
Of the total rail ridership forecast for 2025, 6 percent is a result of the natural growth of travel demand
in the region, 10 percent is due to increased mobility or induced demand, and 84 percent is due to
diverted demand. Induced demand is defined as those trips that would not have been made without the
introduction of the MWRRS, while diverted demand is the result of travelers changing travel mode. Of
Midwest Regional Rail Initiative Page 8Midwest Regional Rail System
Service Development Plan September 29, 2009
the diverted demand for the MWRRS, 58 percent is from auto, 23 percent from bus and 20 percent from
air. (see Exhibits 4-25 and 4-37 in the Project Notebook).
Exhibit 4-37
Base and Forecast Year Market Shares for the Public Modes
Base Year - 2000
Rail
12%
Bus
21%
Air
67%
Rai l Forecast Year - 2025
47% Bu s
11%
Ai r
42%
MWRRS implementation would add significant capacity to augment the capacity of the existing highway
and air systems. While most of the rail travel diversion would come from automobile, the MWRRS would
provide a moderate level of airport congestion relief as well.
Since air service is increasingly focused on trips over 300 miles, the MWRRS tends to complement rather
than compete with air service in the Midwest. Even so, the convenience of direct downtown-to-
downtown accessibility provided by the system will enable it to divert some short-haul air traffic to rail.
Most of the air impact would come from reduction of very short flights that offer marginal profitability
to the airlines anyway. Since the MWRRS would be more efficient than air for many of these short trips
under 300 miles, this would allow airlines and airports to redeploy assets to more economically
productive uses.
There would be some shift of long haul trips from bus to rail as well. However, the overall use of bus
service in the Midwest would be likely to grow through development of a feeder bus network, like the
one that already exists in California. This would connect the MWRRS rail system to smaller outlying
Midwest Regional Rail Initiative Page 9Midwest Regional Rail System
Service Development Plan September 29, 2009
communities, which would likely result in an increased overall usage of a restructured bus network.
Greyhound participated in development of this feeder bus plan and has indicated its support for it.
Topic #2: Service/Operating Plan and Prioritized Capital Plan
The operational characteristics of the proposed MWRRS service have been extensively analyzed over the
course of a multi-year planning effort. At the network level, the most important operational aspects of
the system include the development of a standard, interoperable MWRRS rolling stock
configuration/train consist that can freely rotate and operate on all the MWRRS corridors.
In addition the development of standardized maintenance and repair procedures and a network of shop
facilities at Pontiac, St. Louis, Kansas City, Madison and St. Paul has been recommended. This provides
for major overhaul capabilities as well as progressive maintenance and periodic inspection needs for the
equipment. (If St. Louis cannot maintain and repair at least three trains per night, a sixth shop will be
needed and has been recommended for Cleveland, OH. See page 7-17 of the Project Notebook.)
The adoption of a standardized train consist, with cycling of equipment between routes allows for a
reduction in equipment dwell times, particularly at the downtown Chicago hub, promoting more
schedule flexibility, better equipment utilization and a reduced requirement for “protect” equipment,
since one spare equipment set could protect the emergency needs for multiple MWRRS routes. High
equipment utilization along with shared maintenance facilities are the key components for attaining
projected economies of scale associated with implementation of the MWRRS network as a whole.
An additional analysis that was performed for the network or “system” operations relates to the
capacity of Chicago Union Station. This section, therefore, will describe the underlying operational
analyses related to:
Rolling stock configuration / train Consists
Equipment schedules
Chicago Union Station
Midwest Regional Rail Initiative Page 10Midwest Regional Rail System Service Development Plan September 29, 2009 Rolling Stock Configuration/Train Consists As described in Section 7.4 of the Project Notebook, the intent of the MWRRS agreement was to develop a standardized train consist assumption for planning purposes, as well as to pursue an integrated train equipment procurement process. The standardized train consist has generally been referred throughout the Project Notebook as the “Generic Train”. This “Generic Train” assumption for the MWRRS evolved over time. The early 1998 MWRRS assessment was based on the Adtranz IC3 DMU, but later in 2000 the “generic” equipment assumption was changed to the Talgo T-21 locomotive-hauled train instead. Please note that selecting the generic passive tilt technology for planning purposes does not mean that Talgo would necessarily be selected as the equipment manufacturer for the MWRRS. In fact the Talgo was actually higher cost and slightly slower than the DMU on most corridors. This makes the MWRRS ridership, revenue and operating cost forecasts more conservative than if the DMU had been selected. Therefore the selection of Talgo as the “generic” train technology for analysis purposes does not imply that Talgo was either “recommended” or “optimized” for the system. It was simply used as a representative train for planning purposes. Selection of a locomotive-hauled, passive tilt technology actually increases the MWRRS flexibility for choosing a technology, because multiple manufacturers and technologies will be able to meet the broader performance parameters provided by this more conservative approach. The MWRRS plan assumes the purchase of 63 trainsets, each with a capacity of 190 to 200 passengers. (The recommended train size was subsequently revised upwards to a 300-seat train.) Subsequent studies and increasing ridership on existing routes has demonstrated that the seating capacity may need to be much greater than 300 on certain corridors The assumed cost was based on information received from the manufacturers; however, manufacturers’ price quotes were only preliminary estimates. It is understood that the final cost will be determined by a set of factors to include the degree of competition, delivery dates, level of customization, and number of trainsets ordered. However, these preliminary estimates provided a reasonable basis for the MWRRS analysis. Volume discounts included in the analysis were predicated on the states collectively purchasing the rolling stock on a system-wide basis rather than individually, on a by-corridor basis. Midwest Regional Rail Initiative Page 11
Midwest Regional Rail System
Service Development Plan September 29, 2009
Equipment Schedule Analysis
Sections 7.5 and 7.6 of the Project Notebook presents an extensive and detailed analysis whereby the
equipment sets were “cycled” through the complete MWRRS train schedules, to ensure that the plan
specified the purchase of the correct number of train sets, but even more importantly, to verify that the
planned maintenance shops were in the right locations and had sufficient capacity to maintain the train
sets. Sections 7.8 and 7.9 provide additional information on maintenance base requirements for
supporting MWRRS operations.
The train schedules could be covered with 57 train-sets but the recommendation was to purchase 10%
extra trains, for shop counts and protect equipment. A feasible rotation could be developed for any
shop-siting plan that offers capacity of at least 16 trains per night. Regarding the development of shops
for maintaining the trains, the analysis reached the following conclusions:
The final choice of shop locations must largely hinge on the availability of reasonably priced real
estate in reasonable proximity to the endpoint stations. It was therefore recommended that
further study be undertaken to find a better and larger location for the proposed St. Louis shop,
and to identify specific sites for the proposed Kansas City and St. Paul shops.
At this time, only the shops proposed at Pontiac, Cleveland and Madison have adequate sites
identified.
A two-train shop at St. Louis would provide insufficient capacity to meet the needs of the 2014
MWRRS system. A minimum three-train capacity is needed here to increase the system
production rate to 16 trains per night.
The proposed shops in Kansas City and St. Paul have not been sited yet.
From an operational perspective, Chicago remains a logical location for an MWRRS equipment
maintenance facility, if a suitable site could be identified.
Chicago Union Station
Section 7.7 of the Project Notebook presents an analysis of Chicago Union Station operations. The key
concern was how to accommodate the projected growth of METRA commuter service, along with
existing Amtrak long distance service and new MWRRS service at the Chicago Union Station site.
Midwest Regional Rail Initiative Page 12Midwest Regional Rail System
Service Development Plan September 29, 2009
Exhibit 7- 1
CUS Track Occupancy: MWRRS vs. Long Distance
14 METRA Commuter
Peak Periods
7 Shared Tracks 7 Dedicated Tracks
12
10
# of Trains
8
6
4
2
0
5AM 7AM 9AM 4PM 7:30PM
MWRRS Ldist
Exhibit 7- 2
CUS Track Occupancy: North vs.South
14
METRA Commuter
7 Shared Tracks
12
Peak Periods
10
# of Trains
8
7 Dedicated Tracks
6
4
2
0
5AM 7AM 9AM 4PM 7:30PM
North South
Midwest Regional Rail Initiative Page 13Midwest Regional Rail System
Service Development Plan September 29, 2009
Equipment dwell times at CUS were assumed consistent with those developed by the equipment cycling
analysis. The key result of this analysis, as shown by Exhibits 7-1 and 7-2 from the Project Notebook, was
that MWRRS could operate within Amtrak’s current seven-track allocation at CUS. The Capitol Limited
that departs at 5:35 PM requires use of one Metra shared track for 30 minutes. At off-peak, MWRRS
would use no more than one-half to one-third of the capacity of the Metra shared tracks for mid-day
train storage. By shunting four trains to the yard for mid-day storage, the MWRRS could operate within
the seven-track constraint during all peak hours except for 30 minutes of the evening rush.
The MWRRI recognizes the inherent problems associated with the capacity of Chicago Union Station. In
addition to the analysis described above, the MWRRI has reviewed the Study completed in 2002 by the
HDR/CANAC Team and its Findings. The simulation studies undertaken by HDR/CANAC confirmed that
CUS is nearing capacity at peak hours. Therefore, the MWRRI, as part of the Chicago Terminal Limits
PE/NEPA Project will undertake a further detailed analysis of the CUS, in addition to the one described
above, and the impact of future MWRRS trains.
MWRRI Coordination with the Chicago Region Environmental and Transportation Efficiency Program
The State of Illinois and the City of Chicago have joined with the passenger and freight railroads serving
the Chicago region to establish Program Level Goals as follows:
Improve the efficiency and reliability of local and national passenger and freight rail service in
and through the Chicago region;
Reduce motorist, passenger rail and freight rail delays to travel in and through the Chicago
region;
Reduce highway and rail traffic congestion in the Chicago region;
Improve rail-highway grade crossing safety in the Chicago region;
Provide national, regional and local economic benefits;
Provide environmental (air quality) benefits;
Provide national, regional and local energy benefits.
In order to advance these goals, the MWRRI states and the City of Chicago have partnered with the
freight railroad’s Chicago Planning Group in submitting the Track 1 application for the Chicago Terminal
Limits PE/NEPA project in seeking a cooperative agreement with FRA for the purpose of understanding
the inherent complex problems within the Chicago region that constrains the operations of the freight
and passenger rail network and identifying solutions that ensure efficient passenger rail operations.
Additional Operations Analysis Provided at the Specific Corridor Level
The MWRRS Project Notebook developed additional analysis with respect to the specific operations of
each corridor. These analyses, which are specific to each individual corridor, show how the proposed
Corridor Program makes use of the facilities that would be shared with freight, commuter rail, and other
intercity passenger rail services. They show how the proposed Corridor Program protects the quality of
those other services through a planning horizon year and under assumptions that were agreed to with
the other partners.
The following components of the operating plan are described in the portion of the SDP that are specific
to each corridor:
Midwest Regional Rail Initiative Page 14Midwest Regional Rail System
Service Development Plan September 29, 2009
Service frequency
Time table (including time-distance “stringline” diagrams as available)
General station locations
Intermodal connections
Railroad operations simulations
Crew schedule analyses
On an overall basis, the proposed MWRRS operating plan has been designed to optimize the relationship
between service levels, estimated ridership and generated revenue. Compared to current regional
passenger rail services, the MWRRS operating plan dramatically improves reliability, increases frequency
and reduces travel times. Depending upon the corridor, roundtrip frequencies are increased by two and
five times compared to existing services, improving opportunities to make connecting trips through
Chicago Union Station. Improvements in travel times range from 32 percent between Chicago and the
Twin Cities, to 56 percent between Chicago and Cincinnati. Exhibit 7-1 from the Project Notebook
compares travel times by mode on selected MWRRS corridors.
Midwest Regional Rail Initiative Page 15Midwest Regional Rail System
Service Development Plan September 29, 2009
Exhibit 7-1
Estimated Travel Times to Chicago by Corridor – 2020
Train Travel Times
MWRRS
Current Reduction in Percent
Corridors MWRRS
Service Travel Time Reduction
Chicago-Detroit 3 hrs 46 mins 5 hrs 46 min 2 hrs 00 min 35.6%
Chicago-Cleveland 4 hrs 23 mins 7 hrs 16 mins 2 hrs 53 mins 39.7%
Chicago-Cincinnati 4 hrs 08 mins 9 hrs 25 mins 5 hrs 17 mins 56.1%
Chicago-Carbondale 4 hrs 22 mins 5 hrs 30 mins 1 hr 08 mins 20.6%
Chicago-St. Louis 3 hrs 50 mins 5 hrs 30 mins 1 hr 40 mins 30.3%
St. Louis-Kansas City 4 hrs 14 mins 5 hrs 40 mins 1 hr 26 mins 25.3%
Chicago-Omaha 7 hrs 02 mins 8 hrs 37 mins 1 hr 35 mins 18.4%
Chicago-Twin Cities 5 hrs 37 mins 8 hrs 15 mins 2 hrs 38 mins 31.9%
Chicago-Milwaukee 1 hr 05 mins 1hr 29 mins 0 hr 24 mins 43.8%
* Based on Express MWRRS Schedule.
Along almost every corridor, the MWRRS provides more service than is currently operated. MWRRS
either replaces Amtrak’s short-distance Chicago Hub trains, or adds service to new routes not presently
served by Amtrak. Exceptions to this are the Omaha line through Iowa, the Indianapolis-Cincinnati line
and direct service to Madison, WI and Ft. Wayne, IN using different routes than those currently utilized
by Amtrak. Implementation of the MWRRS will help Amtrak’s long-distance trains by improving track
speed and covering the costs of many station and yard facilities. An upgraded passenger infrastructure
will reduce delays currently incurred by Amtrak on busy freight tracks. Exhibit 7-2 from the Project
Notebook compares 2004 Amtrak service to the number of round trips planned for the fully
implemented MWRRS.
Midwest Regional Rail Initiative Page 16Midwest Regional Rail System
Service Development Plan September 29, 2009
Exhibit 7-2
Passenger Rail Service Comparison (Roundtrips)
2004 Fully Implemented
City Pair
Amtrak Service MWRRS
Chicago - Detroit 3 9
Chicago-Kalamazoo/Niles 4 14
Kalamazoo/Niles-Ann Arbor 3 10
Ann Arbor-Detroit 3 10
Battle Creek-Port Huron 1 4
Kalamazoo-Holland 0 4
Detroit-Pontiac 3 7
Chicago - Cleveland 2* 8
Chicago-Toledo 2* 8
Toledo-Cleveland 2* 9**
Chicago - Cincinnati 1* 5
Chicago-Indianapolis 1* 6
Indianapolis-Cincinnati 1* 6**
Chicago - Carbondale 2* 2
Chicago-Champaign 2* 5
Chicago-Carbondale 2* 2
Chicago - St. Louis 3* 8
Chicago-Joliet 3* 8
Joliet-Springfield 3* 8
Springfield-St. Louis 3* 8
St. Louis - Kansas City 2 6
St. Louis-Kansas City 2 6
Chicago - Quincy 1 4
Chicago - Omaha 1 4**
Chicago-Naperville 3* 5
Naperville-Rock Island 0 5
Rock Island-Iowa City 0 5
Iowa City-Des Moines 0 5
Des Moines-Omaha 0 4
Chicago – Twin Cities 1* 6
Chicago-Milwaukee 8* 17
Milwaukee-Madison 0 10**
Madison-St. Paul 0 6
Milwaukee-Green Bay 0 7
* Includes Amtrak long-distance trains
** MWRRS route differs from current Amtrak service
Midwest Regional Rail Initiative Page 17Midwest Regional Rail System Service Development Plan September 29, 2009 Compared to the existing service, the MWRRS plan generates operating efficiencies by using new, modern trains, by maintaining equipment to maximize availability, and by running faster to maximize labor and equipment productivity. The MWRRS will operate as a hub-and-spoke system with seven main corridors plus branch lines, all converging on Chicago Union Station. A hub-and-spoke system facilitates the sharing of trains between routes for better equipment utilization and allows convenient passenger transfers between routes. It offers an array of travel options at the hub, and fosters efficiencies in the use of equipment and deployment of manpower. The MWRRS plan includes the use of standardized train technology and rolling stock amenities throughout the system. Because of constraints of available land, the MWRRI Steering Committee decided that MWRRS equipment maintenance shops need to be located at route endpoints rather than in Chicago. This requirement to rotate equipment into shop facilities adds complexity to the MWRRS operating plan. Since not every route will have its own shop, standard train consists are essential to facilitate necessary equipment cycling between routes. Methodology for MWRRS Train Schedule Development MWRRS train schedules were developed using the TRACKMAN™ and LOCOMOTION™ software systems1. TRACKMAN™ was used to identify all infrastructure characteristics, while LOCOMOTION™ monitors train technology capabilities. Information such as acceleration and deceleration rates of different train technologies and maximum allowable speeds on curves by use of various tilt technologies were incorporated into the simulations. Train speed and running time profiles were generated for different combinations of infrastructure and equipment investments. Three different train technologies were compared and any of the three could perform within the required operational parameters for the MWRRS. A life cycle cost analysis verified that two of the three technologies could operate within the cost parameters of the business plan. It was therefore decided that MWRRS operating and financial plans should adopt a conservative posture based on the higher-cost technology of the two that met the financial criteria – specifically by assuming use of Talgo passive tilt technology as the MWRRS generic train. Originally, skip-stop service was proposed so some trains could bypass small stations. That concept was abandoned in favor of an express/local service pattern. Local service makes all station stops, while express service runs with limited stops throughout the day. 1 Both TRACKMAN™ and LOCOMOTION™ are proprietary software systems developed by Transportation Economics & Management Systems, Inc. Midwest Regional Rail Initiative Page 18
Midwest Regional Rail System
Service Development Plan September 29, 2009
Extra time, (i.e., recovery time) was added to each train schedule as a contingency, so that some level of
delay can be incurred without causing late train arrivals. Train delays can be extremely disruptive since
late arrivals not only delay passengers and result in missed connections, but can also upset equipment
cycling, crew allocation and terminal operations. Capacity constrained corridors with heavy freight
traffic need extra recovery time. Specifically, recovery time was added to schedules as follows:
Five percent for lines with limited freight activity:
Chicago-Detroit and Michigan branch lines
Chicago-Cincinnati
Chicago-St. Louis
Chicago-Toledo (Southern Alignment)
Eight percent for moderate freight activity:
Chicago-Carbondale
Chicago-Quincy/Omaha
Ten percent for very heavy freight activity:
Toledo-Cleveland
St. Louis-Kansas City
Chicago-Twin Cities
Once schedules were developed, they were input to the COMPASS™ demand forecasting model2 for
estimating ridership and revenue. During MWRRS implementation, a 10 percent contingency for
construction travel time was included in revenue forecasts for the implementation period. This extra
time will be needed to offset likely train delays during the track construction period.
MWRRS service will operate an equivalent of 312 days per year, reflecting 5-day weekday schedules and
half-day service on Saturday (largely morning) and Sunday (largely evening.) Based on the anticipated
ridership on each line and by using a target load factor of 65-70 percent (on the peak segment
throughout the day) a 300-seat train was determined to be most appropriate for the MWRRS. Exhibit 7-
3 from the Project Notebook shows train frequency and average passengers per train by route segment.
2
COMPASS™ is proprietary software system developed by Transportation Economics & Management Systems, Inc.
Midwest Regional Rail Initiative Page 19Midwest Regional Rail System
Service Development Plan September 29, 2009
Exhibit 7-3
Projected 2020 Daily Round Trips per Track Segment
Minneapolis–
Minneapolis–St. Paul
Green Bay
152 85
6 7
Brookfield Grand
98 137 Rapids 4 185 Port
A 300-seat train Milwaukee Huron
provides adequate Madison 10 29 Pontiac
Holland 4
capacity on these 106 126
Battle Creek
36 Detroit
17 Kalamazoo 81
peak load segments 171 Dearborn
12 10
Des Moines Naperville 14 217 Toledo Cleveland
Omaha 93 Rock Island 9 Whiting
25 Joliet 186 Wanatah 62 48
162 149 Homewood
165 Fort Wayne
4 5 Princeton 9
Galesburg 120
51 235 202 8
Macomb
4 98 5
24
Quincy 8
Springfield Indianapolis
181
Kansas 6
City 148 Champaign 77
Cincinnati
Jefferson
48 City 120
71 2 LEGEND
6 St. Louis
XXX # Riders per Train (avg)
x # Trains per track
* Based on a 312-day year segment
Carbondale
Midwest Regional Rail Initiative Page 20Midwest Regional Rail System Service Development Plan September 29, 2009 The need to use a standardized 300-seat train results in slightly higher than desirable loadings on some lines with lower than desirable loadings on other segments. For example, the Cleveland line east of Ft. Wayne3 and the Omaha line west of Des Moines are lightly used; but the Michigan and St. Louis routes are heavily used, and could support additional train frequency. Nonetheless, planned schedules with 300-seat trains offer enough capacity to accommodate demand through 2020. Line Capacity Analysis Methodology The results of Line Capacity analysis performed for each segment are summarized in the individual corridor-level SDP’s. However, it is important to note that every segment of the MWRRS system did receive some level of capacity assessment in order to develop a mitigation cost estimate. Those segments having light to moderate freight train volumes received an “Ideal Day” assessment, whereas those lines with significant capacity issues due to heavy freight volume received a more detailed “Typical Day” study. Three segments of the MWRRS system were subjected to this more detailed “Typical Day” analysis based on the full build-out: Chicago to St Paul; Toledo to Cleveland; and St Louis to Kansas City. The use of the line capacity simulation models was supported by a Mitigation Framework methodology designed to ensure that the freight railroads are “held harmless” by the addition of passenger trains to their corridors, e.g. the assessment of the level of track capacity that would be required to hold freight delays constant in some future target year. The capacity assessment methodologies are described in detail in Sections 6.1 through 6.6 of the Project Notebook. The results of the Ideal Day capacity analyses are presented in Sections 6.7 through 6.23. The results of the three Typical Day analyses are found in Sections 6.24 through 6.26 of the Project Notebook. These results of these detailed simulation studies for each corridor, are also included in the individual corridor-level SDP’s that form a part of this document. Prioritized Capital Plan The MWRRS developed a prioritized capital plan in Chapter 8 that addressed corridor and segment implementation phasing. Based on the assumed build-out plan for the MWRRS year-by-year cash flows could be projected, along with their associated funding requirements. This allowed the development of related financing plans, including a statement on Sources and Uses of Funds, with clear definitions of State financial accountabilities for the completion of each segment. This will be addressed in more detail under Topic #3: Implementation Plan. 3 However, the connectivity provided by the Cleveland Hub System rectifies forecast light ridership on the east end of the Cleveland line. Three additional destinations served by Cleveland Hub – Detroit, Columbus and Pittsburgh – would add significantly to the ridership on the MWRRS Cleveland line. Additional ridership that would result from Cleveland Hub connectivity is not included in the current MWRRS financial forecasts. Midwest Regional Rail Initiative Page 21
Midwest Regional Rail System
Service Development Plan September 29, 2009
Ridership and Revenue
The market assessment undertaken in the 2004 Project Notebook represents an analysis of the full
social and business market potential for the Midwest Regional Rail System (MWRRS). The study of the
passenger rail market opportunities includes an analysis of consumer preferences, market segments,
competitive travel modes and the longer-term socioeconomic trends in income, employment and
population that affect overall travel levels and consumer choices and mode selection behavior. The
process used for conducting the MWRRS market assessment is fully described in Chapter 4 of the Project
Notebook.
Data was collected on travel behavior and socioeconomic factors to develop a detailed and
comprehensive zone system. These data were later used in the COMPASS™ demand model as the
primary source of information for demand and revenue forecasting. Base year socioeconomic data were
provided by the U.S. Census Bureau. Socioeconomic growth rates in population, employment and
income were provided by Woods & Poole Economics, Inc.
An early step in the development of the forecasting tool for modeling public responses to various levels
of service, costs and amenities was the establishment of a zone system that would give a reasonable
representation of travel between the origins and destinations in the region. The zone system used is
mostly county-based, with urban areas subdivided (Exhibits 4-18 and 4-19 of the Project Notebook). A
385-zone system was developed to represent the Midwest region using the data collected for each zone,
integrating the information from the following sources:
U.S. Census Bureau and Woods & Poole socioeconomic data on population, employment and
income
Network data on all existing travel modes (auto, air, rail, bus)
Traveler origin and destination data by mode and trip purpose
Attitudinal data on the preferences and priorities of travelers
Individual state zone maps may be found in Appendix A3 of the Project Notebook. County-based zones
provide compatibility with the socioeconomic baseline and forecast data (discussed below) that are
derived from the U.S. Census Bureau and Woods & Poole data and are county-based. Zones were
defined relative to the rail network, such that small zones are defined for areas close to stations and
larger zones for areas farther away. Network links are defined from the centroid of each zone to the
nearest MWRRS station representing the cost of system access/egress. Airport-specific zones were
introduced to aid in the measurement of MWRRS use for airport access.
Midwest Regional Rail Initiative Page 22Midwest Regional Rail System
Service Development Plan September 29, 2009
Exhibit 4-18
Number of Zones by State
Number of Zones
States Statewide Airport
Total
Zones Zones
Illinois 57 5 62
Indiana 43 2 45
Iowa 42 2 44
Michigan 48 1 49
Minnesota 23 1 24
Missouri 45 2 47
Nebraska 21 1 22
Ohio 36 3 39
Wisconsin 47 2 49
Other 4 - 4
Total 366 19 385
The variables modeled for the MWRRS are shown in Exhibit 4-21 from the Project Notebook. For all four
modes of intercity travel (air, auto, bus, and rail), the data for the base year have been assembled into
COMPASS™ databases. The assumptions on the changes in the modes from the base year conditions
determine the modal shifts in travel patterns.
Exhibit 4-21
Modal Attributes Used in the COMPASS™ Demand Model
Public Modes Auto
In-vehicle time
Access/egress times Travel time
Time
Number of interchanges
Connection wait times
Operating cost
Fare
Tolls
Cost Access/egress costs
Parking
(all divided by occupancy)
Reliability On-time performance
Frequency of service
Schedule
Convenience of times
The ridership results by corridor are provided in Exhibit 4-35 from the Project Notebook.
Midwest Regional Rail Initiative Page 23Midwest Regional Rail System
Service Development Plan September 29, 2009
Exhibit 4-35
Base System Passenger Trips and
Passenger Miles for Full MWRRS Operation in 2025
Average Trip
Passenger Miles
Corridor Passenger Trips Length
(Millions)
(Miles)
Michigan 164.1
3,674,940 603.14
Cleveland 225.1
1,120,108 252.14
Cincinnati 239.0
894,669 213.79
Carbondale 113.1
769,911 87.08
St. Louis 191.7
1,757,123 336.91
Kansas City 144.5
804,498 116.28
Quincy – Omaha 165.3
1,440,132 238.04
123.8
Green Bay – St. Paul 4,362,404 540.23
Cross Chicago --
(2,187,778) --
Total 161.1
14,823,786 2387.62
The ridership and revenue forecasts for the eight principal corridors used in the financial analysis of the
MWRRS are given in Exhibit 4-36 from the Project Notebook. It is estimated that, by 2025, the MWRRS
will attract an annual ridership of 14.8 million. (Eliminating double-counting of riders who transfer in
Chicago, ridership would be 12.6 million.) There are significant differences between the corridors. Not
surprisingly, the forecasts show that Chicago-Michigan, Chicago-St. Louis, Chicago-Cincinnati and
Chicago-Twin Cities are the corridors with the largest ridership and market shares in rail. Although the
corridors with the lowest market shares are Chicago-Cleveland, Chicago-Carbondale and Chicago-
Quincy-Omaha, the analysis shows they are still significant components of the MWRRS network.
Midwest Regional Rail Initiative Page 24Midwest Regional Rail System
Service Development Plan September 29, 2009
Exhibit 4-36
2025 Passenger Rail Forecasts and
Corridor Market Shares for the Intercity Modes
Corridor Market Share (%)
Rail
Corridor Air Bus Auto Rail
Demand
Michigan 3,674,940 0.94% 0.34% 97.29% 1.43%
Cleveland 1,120,108 1.15% 0.51% 97.31% 1.03%
Cincinnati 894,669 3.48% 0.45% 93.74% 2.33%
Carbondale 769,911 0.48% 0.42% 98.10% 1.00%
St. Louis 1,757,123 2.77% 0.43% 94.61% 2.19%
Kansas City 804,498 2.95% 0.22% 95.35% 1.48%
Quincy – Omaha 1,440,132 1.25% 0.17% 97.45% 1.13%
Green Bay – St. Paul 4,362,404 1.07% 0.29% 96.97% 1.67%
2.75% 0.58% 94.36% 2.31%
Cross Chicago (2,187,778)
1.15% 0.29% 96.41% 2.15%
Total 14,823,786
By 2025, rail’s market share will increase to 47 percent of the intercity public modes, making rail travel
as popular as air travel (Exhibit 4-37).
Operating Costs
Development of a detailed operating cost model is detailed in Section 7.12 of the MWRRS Project
Notebook. This cost model includes all the detail breakdowns that are needed for an SDP. Exhibit 7-44
from the Project Notebook shows the unit costs applied (in $2002) and the assumed methodological
basis for assigning each cost.
It should be noted that MWRRS costs were developed in conjunction with Amtrak, thus reflect a cost
basis that has been accepted as reasonable and achievable in the U.S. Along with anticipated economies
of scale, modern technology reduces operating costs when compared to existing Amtrak practice. In
development of the earlier 2000 Plan, European costs were measured at 40 percent of Amtrak’s costs.
However, in the current 2004 study, train operating costs have been significantly increased to a level
that is approximately 80 percent of Amtrak’s costs today. This is regarded as a conservative assumption
for a modern, 63-train system. Costs assumed in the MWRRS Project Notebook are specific to a large
operation with economies of scale, and so may not apply to a smaller system. (See Section 3.1.1 of the
Project Notebook.)
Midwest Regional Rail Initiative Page 25MWRRS and Corridor Program
Service Development Plans September 29, 2009
Exhibit 7-44
Unit Operating Costs Summary (2002 $)
Category Source Allocation Basis Type Unit / Lump Sum Cost
Train Crew TEMS/Amtrak Train Miles Variable $3.95
OBS Amtrak/Gate Train Miles plus OBS Rev Variable $1.53 (crew and supervision) plus 50% of
Gourmet OBS Revenue
Equipment Equipment Train Miles Variable $9.87
Maintenance Manufacturers
Energy/Fuel Equipment Train Miles Variable $2.32
ExpensesManufacturers
associated with cost sharing arrangements with infrastructure owners and rail operators
Track/ROW Zeta-Tech/HNTB Train Miles Both Fixed Lump Sum (corridor wise - year wise) plus
Economic Results and Public Benefits and Variable 39.5¢ /TM for Out-of-Pocket Expense such
Components as Dispatching.
Station Illustrative
costs TopicsTEMS/Amtrak
dealing with PublicPassengers
Benefits Fixed $26,093,119 per year (full operation years)
The SDP shall include:
Insurance A description
TEMS/Amtrak
of user benefitsPassenger Miles Variable $0.011
A description
Sales/Marketing of non-user benefits
TEMS/Amtrak Passengers plus Ticket Revenue Both Fixed $0.65 (phone support variable), 1.6% (credit
The estimated value of user and non-user benefits and Variable card fees), 1% (travel agent fees),
Estimate of Jobs created and retained Components $7,339,450 fixed (market media and phone
support)
Estimate of potential energy savings
Admin TEMS/Amtrak Train Miles Fixed $28,993,655
Bus Feeder Greyhound Bus Miles Fixed Lump sum (corridor wise - year wise)
Operator’s Profit TEMS/MWRRI Percentage of Energy-Fuel, Train Crew, Variable 10%
Service Admin, Sales-Marketing, Station
Cost, Insurance Liability
Midwest Regional Rail Initiative Page 26You can also read