Setanta EAFE Equity Fund (CAD) - Q2 2021
←
→
Page content transcription
If your browser does not render page correctly, please read the page content below

Setanta EAFE Equity Fund (CAD)
Q2 2021

Fund Description                                                              Our Investment
The EAFE Equity Fund (‘the Fund’) is managed by Setanta Asset                    Principles
Management Limited (“Setanta”) and is a representative account of
the EAFE Equity strategy.                                                   We do not believe markets are
                                                                                      efficient
The Fund is an actively managed equity portfolio which holds c.30-50
stocks in the European, Australasian and Far East regions. The
portfolio is managed in accordance with the Setanta investment              We invest below our estimate
philosophy. The Fund is managed by three portfolio managers, who                 of intrinsic value
also look to leverage off the experience and knowledge of their
colleagues. The aim is to achieve a sensible level of diversification on    We invest in businesses rather
a sector and geographic basis. The Fund can hold up to 10% cash                  than buying stocks
where investments of sufficient quality cannot be found.
                                                                             Preservation of our clients’
The investment objective of the Fund is to outperform the MSCI EAFE
                                                                                   capital is key
benchmark over the long term.

                                                                            Investing is a marathon, not a
Fund Commentary                                                                         sprint
Equity markets continued their advance in the second quarter of 2021.
While Q1 saw a trend towards “value” outperforming “growth” and               We are not afraid to swim
cyclicals outperforming defensives, we witnessed something of a                   against the tide
reversal in favour of growth names later in Q2. The market remained
quite firmly in “risk-on” mode. A clear illustration of this is junk bond   We consider scenarios rather
yields, which have been falling to record lows.                               than making forecasts

 (Fund Commentary continued on Page 3)                                      Businesses we own must have
                                                                                strong balance sheets

                                                                            We make mistakes and always
                                                                            endeavour to learn from them

Portfolio Managers                                                           We will act with integrity in
Rowan Smith; Fergal Sarsfield, CFA & Conor Walshe
                                                                                 everything we do
Fund Performance – 30.06.2021 (CAD)                                                      Fund Statistics
                                                                                            PRICE/BOOK                              1.8
25%                                                                                         PRICE/EARNINGS RATIO (FY 1)             15.1
                                     20.3%
20%                              17.7%                                                      DIVIDEND YIELD %                        2.2
                                                                                            AVERAGE MARKET CAP C$BN                 78.5
15%
                                                                           10.4%
                                                                                            NO. OF HOLDINGS                          36
10%                                                          7.9%
                                                                    9.2%           8.6%     DEBT/EQUITY %                           50.7
                     5.4% 5.8%                       6.1%
5%            3.6%
                                             2.8%
                                                                                            ACTIVE SHARE %                          92.0
       2.1%
0%

       Q2 2021         YTD          1 Yr     3 Yrs p.a. 5 Yrs p.a.           10 Yrs
                                                                                           Sector Distribution
                                                                                                                    Consumer
                                                                              p.a.
                                  EAFE Equity Fund                                                                    Disc
                                                                                                Infrastructure         6%      Consumer
                                                                                                     10%                        Staples
                                                                                                                                 12%
      Yearly Performance
                                                                                                                                     Energy &
                                                                                          Information                                Materials
        Year %           2016       2017     2018           2019     2020
                                                                                          Technology                                    2%
      Fund                7.0       16.7      -2.7          13.1      -1.9                    13%

      Benchmark          -2.5       16.8      -6.0          15.8      5.9                                                            Financials
                                                                                                                                        18%
  Performance Source: Setanta Asset Management Limited. The Fund
  returns stated are based on the movements in the unit prices of the                      Industrials
  CLA CA Managed EAFE Portfolio SF035 [IEC11007] and are gross of                             20%
  management fees. The performance will be reduced by the impact of                                                              Healthcare
  management fees paid, the amount of which varies. Benchmark:                                                                     19%
  MSCI EAFE (CAD) Holdings Source: Setanta. Sector allocations based
  on invested portfolio only (excludes cash). Fund Statistics Source:
  Bloomberg.                                                                               Geographic Distribution
  Top 10 Holdings
                                                                                             Asia (ex Japan)     Cash
                                                                                % OF               2%             5%              Europe ex UK
 COMPANY                            SECTOR
                                                                                FUND         Emerging                                 44%
 GPE BRUXELLES LAMBERT              FINANCIALS                                     6.9%       Markets
                                                                                                11%
 DCC                                INDUSTRIALS                                    5.3%

 SAMSUNG ELECTRONIC                 INFORMATION TECHNOLOGY                         5.0%
                                                                                              Japan
 LSL PROPERTY SERVICES              INFRASTRUCTURE                                 4.5%         7%

 ALCON AG                           HEALTHCARE                                     4.1%

 DIAGEO                             CONSUMER STAPLES                               4.0%

 UNILEVER PLC                       CONSUMER STAPLES                               3.9%

 GLAXOSMITHKLINE                    HEALTHCARE                                     3.5%                   UK
 RYANAIR                            INDUSTRIALS                                    3.5%                  31%

 ERICSSON                           INFORMATION TECHNOLOGY                         3.4%
Commentary

                    Barclays US Corporate High Yield Bond Index Yield to Worst, 2000-2021

Source: Bloomberg

What makes these levels even more striking is the concurrent degradation in credit standards. As Grant’s
Daily notes; “so-called covenant-lite structures featured in 85.2% of total loans outstanding in May, per S&P’s
LCD unit, up from about 66% five years ago and just 17% in 2007”. Credit valuations at record highs in spite
of record low credit protection. We think this backdrop is instructive about the pricing of risk more
generally in financial markets.

Against this backdrop, the Setanta EAFE Equity Fund lagged the MSCI EAFE Index in the first six months of
the year. It has been frustrating that our fund has been firmly out of favour during the past eighteen
months in particular. It doesn’t seem to us to be justified by fundamentals. The highly unusual nature of
the pandemic induced recession in 2020 adversely impacted many holdings that had historically proven to
be reasonably shock resistant. Now that these businesses are recovering, other more cyclical companies
have been surmised to be greater beneficiaries of 2021’s huge rebound in demand and bottleneck induced
industrial price inflation. The coincident backdrop of valuation multiple inflation is also proving to be
something of a headwind for our style. With a concentrated portfolio and active share in excess of 90%, a
portfolio such as ours can easily lose a lot of ground against a benchmark quite quickly when some of its
positions are out of favour. The converse is also true: the portfolio can gain a lot of ground quickly. We
don’t feel the need to change our approach and we hope that our patience, and yours, will be rewarded.

In the following paragraphs, we look at the some of the main stock drivers of the fund’s performance in the
first half of 2021.

Shares in Alfresa, the Japanese drug distributor, suffered significant selling pressure following its deletion
from the MSCI World Index in May 2021. As Japan’s index weighting has fallen the circa thirty smallest
holdings, including Alfresa, were deleted by MSCI. The company suffered a sharp fall in profits in the year
to March 2021. The Covid-19 pandemic has led to fewer visits to hospitals and GPs leading to fewer
prescriptions. Pharmacies and hospitals have demanded greater price discounts to share the pain.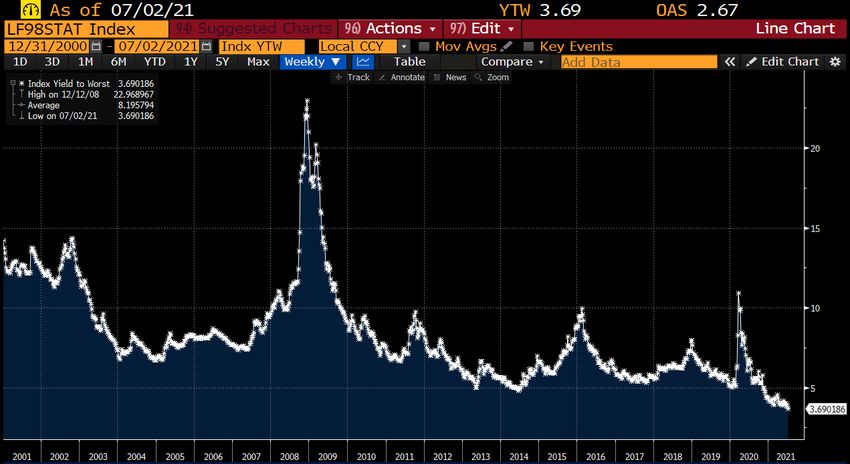
Commentary

Marketing allowance income was also negatively impacted as Alfresa’s sales reps were restricted in visiting
customers. Meanwhile, the investigation into collusion by the main wholesalers has rumbled on providing
an ESG overhang. While it will take time, we believe profits have significant recovery potential. There is
huge potential value to be unlocked from the cash and investments sitting on the company’s balance
sheet. All told, we believe the stock is cheap, very out-of-favour and offers considerable scope for things to
improve.

Shares in Thai Beverage have been weak in recent months. The company’s dominant position in the
domestic spirits industry, which has large off-premise exposure, has helped to insulate profits through the
pandemic. However, the rollout of vaccines has been slow in both Thailand and Vietnam which is
constraining its beer business in particular. Thai Beverage had been planning to spin out a stake in its beer
businesses into a separate company to be listed in Singapore. Management decided to postpone this plan
in light of the volatile market conditions; a decision which seems to have depressed sentiment towards the
shares. The stock continues to look undervalued.

In our Q1 report, we touched on the share price weakness in Lancashire, the specialist insurance
company. To recap, last summer the company raised equity capital to fund an expansion in business, on
foot of firming pricing across the industry. This backdrop remains favourable, and we think results could
be very strong for the next few years. However, Lancashire’s discipline in the face of the weak pricing
environment of previous years meant that the company made little money from 2017 – 2020 so the stock
remains a “show-me” story. We continue to see the potential for a re-rating as results begin to improve
this year.

Melrose was also a drag on performance in the six months to June. It boasts an excellent track record in
acquiring under-performing industrial / manufacturing businesses, improving them, and then selling at a
higher valuation. However, its aerospace (in particular) and automotive exposure as well as financial
leverage have weighed heavily on the share price since the pandemic’s onset. Management has done a
very good job with cost cutting and cash preservation. The H2 2020 profit performance and recent trading
update were very reassuring, and the company is on course for meaningful recovery over the coming
years. Profit margin targets for 2023 for the Automotive and Powder Metallurgy businesses have been
retained while the goal for Aerospace has only been slightly lowered. The sale of the Nortek Air
Management business for £2.6 billion has placed the balance sheet in a much stronger position and
provides further evidence of management’s ability to execute on its Buy, Sell, Improve model and deliver
significant value creation for shareholders.

LSL, the UK property services company, delivered a very impressive set of results for 2020 against a tough
backdrop. The Financial Services and Surveying businesses performed particularly strongly. The year ended
well with large estate agency transaction backlogs and activity levels year to date have been very robust.
The company is confident of delivering significant profit growth in 2021. We recently met with the new CEO,
David Stewart, and were impressed with his plans to develop the business with a greater focus on Financial
Services. There is potential for LSL to deliver strong results over the next few years.

DCC, the distributor of fuel, healthcare, and technology products, enjoyed a share price bounce in the first
half. The company delivered an excellent 7% growth in operating profit (3% organic) in the year to March
2021 despite some Covid-19 related headwinds for elements of its business. Cash conversion was very
strong and there was an upturn in Return on Capital Employed. A number of acquisitions, a source of
significant value creation in the past, were completed in the past year. Investors seem somewhat
concerned about the sustainability of the energy businesses. We think the fuel transition will take many
years to play out and believe the management team, which has proven adept at adapting to changing
circumstances, is fully capable of successfully managing the business through this period.
Commentary

Significant M&A optionality still exists given the strong balance sheet. The stock valuation remains very
attractive in our view.

Diageo’s shares benefited from a strong trading update for the year to June 2021, forecasting organic
operating growth of at least 14% year-on-year. The underlying demand tailwinds of premiumisation and
spirits taking share from beer and wine remain intact. The company has enjoyed particularly strong
performance in the North American market where consumer demand has been very resilient. Europe has
seen strong execution in the off-trade while the on-trade benefits from partial re-opening. Continued
recovery is coming through in Africa, Asia Pacific and Latin America.

Shares in Swatch and EssilorLuxottica continued to recover on expectations that business demand is in
the process of normalising.

Transactions

During the second quarter, we received cash in exchange for shares held in Coca Cola Amatil after its
takeover by Coca Cola European Partners was completed.

We added a position in Taiwan Semiconductor (TSMC) to the portfolio. TSMC is a company we have
followed for many years. The company is a semiconductor foundry; it does not design semiconductors,
rather it manufactures the chips on behalf of its vast client base. It has long been the dominant foundry,
but its position of strength has gone to another level since the semiconductor market has moved to sub 10
nanometer nodes. After a series of industry exits, there is only one viable competitor for these smaller
nodes, and it is not optimised for third party production. TSMC boasts an estimated 60%+ foundry market
share by value. There is a long growth runway ahead in our view. 5G mobile technology, internet of things,
autonomous driving, cloud computing and artificial intelligence all require increases in computation
performance in an energy efficient manner. Capital intensity represents a significant barrier to entry, but
the largest barrier is the engineering expertise required. The company is investing heavily, and we believe
it can stay ahead of the competition. The P/E multiple we are paying of over 25x can be justified by the
earnings growth outlook.

We also initiated a position in a Japanese healthcare company but have not completed our purchase at this
juncture. We look forward to speaking about this investment in due course.

Concluding Remarks

On this side of the Atlantic, we are currently enjoying the European soccer championships. It is now 45
years since one of the most famous moments in the tournament’s history. The 1976 final between West
Germany and Czechoslovakia (the former now part of a unified Germany, the latter subsequently split into
two countries) went to a penalty shoot-out to decide the winner. The chance fell to Antonin Panenka to seal
the victory for Czechoslovakia. Conventional wisdom was that penalties should be struck to the corner of
the net to evade the goalkeeper’s reach. Panenka had other ideas and had been practising a new technique
in training for some time. He ran up at pace but then chipped the ball very gently towards the centre of the
goal. The German goalkeeper Sepp Maier, anticipating a shot low to his left, had already dived out of the
way and the trophy was Czechoslovakia’s. Soccer writer Ben Lyttleton commented on the subject.
“Czechoslovakia was a Communist country, so doing something so creative and spontaneous, which felt
impulsive and impudent was really counter to what the country’s ethos was about. I spoke to Panenka
about what would have happened if he’d missed that penalty. He said he spoke to some politicians
afterwards and they said he would have spent 30 years underground, working in the mines”.
Commentary

Panenka trusted in his practised technique to go against prevailing attitudes and this style of penalty kick
bears his name to this day.

At Setanta, risk aversion is one of the key pillars of our approach. Our first thought when making an
investment is what can go wrong. This feels like it runs against the prevailing speculative mood in markets
over much of the last 15 months. There is a sense that investors are being complacent and not seeking
compensation for risks that in reality are still present. We are remaining consistent in our approach and
not letting current market attitudes to risk infect our thinking. We continue to believe that above average
quality companies bought at a fair price and held for the long term can deliver excellent investment results.

Rowan Smith – Portfolio Manager
Contact Details:
                                                                                                                       Suite S8-17,
                                                                                                                        Eight Floor,
                                                                                                                 190 Simcoe Street,
                                                                                                                           Toronto,
                                                                                                                           Ontario,
                                                                                                                         M5T 2W5.

                                                                         Rocco Vessio, (T) 416-552-5061 , (M) 647-823-4813
                                                                                 E-mail: rocco.vessio@setanta-asset.com
                                                                                                   www.setanta-asset.com
IMPORTANT INFORMATION
The EAFE Equity Fund is managed by Setanta Asset Management Limited and is a representative account of the EAFE Equity
strategy. The performance shown is the performance of a representative account (CLA CA Managed EAFE Portfolio SF035
[IEC11007]). The strategy is available on a separate account basis to institutional investors however current and prospective clients
should not assume identical performance results to those shown would have been achieved for their account if it was invested in
the strategy during the period. Clients of the firm may receive different performance than the representative account. Client
performance may differ due to factors such as timing of investment(s), timing of withdrawal(s), client-mandated investment
restrictions and the portfolio not being fully replicated for new accounts or new flows. Investors should consider the investment
objectives, risks, charges and expenses carefully before investing. See ‘WARNING’ and IMPORTANT INFORMATION’ sections below.

Setanta Asset Management Limited is regulated by the Central Bank of Ireland, New Wapping Street, North Wall Quay, Dublin 1,
Ireland and has been granted the International Adviser exemption from registration in Manitoba, Ontario, Quebec, British
Columbia and Alberta. This exemption enables it to provide advisory services to clients in these provinces in accordance with the
applicable securities legislation of Manitoba, Ontario, Quebec, British Columbia and Alberta. Setanta, who is an investment sub-
advisor to a number of Great–West Life Group companies, does not trade on its own account. Units in the Canadian segregated
and mutual funds are not offered for sale by Setanta but may be acquired by prospective investors via the relevant Great–West Life
Group company. This factsheet, which is for information purposes only, does not form part of any contract. This is a marketing
communication that (a) has not been prepared in accordance with legal requirements designed to promote the independence of
investment research, and (b) is not subject to any prohibition on dealing ahead of the dissemination investment research. The
information contained in this document is based on current legislation and is, therefore subject to change. The contents are
intended as a guideline only and should not be construed as an interpretation of the law. You should always seek the advice of an
appropriately qualified professional. Performance disclosures are stated above. Setanta Asset Management Limited is registered
as an Investment Adviser with the Securities and Exchange Commission (the “SEC”) - CRD# 281781 / SEC# 801–107083.

The MSCI information may only be used for your internal use, may not be reproduced or re-disseminated in any form and may not
be used as a basis for or a component of any financial instruments or products or indices. None of the MSCI information is
intended to constitute investment advice or a recommendation to make (or refrain from making) any kind of investment decision
and may not be relied on as such. Historical data and analysis should not be taken as an indication or guarantee of any future
performance analysis, forecast or prediction. The MSCI information is provided on an “as is” basis and the user of this information
assumes the entire risk of any use made of this information. MSCI, each of its affiliates and each other person involved in or related
to compiling, computing or creating any MSCI information (collectively, the “MSCI Parties”) expressly disclaims all warranties
(including, without limitation, any warranties of originality, accuracy, completeness, timeliness, non-infringement, merchantability
and fitness for a particular purpose) with respect to this information. Without limiting any of the foregoing, in no event shall any
MSCI Party have any liability for any direct, indirect, special, incidental, punitive, consequential (including, without limitation, lost
profits) or any other damages.

WARNING: Past performance is not a reliable indicator of future results. The price of units and the income from them may go
down as well as up and investors may not get back the amount invested. The return may increase or decrease as a result of
currency fluctuations. Forecasts are not a reliable indicator of future performance.
You can also read