Sheltering in Place and Domestic Violence
←
→
Page content transcription
If your browser does not render page correctly, please read the page content below
Sheltering in Place and
Domestic Violence
Evidence from Calls for Service during COVID-19

PRESENTED TO THE COMMISSION BY

EMILY LESLIE
Assistant Professor of Economics, Brigham Young University

RILEY WILSON
Assistant Professor of Economics, Brigham Young University

Council on Criminal Justice
August 2020
ABOUT THE COUNCIL
The Council on Criminal Justice is a nonpartisan criminal justice think tank and national
invitational membership organization. Its mission is to advance understanding of the
criminal justice policy choices facing the nation and build consensus for solutions based on
facts, evidence and fundamental principles of justice.

The Council does not take policy positions. As part of its array of activities, the Council
conducts research and convenes independent task forces composed of Council members
who produce reports with findings and policy recommendations on matters of concern.
The findings and conclusions in this research report are those of the authors alone. They
were not subject to the approval of the Council’s Board of Directors or its Board of
Trustees.

For more information about the Council, visit counciloncj.org

ABOUT THE AUTHORS
Emily Leslie received her Ph.D. from the University of Iowa in 2017. She earned a B.A. in
Economics from Brigham Young University in 2011. Her research focuses on law and
economics and public economics, particularly the impact of public policy on low-income
and disadvantaged groups.

Riley Wilson’s research is at the intersection between public and labor economics, and
explores topics such as households' decisions to move to economic opportunity, marriage
and fertility decisions among disadvantaged households, and responses to market
interventions by the government. His work has been cited in the Washington Post, the
Freakonomics Podcast, Marginal Revolution, and The Economist. He received his Ph.D.
from the University Maryland in 2018 and earned B.A. in Economics and Russian from
Brigham Young University in 2013.

ACKNOWLEDGEMENTS
This research brief was produced with support from Arnold Ventures, the John D. and
Catherine T. MacArthur Foundation, Microsoft, the Charles and Lynn Schusterman Family
Foundation, and other contributors.

Suggested Citation
Leslie, Emily and Riley Wilson. Sheltering in Place and Domestic Violence. Washington,
D.C.: Council on Criminal Justice, August 2020.

The referenced paper was recently published by the Journal of Public Economics.

                                                                                              2
Overview
The worldwide COVID-19 pandemic has pushed people to spend more time at
home, amidst increased uncertainty and soaring unemployment rates. The best
available evidence tells us that these conditions have the potential to increase
domestic violence (Lindo et al., 2018; Card and Dahl, 2011). News outlets
around the world reported increased reports of domestic violence as the
pandemic spread globally during Spring 2020.
We use data on calls for service to the police from 14 large American cities to compare
domestic violence calls before and after the pandemic began in the United States, relative
to trends during the same period in 2019. The pandemic led to a 7.5% increase in calls for
service during March, April, and May. The biggest increase came during the first five weeks
after widespread social distancing began, when domestic violence calls were up 9.7%.
State-mandated stay-at-home orders and school closures came later, suggesting the
increase was not only a response to shelter-in-place policies. The increase came across a
broad range of demographic and socioeconomic groups, and includes households without
a recent history of domestic violence calls.
TIMING OF EFFECTS
Data from several sources establish when the pandemic began to induce people to spend
more time at home. Mobile device tracking data from SafeGraph (2020) and Unacast
(2020), as well as OpenTable restaurant seated diner data indicate that behavior began to
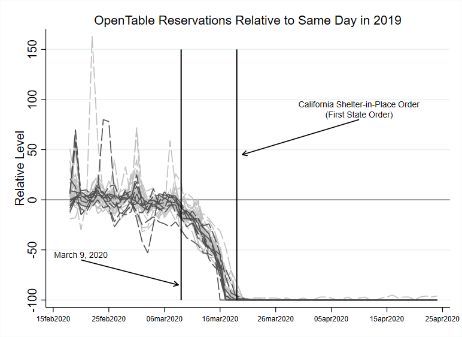
change around March 9, ten days before the first stay-at-home order went into effect (see
Figure 1). During the week of March 9, the World Health Organization declared COVID-
19 a pandemic and President Trump declared a national emergency. If we compare the
daily number of domestic violence calls in 2020 within city, we find that domestic violence
calls are nearly 15% higher after March 9. However, data from previous years also show
an uptick in calls in the spring (see Figure 2), suggesting that any estimation that overlooks
seasonal trends will overstate the impact of the pandemic. Our analysis shows that failing
to account for seasonal trends would overestimate the effects by 100%. The estimated
effect of the pandemic on domestic violence is unchanged if we add in earlier years of data
to better control for seasonal trends, or if we exclude each city one-by-one.
3FIGURE 1
Each graph uses data from a different source as a measure of social distancing intensity. There is a
line in each graph for every state in the US. States with cities in our sample are plotted in dark
gray. The first panel plots the SafeGraph percent of tracked cellphone devices that do not leave
home during the day. The second panel plots Unacast non-essential travel relative to the same day
of the week the previous year. The third panel plots the number of seated diners at OpenTable
restaurants in 2020 relative to 2019. The Unacast and OpenTable data are measured to account
for day-of-week effects; the SafeGraph data are not, leading to a more volatile series.
4FIGURE 2
The figure plots inverse hyperbolic sine of the average number of daily domestic violence service
calls across 14 cities by week of year for 2019 and 2020. The downward sloping green curve uses
OpenTable data to show the percent change in the number of seated restaurant diners in 2020
compared with 2019. The vertical red line falls on the week of March 2, 2020, one week before
social distancing measures became widespread.
EFFECTS BY DEMOGRAPHIC GROUP, DAY OF
WEEK, AND CALL HISTORY
Financial vulnerability, restructured living patterns including more time at home,
unemployment, and general stress surrounding the pandemic and uncertainty about the
future could all increase the incidence of domestic violence. The variation across cities in
the timing and intensity of outbreaks is limited and correlated with the timing of policy
interventions. Unfortunately, with the tight timing and limited number of cities, we cannot
clearly decompose how much of the increase is attributable to each channel. Effects seem
to be larger on weekdays compared with weekends, which is consistent with increased
time at home together, especially during hours when adults may be trying to work from
home and/or help children with schoolwork, playing a role.
5We do not find clear evidence of different effects by neighborhood racial composition or
socioeconomic status (see Figure 3). The estimated effect size for low-income areas is
larger, but it's well within the margin of error for the effects in high income areas (see full
paper for a more detailed exploration of heterogeneity).
FIGURE 3
The figure plots the impact of the pandemic on domestic violence calls for service during the first
five weeks of widespread social distancing. Subgroup estimates are obtained by examining
domestic violence calls from census tracts with the specified characteristic either above the
median (“High”) or below the median (“Low”). 95 percent confidence intervals are provided.
Finally, we investigate whether the increase is driven by households with a history of
domestic violence. We don’t have exact address information in our data, but we do know
what city blocks calls came from for some of the cities in our sample. We divide the city
blocks into groups based on whether they had a domestic violence call during the previous
year and compare effects in the two groups. Our estimates suggest larger effects on city
blocks without a previous domestic violence call, meaning new households contribute to
the overall increase that we observe.
6REPORTING ISSUES
Domestic violence calls are not a perfect measure of domestic violence incidents. If
victims find it more difficult to report during the pandemic because their abusers spend
more time at home, then our analysis would understate the increase in domestic violence.
On the other hand, third party reporting could increase due to more neighbors being at
home. To test for this, we compare effects in areas with lots of multi-unit housing (where
neighbors are likely to hear more through shared walls) to places with less multi-unit
housing. The results for the two subgroups are nearly identical, suggesting that our
findings are not just picking up an increase in reporting by neighbors. Reports from the
National Domestic Violence Hotline also show that the fraction of third-party hotline calls
did not change from 2019 to 2020 (National Domestic Violence Hotline, 2019, 2020). We
conclude that an increase in third-party reporting is unlikely to be driving the increase in
domestic violence calls.
Conclusion
Our estimates suggest that the pandemic has led to, on average, 3.4 more domestic
violence calls per city every day during the first five weeks after social distancing
began. If the entire U.S. experienced a similar increase, the result would be about 1,330
more domestic violence calls each day. The immediate medical and productivity costs and
the long-run negative impacts on earnings associated with such an increase could cost
society tens of millions of dollars each day (Bindler and Ketel, 2019; Aizer, 2011; Currie et
al., 2018).
Given that the increase in domestic violence calls started before stay-at-home orders
took effect, state-level social distancing policy may not be central to the results. On the
other hand, the increase in domestic violence was at least partially reversed starting in the
middle of April, coinciding with the disbursement of the majority of CARES Act stimulus
checks (Chetty et al., 2020). We cannot say conclusively whether financial relief caused
domestic violence rates to drop—our data also shows that social distancing compliance
began to wane around the same time—but our results point to the importance of future
work on this question.
7REFERENCES
Anna Aizer. Poverty, violence, and health impacts of domestic violence during pregnancy on
newborn health. Journal of Human Resources, 46(3):518–538, 2011.
Anna Bindler and Nadine Ketel. Scaring or scarring? labour market effects of crime victimisation.
Working Paper, 2019.
David Card and Gordon Dahl. Family violence and football: The effect of unexpected emotional
cues on violent behavior. Quarterly Journal of Economics, 126:1–41, 2011.
Raj Chetty, John N. Friedman, Nathaniel Hendren, Michael Stepner, and The Opportunity Insights
Team. How did covid-19 and stabilization policies affect spending and employment? a new
real-time economic tracker based on private sector data. NBER Working Paper No. 27431,
2020.
Janet Currie, Michael Mueller-Smith, and Maya Rossin-Slater. Violence while in utero: The impact
of assaults during pregnancy on birth outcomes. NBER Working Paper No. 24802, 2018.
Jason Lindo, Jessamyn Schaller, and Ben Hansen. Caution! men not at work:Gender-specific labor
market conditions and child maltreatment. Journal of Public Economics, 163:77–98, 2018.
National Domestic Violence Hotline. 2019: A year of impact. Technical report, 2019.
National Domestic Violence Hotline. Covid-19 special report. Technical report, 2020.
SafeGraph. Social distancing metrics. https://www.safegraph.com/covid-19data-consortium,
2020. Accessed: 2 July 2020.
Unacast. Unacast social distancing dataset. https://www.unacast.com/data-for-good, 2020.
Accessed: 30 April 2020
8You can also read