Shoreline Evolution: Prince William County, Virginia - Potomac River, Occoquan Bay, and Occoquan River Shorelines
←
→
Page content transcription
If your browser does not render page correctly, please read the page content below
Shoreline Evolution:
            Prince William County, Virginia
Potomac River, Occoquan Bay, and Occoquan River Shorelines

                  Virginia Institute of Marine Science
                       College of William & Mary
                       Gloucester Point, Virginia

                            January 2012
Shoreline Evolution:
                                           Prince William County, Virginia
                            Potomac River, Occoquan Bay, and Occoquan River Shorelines

                                                                               Data Summary Report

                                                                                   Donna A. Milligan
                                                                                    Christine Wilcox
                                                                                 C. Scott Hardaway, Jr.
                                                                                     Mary C. Cox

                                                                                        Shoreline Studies
                                                                               Department of Physical Sciences
                                                                              Virginia Institute of Marine Science
                                                                                   College of William & Mary
                                                                                   Gloucester Point, Virginia

    This project was funded by the Virginia Coastal Zone Management Program at the Department of Environmental Quality through Grant #NA10NOS4190205 of the U.S. Department of Commerce,
National Oceanic and Atmospheric Administration, under the Coastal Zone Management Act of 1972, as amended. The views expressed herein are those of the authors and do not necessarily reflect the
                                                            views of the U.S. Department of Commerce, NOAA, or any of its subagencies.

                                                                                        January 2012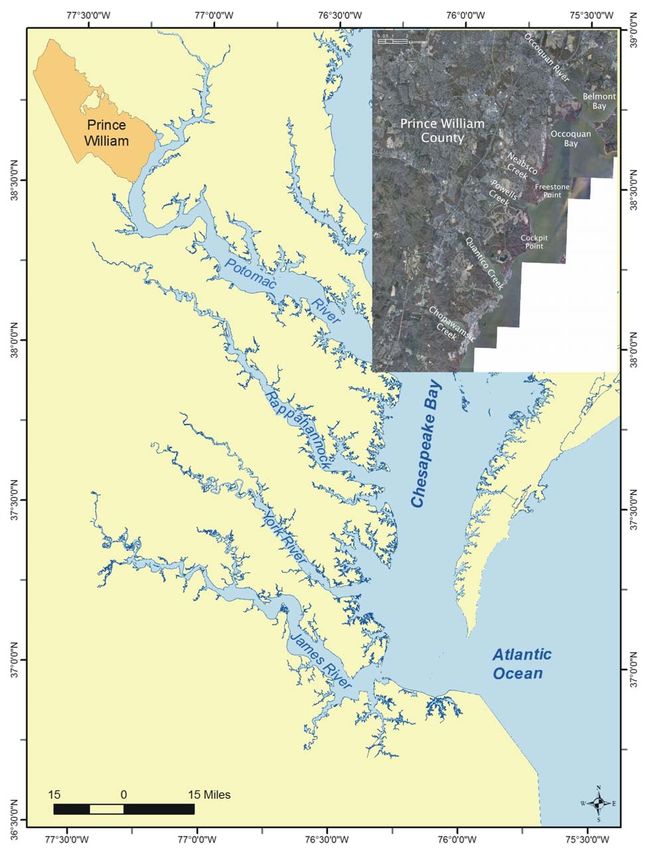
Table of Contents                                                                                                                  List of Figures
                                                                                                                                     Figure 1.   Location of Prince William County within the Chesapeake Bay estuarine
                                                                                                                                                 system . . . . . . . . . . . . . . . . . . . . . . . . . . . . . . . . . . . . . . . . . . . . . . . . . . . . 1
Table of Contents . . . . . . . . . . . . . . . . . . . . . . . . . . . . . . . . . . . . . . . . . . . . . . . . . . . . . i        Figure 2.   Index of shoreline plates. . . . . . . . . . . . . . . . . . . . . . . . . . . . . . . . . . . . . . . 3

List of Figures . . . . . . . . . . . . . . . . . . . . . . . . . . . . . . . . . . . . . . . . . . . . . . . . . . . . . . . . i

List of Tables . . . . . . . . . . . . . . . . . . . . . . . . . . . . . . . . . . . . . . . . . . . . . . . . . . . . . . . . . i                                                List of Tables
1       Introduction                 ................................................1                                               Table 1.    Average end point rate of change (ft/yr) between 1937 and 2009 for
                                                                                                                                                 segments along Prince William County’s shoreline. . . . . . . . . . . . . . . . . . . 4
2       Methods . . . . . . . . . . . . . . . . . . . . . . . . . . . . . . . . . . . . . . . . . . . . . . . . . . . . . . . 1
        2.1 Photo Rectification and Shoreline Digitizing . . . . . . . . . . . . . . . . . . . . . . . . . . 1
        2.2 Rate of Change Analysis . . . . . . . . . . . . . . . . . . . . . . . . . . . . . . . . . . . . . . . . . 2

3       Summary           ......................................................4

4       References . . . . . . . . . . . . . . . . . . . . . . . . . . . . . . . . . . . . . . . . . . . . . . . . . . . . . . 4

Appendix A. End Point Rate of Shoreline Change Maps

Appendix B. Historical Shoreline Photo Maps

                                                                                                                                                                                                                                                                i
1 Introduction
Prince William County is situated along the Potomac River (Figure 1). Through
time, the County’s shoreline has evolved, and determining the rates and patterns of
shore change provides the basis to know how a particular coast has changed through
time and how it might proceed in the future. Along Chesapeake Bay’s estuarine shores,
winds, waves, tides and currents shape and modify coastlines by eroding, transporting
and depositing sediments.
The purpose of this report is to document how the shore zone of Prince William
County has evolved since 1937. Aerial imagery was taken for most of the Bay region
beginning that year and can be used to assess the geomorphic nature of shore change.
Aerial photos show how the coast has changed, how beaches, dunes, bars, and spits
have grown or decayed, how barriers have breached, how inlets have changed course,
and how one shore type has displaced another or has not changed at all. Shore change
is a natural process but, quite often, the impacts of man, through shore hardening or
inlet stabilization, come to dominate a given shore reach. In addition to documenting
historical shorelines, the change in shore positions along the rivers and larger creeks in
Prince William County will be quantified in this report. The shorelines of very irregular
coasts, small creeks around inlets, and other complicated areas will be shown but not
quantified.
2 Methods
2.1 Photo Rectification and Shoreline Digitizing
An analysis of aerial photographs provides the historical data necessary to
understand the suite of processes that work to alter a shoreline. Images of the Prince
William County Shoreline from 1937, 1953, 1962, 1985, 1994, 2002, 2007 and 2009
were used in the analysis. The 1994, 2002, 2007 and 2009 images were available from
other sources. The 1994 imagery was orthorectified by the U.S. Geological Survey (USGS)
and the 2002, 2007 and 2009 imagery was orthorectified by the Virginia Base Mapping
Program (VBMP). The 1937, 1953, 1962, and 1985 photos were a part of the VIMS
Shoreline Studies Program archives. The historical aerial images acquired to cover the
entire shoreline were not always flown on the same day. The dates for each year are:
1937 - April 19 and May 23;
1953 - December 18, 31 and February 10;
1962 - May 25;
1985 - February 18.
We could not ascertain the exact dates the 1994 images were flown. The 2002, 2007,
and 2009 were all flown at various days in February, March, and April. Figure 1. Location of Prince William County within the Chesapeake Bay estuarine system.
1The 1937, 1953, 1962, and 1985 images were scanned as tiffs at 600 dpi and the 1:12,000 scale. The 2002, 2007, and 2009 Virginia Base Mapping Program’s
converted to ERDAS IMAGINE (.img) format. These aerial photographs were orthophotography were developed in accordance with the National Standard for Spatial
orthographically corrected to produce a seamless series of aerial mosaics following a set Data Accuracy (NSSDA). Horizontal root mean square error (RMSE) for historical mosaics
of standard operating procedures. The 1994 Digital Orthophoto Quarter Quadrangles was held to less than 20 ft.
(DOQQ) from USGS were used as the reference images. The 1994 photos are used rather
than higher quality, more recent aerials because of the difficulty in finding control points 2.2 Rate of Change Analysis
that match the earliest 1937 images.
The Digital Shoreline Analysis System (DSAS) was used to determine the rate of
ERDAS Orthobase image processing software was used to orthographically correct change for the County’s shoreline (Himmelstoss, 2009). All DSAS input data must be
the individual flight lines using a bundle block solution. Camera lens calibration data managed within a personal geodatabase, which includes all the baselines created for
were matched to the image location of fiducial points to define the interior camera Prince William County and the digitized shorelines for 1937, 1953, 1962, 1985, 1994,
model. Control points from 1994 USGS DOQQ images provide the exterior control, 2002, 2007, and 2009. Baselines were digitized about 200 feet, more or less, depending
which is enhanced by a large number of image-matching tie points produced on features and space, seaward of the 1937 shoreline and encompassed most of the
automatically by the software. The exterior and interior models were combined with a County’s main shorelines but generally did not include the smaller creeks. It also did not
digital elevation model (DEM) from the USGS National Elevation Dataset to produce an include areas that have unique shoreline morphology such as creek mouths and spits.
orthophoto for each aerial photograph. The orthophotographs were adjusted to DSAS generated transects perpendicular to the baseline about 33 ft apart, which were
approximately uniform brightness and contrast and were mosaicked together using the manually checked and cleaned up. For Prince William County, this method represented
ERDAS Imagine mosaic tool to produce a one-meter resolution mosaic .img format. To about 23 miles of shoreline along 3624 transects. The End Point Rate (EPR) is calculated
maintain an accurate match with the reference images, it is necessary to distribute the by determining the distance between the oldest and most recent shoreline in the data
control points evenly, when possible. This can be challenging in areas given the lack of and dividing it by the number of years between them. This method provides an accurate
ground features and poor photo quality on the earliest photos. Good examples of net rate of change over the long term and is relatively easy to apply to most shorelines
control points were manmade features such as road intersections and stable natural since it only requires two dates. This method does not use the intervening shorelines so
landmarks such as ponds and creeks that have not changed much over time. The base of it may not account for changes in accretion or erosion rates that may occur through
tall features such as buildings, poles, or trees can be used, but the base can be obscured time. However, Milligan et al. (2010a, 2010b, 2010c, 2010d) found that in several
by other features or shadows making these locations difficult to use accurately. Most localities within the bay, EPR is a reliable indicator of shore change even when
areas of the County were particularly difficult to rectify, either due to the lack of intermediate dates exist. Average rates were calculated along selected areas of the
development when compared to the reference images or due to no development in the shore; segments are labeled in Appendix A and shown in Table 1.
historical and the reference images.
Using methodology reported in Morton et al. (2004) and National Spatial Data
Once the aerial photos were orthorectified and mosaicked, the shorelines were Infrastructure (1998), estimates of error in orthorectification, control source, DEM and
digitized in ArcMap with the mosaics in the background. The morphologic toe of the digitizing were combined to provide an estimate of total maximum shoreline position
beach or edge of marsh was used to approximate low water. High water or the limit of error. The data sets that were orthorectified (1937, 1953, 1962, and 1985) have an
runup can be difficult to determine on the shoreline due to narrow or non-existent estimated total maximum shoreline position error of 20 ft, while the total maximum
beaches against upland banks or vegetated cover. In areas where the shoreline was not shoreline error for the four existing datasets are estimated at 18.3 ft for USGS and 10.2
clearly identifiable on the aerial photography, the location was estimated based on the ft for VBMP. The maximum annualized error for the shoreline data is +0.7 ft/yr. The
experience of the digitizer. The displayed shorelines are in shapefile format. One smaller rivers and creeks are more prone to error due to their lack of good control points
shapefile was produced for each year that was mosaicked. for photo rectification, narrower shore features, tree and ground cover and overall
smaller rates of change. These areas are digitized but due to the higher potential for
Horizontal positional accuracy is based upon orthorectification of scanned aerial error, rates of change analysis are not calculated.
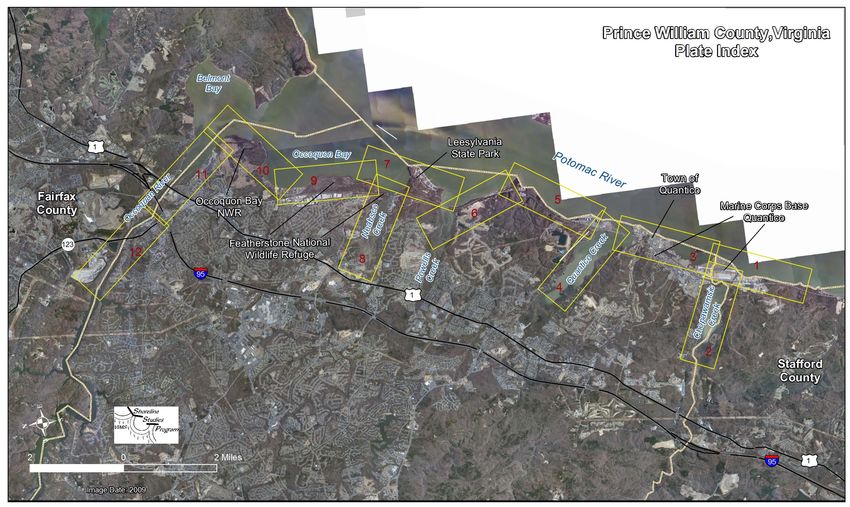
photography against the USGS digital orthophoto quadrangles. To get vertical control the
USGS 30m DEM data was used. The 1994 USGS reference images were developed in Prince William County shoreline was divided into 12 plates (Figure 2) in order to
accordance with National Map Accuracy Standards (NMAS) for Spatial Data Accuracy at display that data in Appendices A and B. In Appendix A, all of the digitized shorelines
2Figure 2. Index of shoreline plates 3
are shown, and the 2009 image is shown with only the 1937 and 2009 shorelines to           4     References
 show the long-term trends. In Appendix B, two photo dates and their associated
 shoreline are shown on each plate. These include the photos taken in 1937, 1953, 1962,     Himmelstoss, E.A., 2009. “DSAS 4.0 Installation Instructions and User Guide” in: Thieler,
 1985, 1994, 2002, 2007, and 2009.                                                              E.R., Himmelstoss, E.A., Zichichi, J.L., and Ergul, Ayhan. 2009 Digital Shoreline
                                                                                                Analysis System (DSAS) version 4.0 — An ArcGIS extension for calculating shoreline
 3       Summary                                                                                change: U.S. Geological Survey Open-File Report 2008-1278.

        The rates of change shown in Table 1 are averaged across large sections of          Milligan, D. A., K.P. O’Brien, C. Wilcox, C. S. Hardaway, JR, 2010a. Shoreline Evolution:
 shoreline and may not be indicative of rates at specific sites within the reach. In many          City of Newport News, Virginia James River and Hampton Roads Shorelines. Virginia
 areas of the County, the shoreline change rates are categorized as very low accretion.            Institute of Marine Science. College of William & Mary, Gloucester Point, VA.
 This may be the result of error within the method since most of the very low accretion            http://web.vims.edu/physical/research/shoreline/docs/dune_evolution/NewportN
 and very low erosion categories falls within our calculated error rate. Along the Marine          ews/1NewportNews_Shore_Evolve.pdf
 Corps Base, Quantico, the slight accretion may be real since much of the shoreline was
 stabilized with structures. One large section of shoreline on the Base had medium and      Milligan, D. A., K.P. O’Brien, C. Wilcox, C. S. Hardaway, JR, 2010b. Shoreline Evolution:
 high accretion rates due to placement of material along the shoreline. The Featherstone           City of Poquoson, Virginia, Poquoson River, Chesapeake Bay, and Back River
 National Wildlife Refuge, in Segment H, along Occoquan Bay has had medium to high                 Shorelines. Virginia Institute of Marine Science. College of William & Mary,
 erosion occur along its shoreline.                                                                Gloucester Point, VA.
                                                                                                   http://web.vims.edu/physical/research/shoreline/docs/dune_evolution/Poquoson/
                                                                                                   1Poquoson_Shore_Evolve.pdf

                                                                                            Milligan, D. A., K.P. O’Brien, C. Wilcox, C. S. Hardaway, JR, 2010c. Gloucester County,
Table 1. Average end point rate of change (ft/yr) between 1937 and 2009 for                        Virginia York River, Mobjack Bay, and Piankatank River Shorelines. Virginia Institute
segments along Prince William County’s shoreline. Segment locations are shown on                   of Marine Science. College of William & Mary, Gloucester Point, VA.
maps in Appendix A                                                                                 http://web.vims.edu/physical/research/shoreline/docs/dune_evolution/Gloucester
                                                                                                   /1Gloucester_Shore_Evolve.pdf
 Segment                                                           Average Rate of
                                  Location
  Name                                                              Change (ft/yr)          Milligan, D. A., K.P. O’Brien, C. Wilcox, C. S. Hardaway, JR, 2010d. Shoreline Evolution:
                                                                                                   York County, Virginia York River, Chesapeake Bay and Poquoson River Shorelines.
     A      Potomac River-County line to Shipping Point                  0.1                       Virginia Institute of Marine Science. College of William & Mary, Gloucester Point,
     B      Quantico Creek                                               -0.5                      VA.
     C      Potomac River, Possum Point to Cockpit Point                 0.1                       http://web.vims.edu/physical/research/shoreline/docs/dune_evolution/York/1Yor
     D      Potomac River, Cockpit Point to Powell's Creek               -0.5                      k_Shore_Evolve.pdf
     E      Potomac River, Mouth of Powell's Creek                       0.2
                                                                                            Morton, R.A., T.L. Miller, and L.J. Moore, 2004. National Assessment of Shoreline
     F      Potomac River, Freestone Point                               0.2
                                                                                                 Change: Part 1 Historical Shoreline Change and Associated Coastal Land Loss
     G      Occoquan Bay, Freestone Point to Neabsco Creek               -0.4
                                                                                                 along the U.S. Gulf of Mexico. U.S. Department of the Interior, U.S. Geological
     H      Neabsco Creek to Taylors Point                               -1.5                    Survey Open-File Report 2004-1043, 45 p.
     I      Belmont Bay                                                  -0.4
     J      Occoquan River                                               -0.2               National Spatial Data Infrastructure, 1998. Geospatial Positional Accuracy Standards, Part
                                                                                                  3: National Standard for Spatial Data Accuracy. Subcommittee for Base
                                                                                                  Cartographic Data. Federal Geographic Data Committee. Reston, VA.

                                                                                                                                                                                       4
You can also read