Smart School Routing Problem for the New Normality - IEOM Society ...
←
→
Page content transcription
If your browser does not render page correctly, please read the page content below
Proceedings of the 11th Annual International Conference on Industrial Engineering and Operations Management
Singapore, March 7-11, 2021

      Smart School Routing Problem for the New Normality
                              Carlos M. Leal-Garza, Carlos Gómez-Acosta
                                Industrial and Systems Engineering Program
                                           University of Monterrey
                                     San Pedro Garza Sada, N.L. México
                             carlos.lealg@udem.edu, carlos.gomeza@udem.edu

                                             Jenny Díaz-Ramírez
                                            Engineering Department
                                            University of Monterrey
                                       San Pedro Garza Sada, N.L. México
                                             jenny.diaz@udem.edu

                                                        Abstract
The Smart Mobility Plan in Monterrey’s metropolitan area seeks to generate mobility strategies for the city that are
sustainable and make dynamic use of data (with the support of ICTs). This initiative aims to improve the mobility in
the region's universities and their surrounding zones as pilot tests and then scale them to larger city districts or to other
schools around the world. As part of the university mobility plans, universities such as Universidad de Monterrey
(UDEM), offers dedicated transportation services to its community (i.e. students and employees). However, recent
studies show a low utilization of this service. This problem gets worse by the drastic social behavior changes caused
by the COVID19 pandemic and the decreased service capacity in response to the healthy distance constraints, on the
eve of back to school under the new normality. The methodology followed in this work is Intervention Scientific
Research, according to its Classic classification, implementing the Hypothetic-Deductive Method. This project uses
UDEM university as a case study to develop a comprehensive mobility proposal for school routes within the new
normality’s operational conditions, such as potential demand increase, capacity decrease, demand patterns change,
and real-time demand information.

Keywords
School bus routing problem, covid19 new normality, smart mobility, university routing, real-time demand.

1    Introduction
In the first months of 2020, the Covid-19 pandemic began to spread throughout the world. This event had a strong
impact on everyone, regardless of their profession or nationality. Over time, most governments were forced to
implement strict measures to prevent the pandemic from spiraling out of control, including full, albeit temporary,
closures. At the time of writing this report, measures to control the spread of the virus have been strengthened or
relaxed in a reactive way to the behavior of the outbreak. However, since the virus is highly contagious, social
distancing measures have been permanently active based on WHO recommendations (WHO, 2020a), even when using
any public or private transport service, including of course, school transport. This has led to a decrease in the "safe"
capacity of vehicles, among other operational consequences. As schools and the productive sector open, people will
have to use transport services in the operating conditions of the new normal. The pandemic has rapidly changed the
mobility of people, the demand for transport services will fluctuate, threatening their profitability, so immediate and
adaptive solutions are required. Being education one of the sectors that should be involved in COVID-19 preparedness
in urban settings (WHO, 2020b), this study seeks to explore available methods that can facilitate transportation of
students back to school, increase bus utilization, and tailor service to the New Normal conditions based on a Smart
Mobility framework.

The UDEM mobility plan has the objective of contributing to the improvement of air quality in the Monterrey
metropolitan area, offering sustainable mobility alternatives for the UDEM community. To date, there are several

                                            © IEOM Society International                                               1310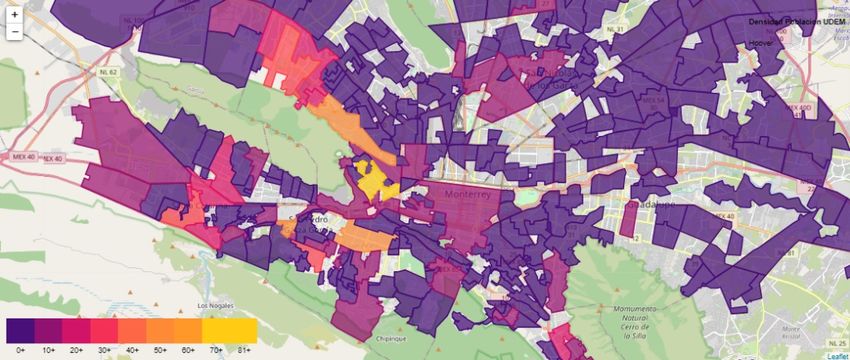
Proceedings of the 11th Annual International Conference on Industrial Engineering and Operations Management
Singapore, March 7-11, 2021

programs, such as the “UDEM Direct” offered with a fleet of buses, the “UDEM Circuit” with a fleet of vans, and
parking spaces designated only for carpooling, among others. To address the new normal situation, it has been
established that there will be a mandatory capacity reduction in all vehicles (IMSS, 2020), in order to comply with
state hygiene policies. A 42% reduction shall be applied, allowing only 11 passengers aboard the van. Carpooling
spaces will also be closed, which will cause an expected increase of 7.4% in the demand for the UDEM Circuit Service.
Lastly, once the government authorizes the return to class, most of the courses will be taught online. The UDEM states
that only 24% of the courses will be offer in a hybrid format.

Based on this situation, it is proposed to generate school routes that adapt to the new normal conditions that the UDEM
faces. This objective involves an analysis of demand and capacity under the new normal conditions, the formulation
of a school routing model (SBRP) and simulation exercises under different new normal scenarios, in order to propose
a feasible and sustainable solution for the Spring semester 2021.

The objective is to find the route (s) with the most potential demand and benefits for students, in the long term, so that
they can be used daily in the mobile application for reservations, under current capacities.

2     Integral Mobility Framework
This project is inspired by modern day interest in the developing concepts of Smart City(SC), Smart Mobility(SM),
and Integral Mobility(IM). According to these concepts, there is a need to generate a routing proposal based on the
pillars of sustainability that are included in the concept of IM (Doménech, 2007):
     ● Social: Improve user indicators, such as wait time, travel time, commodity, availability etc.
     ● Economic: Use in an efficient way the resources of the transport system (fuel, employees, buses, etc.)
     ● Environmental: Plan the routing exercise around high capacity vehicles, to reduce traffic and consequential
          carbon emissions.

This work is developed from an IM initiative that is under development by various universities in the Monterrey
metropolitan area, in México. The IM initiative has the objective of utilizing the universities of the region and their
corresponding student districts as a pilot test, so it can then be scaled into bigger city districts or other schools in the
world. With this said, the project presented in this work will use UDEM as a case study for the experimentation of the
developed model, that can then be applied to other universities or schools.

2.1    Literature Review
A literature review process on the School Bus Routing Problem (SBRP) was realized in conjunction with a team of
students from Universidad Autónoma de Bucaramanga (UNAB). After a filtering starting with a total of 267 articles
from IEEE, Scopus, and ProQuest databases, 45 papers were studied. The details of this review are out of the scope
of this work. However, the main learnings of this study are summarized as follows:

The School Routing Problem (SBRP) is about getting students to and from different school bus stops. This problem
is a variation of the classic travel agent problem and can be used to address objectives such as minimizing costs and
total transport time. The main factors to consider in solutions are efficiency and effectiveness. In the literature, the
school routing problem (SBRP) has been classified into foursso-called "sub-problems" that can be addressed
independently, sequentially or simultaneously: bus stop selection (BSS), bus route generation (BRG ), bus route
scheduling (BRS), and school bell time setting (SBA) (Ellegood et al, 2020). Table 1 summarizes the main
characteristics of each sub-problem.

The performance indicators of the most common SBRP problems in the literature are: Distance, Student travel time,
number of buses, Cost of operation, and Coverage (Leal et al, 2020). While the variables most frequently considered
are: Stops, Students (users), Vehicles, Assigned students, Routes, Arrival and departure times (Leal et al, 2020). For
the present application, additional variables such as energy consumption and the emission of atmospheric pollutants
must be considered.

The most frequently used solution algorithms are: Mixed Integer Programming, Genetic Algorithms, Ant Colony
Optimization, Local Search, Simulated Tour, Tabu Search, and Greedy Algorithms (Leal et al, 2020). The most
appropriate algorithm for the present application is unknown.

                                            © IEOM Society International                                              1311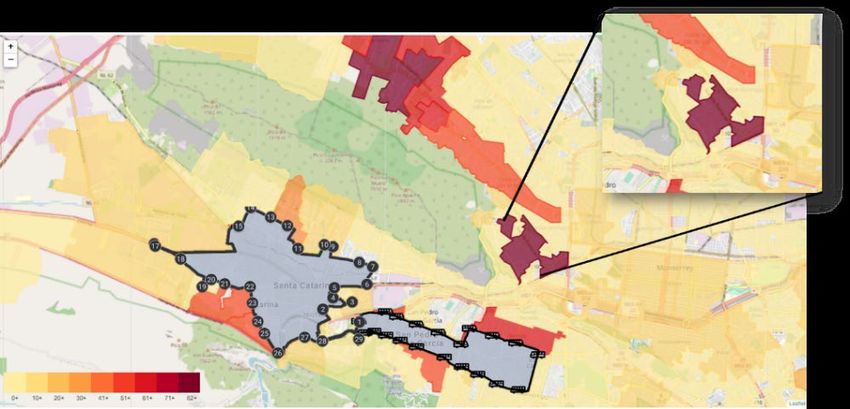
Proceedings of the 11th Annual International Conference on Industrial Engineering and Operations Management
Singapore, March 7-11, 2021

                                       Table 1. School bus routing sub-problems

      Sub-problem                 Objective                                   Comments

      BSS    Bus          stop    Identifies the location of a bus stop for   Student demand information and
             selection            each student. (Park & Kim, 2010)            potential stops are usually known in
                                                                              advance.
      BRG    Bus        route     Build the school bus routes.                It includes generating a single trip,
             generation                                                       multiple trips for a single school, a
                                                                              series of trips (routes) for a single
                                                                              school, or routes for multiple schools.
      BRS    Bus        route     Identifies the bus schedule                 Fleet data, drivers operative conditions,
             scheduling                                                       and time windows are input data.
      SBA    School bell time     Match school times (start / end) with       It could be one or several schools.
             adjustment           the bus schedule.

In addition, there is a very important variable to consider, responsible for drastic changes in the lifestyle of the global
population: the new virus SARS-CoV-2, also known as COVID-19. The most notable effect of the pandemic caused
by this virus is the drastic reduction in capacity of all transport vehicles that will be implemented in order to ensure
that people maintain a safe distance from each other, something that will be done not only in the case study. but at the
international level. Those that are underlined are the algorithms or variables used in articles that turn out to have
similar objectives to this work, such as travel time or coverage. This serves as the basis for the analysis and solution
strategy of this study.

2.2     Problem Description
The problem consists of facing the uncertainty relating the demand and capacity and how it can be tackled in different
scenarios of confinement caused by the pandemic. It also looks into how resources can be distributed to achieve
efficiency, if the demand exceeds the capacity at a given point. Additionally, it seeks to understand the way the modern
transportation systems work so that they smoothly combine with operations research and concepts of SM at a strategic
and operational level.

According to a study made by the mobility department in UDEM, which is the case study, only 9% of its bachelor
students use the available school transport system as of 2019 (UDEM, 2020). However, this is enough to cause some
saturated hours. The transportation system has some variations in its use, but there is more variation and much less
demand expected for the COVID19 scenario. The challenge is to evaluate and improve the current distribution of
routes and current methods in order to increase utilization.

2.3     Methodology
To solve the problem stated in this work, the process of scientific intervention research is followed as a base,
according to its Classic classification. The investigation method followed was the hypothetic-deductive method
(Cazau, 2006). With this said, the next step was to establish the research question, study variables, and the problem
indicators (after conceptualization).

The steps to follow are based on a combination of both the Ackoff and Pozas schemes (Cazau, 2006, Mitroff et al,
1974). The resulting seven steps are presented below: (1) Problem and objectives statement (Ackoff); (2) Theoretical
framework (Ackoff); (3) Formulation of research questions (Pozas); (4) Data collection and analysis (Pozas); (5)
Development of the model, following the Mitroff Phases for Operations Research; (6) Case study experimentation;
and (7) Conclusions and extensions (4.0 Implementation) (Ackoff).

For the development of a model, the Mitroff Phases are followed (Mitroff et al, 1974). The phases form part of the
base scheme for developing models in the field of Operations Research and are the following (Bertrand & Fransoo,
2002): (a) Conceptualization, (b) Modeling, (c) Solving the model, and (d) Implementation, as shown in Figure 1.
These four phases are divided between the conceptual model, reality or the real-life problem, the solution, and finally
the mathematical model:

                                            © IEOM Society International                                             1312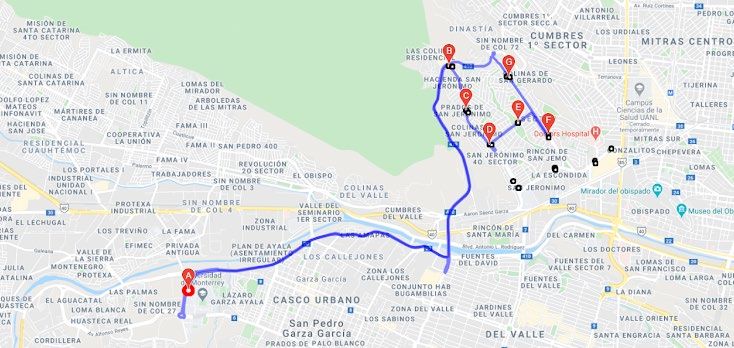
Proceedings of the 11th Annual International Conference on Industrial Engineering and Operations Management
Singapore, March 7-11, 2021
Figure 1. Mitroff Model for the development of models in the field of Operations Research.
3 Case study: UDEM
As of December 2020, the UDEM mobility department manages two routes: “San Pedro” (SP) and “Santa Catarina”
(SC), which are divided into two route names (“A” and “B”), due to the two orientations that can occur in travel.
Therefore, there are four routes to consider: "SP-A", "SP-B", "SC-A", "SC-B". The routes are plotted on the map in
Figure 2.
Figure 2. UDEM Circuit Routes to 2020.
3.1 Diagnosis of the Fall-19 and Fall-20 mobility
In order to understand the distribution of demand and student preferences, the mobility department conducted two
surveys at the beginning of each year. With sample sizes of 1751 and 2359, respectively, the participation of both
students and UDEM employees was obtained, from which information was obtained on postal codes, arrival and
departure times, preferred means of transport and reasons for use.
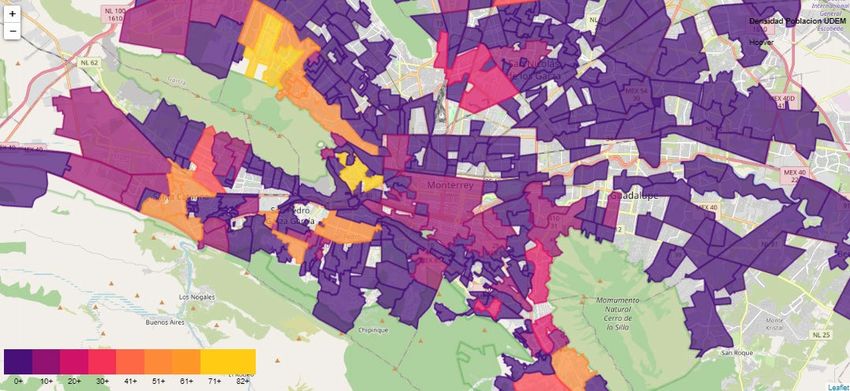
Choropletic maps were prepared for each of the surveys, (Figures 3 and 4) in order to observe if there was any
significant change in the postal codes from 2019 to 2020. This was done because the travel record in the base of
URBVAN data was carried out only in 2019, since this year the service was suspended due to the pandemic. As it can
be noticed, both maps look relatively similar. After performing a two-proportion difference z-test, there was no
evidence to state that there is a significant difference between the community distribution in zip codes between 2019
and 2020. Consequently, it is assumed that, in 2020, the distribution of the demand in each of the postal codes will be
very similar to that of 2019. However, it is important to also consider the current preferences of the users, as well as
the proportion of blended classes in order to know the new demand for 2020, which will also it is very likely that it
will be very similar to the demand for the first semester of 2021.
© IEOM Society International 1313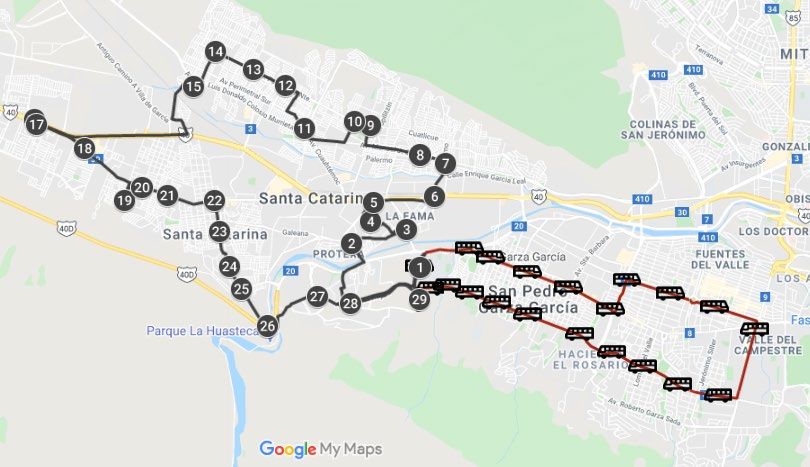
Proceedings of the 11th Annual International Conference on Industrial Engineering and Operations Management
Singapore, March 7-11, 2021

                                 Figure 3. Choropleth map based on the 2019 survey

                                 Figure 4. Choropleth map based on the 2020 survey

3.2    Capacity and demand analysis for the COVID context
In Figure 5 the frequency of occupancy each trip is recorded. In it, it can be observed that the most frequent occupancy
was 19 passengers, which corresponds to the total capacity of the vans. This shows that each trip tends to be complete
under regular conditions, and there are probably even many more users willing to use it.

To evaluate capacity in relation to expected demand, it is important to understand that demand is going to decrease,
mainly due to two specific factors (which are consequences of COVID): percentage of blended classes imposed by
UDEM and the reduction of user preference for Circuit UDEM. Both aspects are taught by the Department of Mobility.
According to the aforementioned surveys (2019 and 2020), which also asked for preferences, the percentage of
preference will decrease by 22% for the “Santa Catarina” routes and by 45% for the “San Pedro” routes. At the same
time, UDEM decided that around 24% of its classes will be blended. If these two reductions are applied respectively
to the routes, an approximate expected occupancy is seen in Figure 6. This opens the possibility of a change to improve
the expected occupancy and general use of the service. The next step is to understand users and their preferences so
that you can define a strategy to increase expected utilization.

Regarding user preferences, more than 70% of students use a private vehicle. Figure 7 shows that the most frequent
reasons why these students prefer their mode of transport are: "Because of Covid", "It is safer", "It is my only option",
"It is faster", "The user does not drive”. Of these five main points, the ones that are eligible for manipulation are the
third and fourth, mainly because they are aspects that can be further improved with a variety of strategies. These two
reasons can be conceptualized as two objectives of a model: travel time and coverage.

                                           © IEOM Society International                                            1314
Proceedings of the 11th Annual International Conference on Industrial Engineering and Operations Management
Singapore, March 7-11, 2021
Figure 5. Frequency of specific occupancy of each route
Figure 6. Estimated mode occupancy for each travel schedule for each route, in the new normal
Figure 7. Most frequent reasons for using your own car as a means of transportation.
© IEOM Society International 1315Proceedings of the 11th Annual International Conference on Industrial Engineering and Operations Management
Singapore, March 7-11, 2021
Each zone has two routes that go in opposite directions, but they essentially cover the same areas. In the case of San
Pedro, the routes are 21 km long, take approximately 50 minutes to travel, and cover 1,165 potential users. The Santa
Catarina routes are 36 km long, 90 minutes long and have a coverage of 720 potential users.
In order to identify potential areas to increase coverage, the first step was to realize a visual analysis of the choropletic
maps, locating the postal codes with the highest demand to decide between an expansion of the current routes or the
creation of a new one. As can be seen from the choropletic map in Figure 11, there is no reason to extend the current
routes, due to two main reasons: there is no other potential zip code nearby and furthermore the travel time would be
longer. On the other hand, there are several potential ZIP codes outside of the current routes, which encourages the
creation of new routes.
The next step is to consider the feasibility of possible zip codes. The criteria applied here are the structure of the road
network and traffic congestion during normal scenarios, the topography to ensure safe and fuel-efficient stops can be
made, and the approximate total travel time similar to the routes. current. Considering all the aforementioned factors,
and counting the UDEM population that lives in each zip code, the San Jerónimo area was chosen. It can be seen in
Figure 8 in the enlarged section. This is the second most populated zip code within the UDEM community. Another
decision criterion is the fact that 24% of the community in this area uses a means of transport other than private
vehicles and 40.7% are willing to use the Circuit UDEM service in a COVID-19 context, much higher than current
routes. A route created here could cover more than 800 potential users.
Figure 8. Choropleth map, current coverage and area for potential new route.
Finally, it is worth mentioning that the UDEM Circuit service is offered through an application in which users make
a reservation of the route and desired time. In its current state, the application only considers collections, since the
moment it detects that there are 19 collection reservations, equal to the normal capacity, it blocks and no one else can
make a reservation. This is a clear problem as deliveries are not considered. A clear example would be if 10 students
from the UDEM are collected at the beginning and they get off in the first half of the route, in the next half another
10 could be collected, but the current system does not allow it. This is a huge area for improvement as it can increase
availability by 100% at certain times when there is a mix of deliveries and pickups.
3.3 Problem Classification
According to the SBRP classification by Park & Kim (2010), the problem can be conceptualized as follows:
General criteria: Single school, the service is urban, student shifts are in the morning and in the afternoon, there is no
differentiation between passengers, the fleet is heterogeneous, the objective is focused on total travel time and
weighted coverage, the bus capacity is constant and the fleet size is constant.
Specific criteria: There are several fixed nodes, buses circulate in both directions for each route, student shifts are
combined (overlapped in many combinations), both pick-up and deliveries are made.
© IEOM Society International 1316Proceedings of the 11th Annual International Conference on Industrial Engineering and Operations Management
Singapore, March 7-11, 2021
The solution will answer the decision questions related to the selection of the stops and the generation of the routes.
The travel time of each student and coverage (social) will be considered as performance indicators, as limitations the
fleet size and number of drivers, the distance traveled and fuel consumption (economic), and as effects of decisions
primary, the emission of pollutants on the roads and the reduction of CO2 emissions by stopping the use of private
vehicles.
4 Implementation in the Circuit UDEM Case: Route Generation
The route generation process required first to calculate distances, to reallocate resources to release some to the new
routes, and the allocation of students’ demand, as follows:
4.1 Calculation of Distances
To obtain the most accurate data on the distances to be traveled by the buses, a GIS tool called the Google Maps API
was used. The use of this tool considers the road network and current traffic, in order to ensure real and feasible
distances and times. It is possible to integrate the API directly into the code, and with this the distance matrix is
obtained quickly and accurately.
4.2 Redistribution and release of resources for the proposed route
The first step taken was to eliminate the trips from the San Pedro route, relocating the buses to the San Jerónimo route.
San Pedro is chosen as a route to reduce travel, for several reasons:
• Severely underutilized, with a maximum of 27% of capacity occupied on the busiest trip.
• Between hours there is a drop in demand (that is, at 10:30 am, there is less demand than at 10:00 or 11:00 am).
• The high socioeconomic level of the Municipality of San Pedro, translates into only 8.7% willingness to use the
Circuit UDEM service.
• This route does not have mandatory nodes to visit, unlike the Santa Catarina route.
To provide a complete service, two buses will be relocated from the San Pedro route to the San Jerónimo route.
4.3 Student Assignment
Potential and feasible nodes were placed in the selected zip codes and a polygon was formed to be able to assign
demand to each node, all using the Street View Maps function. The nodes were spaced 500 m apart from each other,
to avoid redundancies. Whenever possible, nodes were placed on both sides of the street to give more flexibility to the
algorithms. Once this was done, the demand was distributed proportionally across the polygon of each node. Each
polygon contains a certain number of street blocks and, using the postal codes, the total population and the total
number of blocks, an estimate of the number of people per block was made. This makes each polygon contain a certain
amount of demand within its range. A 76% reduction was made to the demand of each node, to represent the number
of blended classes available, and finally a preference reduction was made using the 47% indicated above. This process
established the final demand for each node.
4.4 Generation of the New Route
Previously, nodes with potential demand were obtained during the allocation phase. The "distance" between each node
is actually the travel time, since the distance traveled is not a limiting factor. A vehicle routing problem with time
windows (VRPTW) was formulated with the following features: Nodes can be skipped, since it is not mandatory to
cover all of them, and finally a total travel time of 65 minutes must be considered, so the route is not significantly
longer than the current ones. Capacity was not considered, since the objective of the static model is to find the potential
nodes that guarantee a feasible travel time. After running model programming, on an Intel® Core (™) i5-8250u CPU
@ 1.6 GHz with 8 GB of RAM, the potential route was found. All the experimentation carried out in this work was
carried out on this computer. The total estimated travel time is 61 minutes, with a distance of 24 km and the coverage
of 43 potential users per day, considering the conditions and demand of NN. Using the Google Javascript API.
As can be seen in Figure 9, six nodes were chosen and will be set as the stops of the proposed route. The San Pedro
route takes 50 min and is 21 km long, with coverage of 23 potential daily users, while the Santa Catarina route lasts
90 min and is 36 km long, covering 52 potential users per day. Compared to the routes mentioned above, the proposal
is very similar to San Pedro with almost twice the coverage and shorter than Santa Catarina but with slightly less
coverage, showing its feasibility and convenience. Additional tests will be detailed later after scheduling is done.
© IEOM Society International 1317Proceedings of the 11th Annual International Conference on Industrial Engineering and Operations Management
Singapore, March 7-11, 2021
Figure 9. Map of the new proposed route
4.5 Experimentation
In order to build several alternatives so that the UDEM can modify its decisions according to the pace of development
of the pandemic, economic activation and the eventual reopening of its campus, three demand scenarios were
considered in times of new normality: 50 %, 80% and 98%, remembering that the previously analyzed scenario
assumes that 24% of the population will move to the UDEM. Table 2 summarizes the results.
Table 2. Routing results under several New Normality scenarios
Scenario Length Time Potential Stops Coverage with Arrival before
(km) (min) Demand current fleet class (min)
Most probable (24%) 24 61 43 7 100%Proceedings of the 11th Annual International Conference on Industrial Engineering and Operations Management
Singapore, March 7-11, 2021
5.1 Mobile Application Reservations System
The current Circuit UDEM application is programmed in a way that it doesn’t let the buses maximize their capacity.
In its current state, the application only considers pickups, since the moment it detects that there are 19 pickup
reservations, equal to the normal capacity, it blocks and nobody else can make a reservation. This is a clear problem,
since deliveries are not considered. This is a huge area of improvement since this can increase the availability a 100%
in certain hours when there is a combination of deliveries and pickups, such as 13:00.
A key aspect of this is changing the way the availability of seats is displayed in the app, where the change should be
made so it is only presented to the user after they have chosen the stops they want to hop on and off the bus. With this
information, two specific logical conditions were written so that App can tell the user if there is availability or not,
dynamically.
5.2 Mathematical Model
A VRP model was formulate with additional considerations, such as: a node in the network represents a duple: bus
route – departure time; breaking times for drivers, fleet capacity, etc. One version only tackles the optimization done
to improve the travel times once all reservations are done (static model). To assess the availability issue, the application
itself needs an improvement in its logic. The first consideration is that when a user has made a reservation the program
has to respect the time and location promised for his pickup or drop-off. The solution algorithm must have fast
processing, so it can be run on a daily basis without having to wait. Based on the experimentation, MIP (B&B) is
suitable for this case study. The benefit of this section will be the optimization of travel time and dynamic availability
of the van (dynamic model).
5.3 Experimentation
Scenario with 2019 Demand: For this section, testing was done to obtain the effects of SM in the operational part of
the problem. The first step was to manipulate the data to extract the real pickup and deliveries made in 2019, for every
day, route, schedule and stop. Each of these combinations is then simulated dynamically using a savings heuristic
(Clarke & Wright, 1964) and an exact algorithm to find if the total travel time could have been reduced with the
proposed solution. More than 24,000 experiments were performed. The non-dynamic times are obtained from the
current route times, where the vans must travel to every single node, this time is represented in Figure 10 as a vertical
red line.
Figure 10. Total travel time frequency of Dynamic versus Static model with 2019 demand.
As it can be seen there is a notable difference between the travel times when the route was optimized with dynamic
as “true”. For San Pedro, the most frequent travel times are around 16-18 min less than the current median time, and
for Santa Catarina they are between 22-31 min less than what the current route takes.
Scenario with 2021 Estimated Demand: The same exercise is done for the estimated 2021 demand.
© IEOM Society International 1319Proceedings of the 11th Annual International Conference on Industrial Engineering and Operations Management
Singapore, March 7-11, 2021
Figure 11. Total travel time frequency of Dynamic versus Static model with 2021 demand.
In this scenario, with less demand than normal, it is even more important to implement the proposed changes of the
dynamic section, since the observed time reduction can range from 20 to even 50 min (see Figure 11). With the
findings of this section in mind, it is concluded that the concepts of SM applied to school routing, such as using real-
time data of the travel times and reservations, reduce the total travel time, particularly in the framework of the NN,
where demand is low and volatile.
Another benefit is the reduction of emissions, which can lead to be up to 8.7 kg of CO2 for every trip, considering the
average bus velocity of 17.4 km/hr. (Factum, 2017), and a reduction of up to 14.5 km for using the service, since the
emissions of the vans are of 0.6 g/km (Huertas et al, 2018). In 2019, this would have translated to the formidable
amount of almost 53 tons of CO2 reduced in the best scenario.
Implementation 4.0: To further facilitate the implementation of the proposals presented in this work, an interactive
web application dashboard was developed. In the first tab there is an option to upload an excel file with the information
needed to realize the dynamic routing and scheduling. The excel file must contain the selected stops for the trip, with
their demand and coordinates. After uploading, the user can select any route or stop and click on the optimize button,
which will instantly run all the models involved. Then on the routing tab, the selected stops will be mapped, with the
performance of the indicators shown. The user will be able to observe the potential coverage, number of stops, travel
time and potential covered demand of those stops. In the scheduling tab, the user will be able to observe a Gantt chart
with the schedule of the trip, for every bus and route. The indicators shown here are route coverage, total trips, and
time before class.
The application connects to real-time data from Google Maps, and it has a configuration button that lets the user
change the optimization objective, run time, node order, among other features.
6 Conclusions
In this work, the reduced capacity problem of the COVID19 pandemic has been tackled, with focus on school
transportation. It has been demonstrated that improving efficiency of the system is possible in this environment, where
demand will be greatly reduced because of the confinement regulations. A real-life case study has been analyzed and
several solutions have been proposed. After identifying potential zones to increase the coverage of the service, the
selected area was studied to allocate its demand to the identified potential stops. Then a routing and scheduling exercise
was done to obtain the optimal route as well as start and end time for every available schedule, maximizing coverage
while minimizing total travel time. The dynamic phase was then carried out where a great improvement to the service
app was recommended as well as a proposal to optimize the van’s travel time during each trip drastically. The results
state an improvement in coverage, total travel time and better usage of the capacity, as well as the best solution methods
depending on the size and complexity of the case to be solved. Further investigation can be performed to further detail
how the changes in size and complexity of the problem can impact the performance of the studied methods.
© IEOM Society International 1320Proceedings of the 11th Annual International Conference on Industrial Engineering and Operations Management
Singapore, March 7-11, 2021
References
Bertrand, J. & Fransoo, J. (2002). Operations management research methodologies using quantitative modeling.
International Journal of Operations & Production Management. Vol 22, No. 2, pp. 241-264.
Cazau, P. (2006). Introducción a la Investigación en Ciencias Sociales. Buenos Aires. Available:
https://educacionparatodalavida.files.wordpress.com/2015/10/cazau_pablo_-_introduccion_a_la_
investigacion.pdf
Clarke, G. & Wright, J. (1964). Scheduling of Vehicles from a Central Depot to a Number of Delivery Points.
Operations Research, Vol. 12, 1964, pp. 568-581
Doménech, J. (2007). Huella ecológica y desarrollo sostenible. AENOR.
Ellegood WA, Solomon S, North J, Campbell JF. (2020). School bus routing problem: Contemporary trends and
research directions. Omega. https://doi.org/10.1016/j.omega.2019.03.014.
FACTUM. (2017). Movilidad en la Ciudad de México. Retrieved on Aug 8th, 2020 http://factum-
marketing.com/descargas/InfografiaMovilidadCDMX2017.pdf
Huertas, J.I, Giraldo, M., Quirama, L.F., Díaz, J.(2018) Driving cycles based on fuel consumption. Energies. 11(11),
3064
IMSS. (2020). Nueva Normalidad. Retrieved on Aug 8th, 2020 from:
https://www.gob.mx/covid19medidaseconomicas/acciones-y-programas/nueva-normalidad-244196
Leal, C., Gómez, C. (2020) A Smart School Routing Problem for the New Normality. Industrial and Systems
Engineering Undergraduate Thesis. Universidad de Monterrey, Monterrey.
Mitroff, I.I Betz, F., Pondy, L.R. and Sagasti, F. (1974) "On managing science in the systems age: two schemas for
the study of science as a whole systems phenomenon". Interfaces, Vol. 4 No. 3 pp 46-58.
Park J, Kim BI. (2010) The school bus routing problem: A review. European Journal of Operations Research.
https://doi.org/10.1016/j.ejor.2009.05.017.
UDEM. (2020). UDEM en movimiento. Available: https://www.udem.edu.mx/es/conoce/udem-en-movimiento
WHO - World Health Organization. (2020a). Considerations for school-related public health measures in the context
of COVID-19: annex to considerations in adjusting public health and social measures in the context of COVID-
19, 10 May 2020. World Health Organization. https://apps.who.int/iris/handle/10665/332052. License: CC BY-
NC-SA 3.0 IGO
WHO - World Health Organization. (2020b). Strengthening preparedness for COVID-19 in cities and urban settings:
interim guidance for local authorities. World Health Organization
https://apps.who.int/iris/handle/10665/331896. License: CC BY-NC-SA 3.0 IGO
Acknowledgements
Authors thank Universidad de Monterrey for the support and data provision.
Biographies
Carlos Mario Leal Garza is a recently graduated Industrial and Systems engineer from Universidad de
Monterrey. He is currently working as a continuous improvement engineer in the aerospace industry in Nuevo León,
Mexico, where he has developed operations research models implemented in programming languages for complex
systems. He has also experience in analytics, cloud services and different frameworks for web applications.
Carlos Gómez Acosta is a recently graduated Industrial and Systems engineer from Universidad de Monterrey.
He has worked in several optimization projects in the food, aerospace and mobility industries, and has experience in
logistics, manufacturing and inventory systems from his internship at John Deere.
Jenny Díaz Ramírez is currently a professor of the Department of Engineering at the University of Monterrey.
She has worked previously as professor at Tecnológico de Monterrey, Mexico and Pontificia Universidad Javeriana
Cali, Colombia. She is an industrial engineer from Universidad del Valle, Colombia. She holds an MSc in industrial
engineering from Universidad de Los Andes, Bogota, Colombia, an MSc in operations research from Georgia Tech,
US, and the PhD in Industrial Engineering from Tecnológico de Monterrey. She is a member of the National System
of Researchers of CONACYT, SNI Level I, since 2015 and recognized as an associated researcher by Colciencias,
since 2016. She is the author and co-author of scientific articles on topics such as applied optimization and statistics
in health systems, air quality, energy efficiency in transport and logistics.
© IEOM Society International 1321You can also read