Space Weather Forecasting - David Jackson and Edmund Henley Suzy Bingham, Emily Down, Siegfried Gonzi, Mike Marsh - University of Exeter Blogs
←
→
Page content transcription
If your browser does not render page correctly, please read the page content below
Space Weather Forecasting

David Jackson and Edmund Henley

Suzy Bingham, Emily Down, Siegfried Gonzi, Mike Marsh

STFC Introductory Solar System Plasmas Summer School
28 August 2018, University of Exeter
Contents
• A Quick Intro to Space Weather
• Met Office Space Weather Operations Centre (MOSWOC)
        • Rationale and Services

• How do we observe space weather?
• How do we forecast space weather?
• Way forward and issues
        • More and better (and coupled) models
        • More data (including L1/L5 missions)
                                                    2
© Crown copyright Met Office
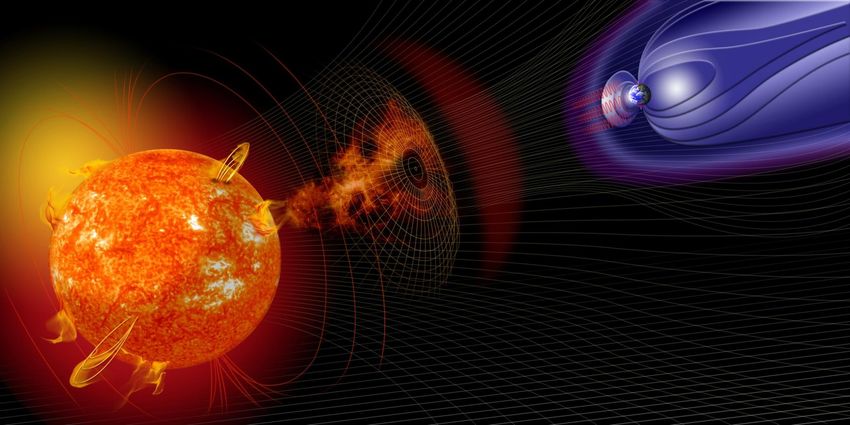
Solar eruptions
Space Weather
generally refers to
changing conditions onCoronal mass
the Sun, in the solar
                      ejections (CMEs)
wind, and in Near-Earth
space (magnetosphere,
ionosphere and
thermosphere)

..that can influence the
performance and
reliability of space-borne
and ground-based                                  Solar flares
technological systems
and can endanger
human life or health.

Much of it is intimately
linked to these solar         Solar energetic
eruptions
                                      particles
 Sophie Murray (TCD)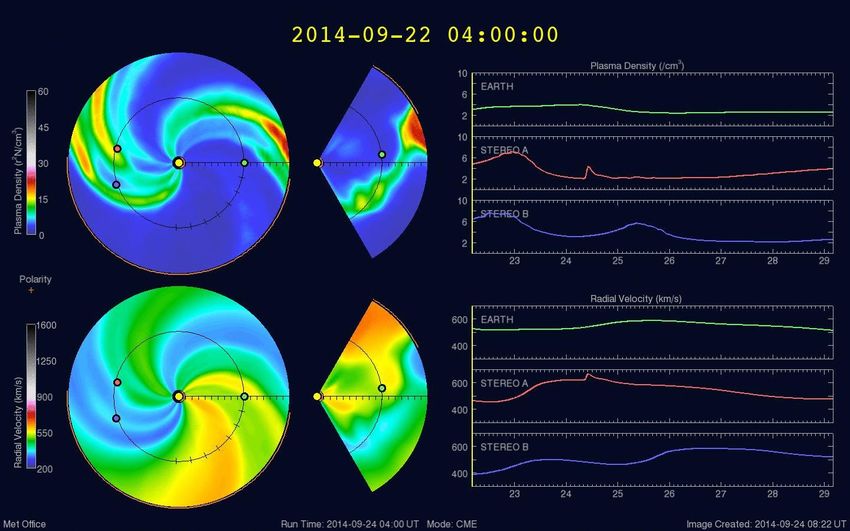
Space weather affects us all

                     Impacts on power grids,
                     satellites, aviation, GNSS,
                     comms, ….

© crown copyright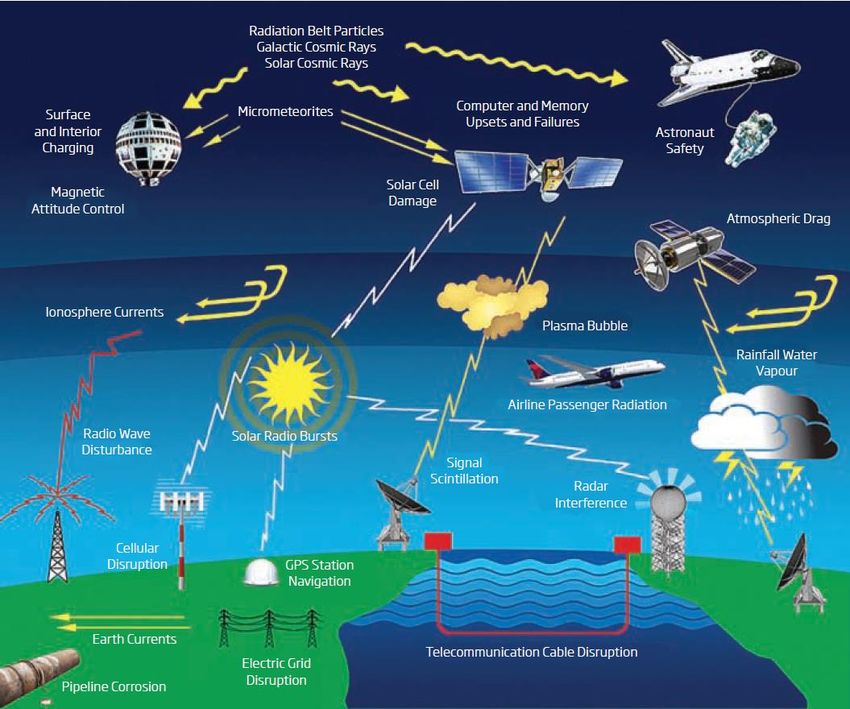
How do the solar eruptions connect to the impacts?
    Eruption          Physical impacts                               Tech. impacts
    Type
    CME               •   1-3 days to travel to Earth                •   GICs => disruption to
                      •   If “geoeffective” (Bz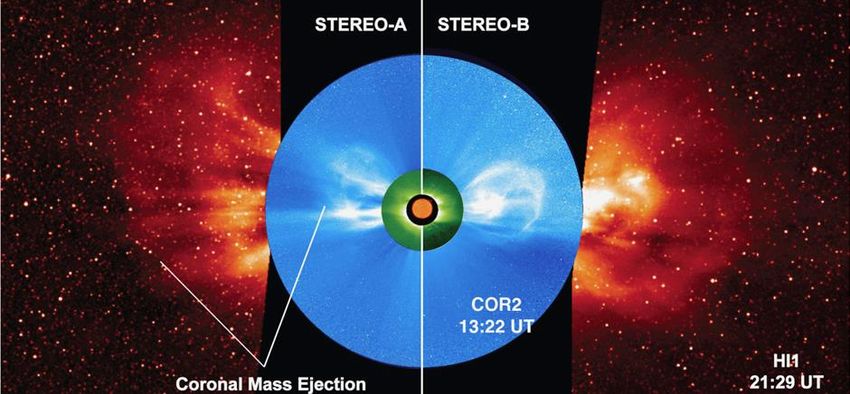
Met Office Space Weather
                Operations Centre (MOSWOC)
• 24/7 Operations
• Forecasts to 4 days ahead to
  meet UK Gov / Critical
  National Infrastructure /
  Industry requirements :
    •   CMEs
    •   Geomagnetic storms
    •   Flares
    •   Solar energetic particles
        (protons and electrons)

                                    • Set up in response to National Risk Register
                                    • Met Office owns risk on behalf of UK Government
                                      (Dept of Business, Energy and Innovation Strategy
                                      (BEIS))
Space Weather
       The Dynamic Space Environment
       Space Weather Types and Arrival Times from Sun

                      Electromagnetic       Galactic Cosmic Radiation
   Solar Wind
                    Radiation & Energetic
                    Charged Particles and
                      Charged Plasma

Challenges:
•Difficult to forecast accurately
•Short warning time to prepare once we have
certainty about speed and size of events
                  Days           Geomagnetic Storms

                Hours/Mins       Solar radiation Storms

                 Minutes      Solar Flares / Radio Blackout
                                                E: robert.seaman@metoffice.gov.uk
                             SECRET // UKEO     DII: METO-MET-INT-1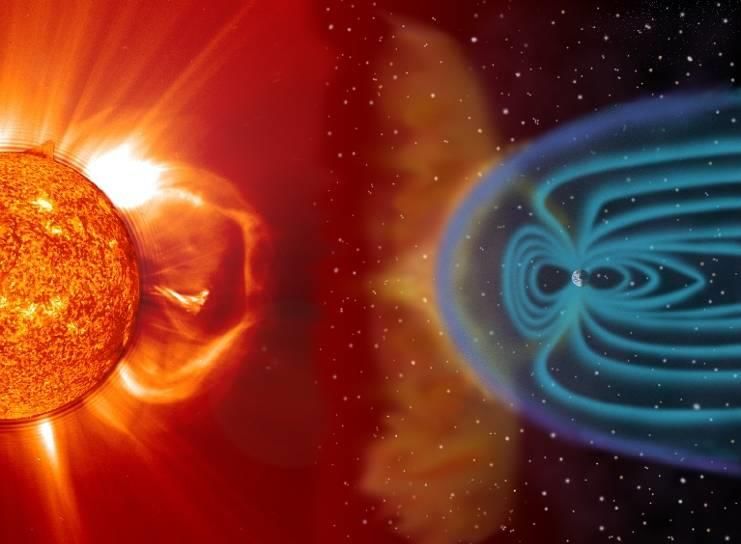
How do we even start?
Need to observe and assess current state first – good for alerts /
warnings
Then can use this as basis for forecasts – human-based, empirical
and numerical

© Crown copyright Met Office

How do we observe space weather?

© Crown copyright Met Office
Location of satellites
Not to scale

STEREO AHEAD

     SUN                           DSCOVR
                                   (ACE) &  EARTH
                                   SOHO SDO

                                     L1
                92 million miles      1 m miles
                                                  GOES
                                   L1 ORBIT

STEREO BEHIND
CMEs
Near solar maximum: ~3 CMEs/day. Near solar minimum:
~1 CME/5days.
CME Range
•
mass 1011-4 1013 g
speed 200-3000km/s
transit time 12-60h
kinetic energy 2 1030 erg
CME propagation detected by
coronagraphs:
• at L1 (NASA SOHO)
precessing (NASA/ESA
STEREO – were 2; now only
1)
•In situ observations of CMEs ACE and DSCOVR obs at L1 indicate CME hitting Earth Plasma speed jump due to ‘ballistic’ CME. Need to know magnetic field. If Bz < 0 in CME, geomag storm can be very large This is only definitive observation – only gives us ~30 mins lead time!!!!
Coronal Holes
These are regions of open magnetic
field lines in the Sun’s corona
These lead to high speed solar wind
streams.

Impacts
   Geomagnetic storms (CH/CME
   interaction can enhance these
   storms)
   Enhanced high energy electron
   flux (near Earth)

Observations
   SDO EUV images (for location
   and size)
•
Geomagnetic Storms
• Storms indicated on the
  Earth’s surface via
  magnetometer obs
• Large dB/dt will lead to large
  geomagnetic induced
  currents and impact on eg
  power grids
• This effect is typically
  described via the “Kp
  index” – a global index
  based on 13 worldwide
  stations
• Kp=9 (or G5) storm is what
  we are really worried about
      • We receive Kp nowcasts and forecasts from BGS and NOAA
        • We also receive magnetometer measurements from 3 UK sites
          from BGS to monitor local impact
Space Weather is usually linked
to Active regions
Big, bad, and ugly!
• We monitor ARs using SDO magnetograms and white
light images
• Also ground based (GONG) magnetogramsSolar Analysis
• First the forecasters do a solar
analysis (based on SDO data) – AR
classification and CH identification
• This identifies if there are complex
ARs likely to give CMEs, flares, SEPs
• AR analysis drives the flare forecast
• CHs => High Speed Stream and
geomagnetic storm forecast
Manual Coronal Hole analysis being replaced by automated methods
(CHIMERA: Tadhg Garton, TCD)Solar flares
• Classification of solar flare strength based on GOES X-ray flux
measurements
GOES Peak flux
Class [W m−2 ]
A 10−8
B 10−7
C 10−6
GOES 15
in eclipse M 10−5
X 10−4
Impacts
• X20 (Extreme; ,1 / solar cycle) complete HF blackout on sunlit
side of Earth for several hours
• M1 (Minor; 2000 / solar cycle) Weak or minor HF degradation
on SSoE. Occasional loss of radio contact
• Occur in active regions around sunspots: Several
flares/day around solar max. ~1/week around solar min.
• Location and structure measured by imagers (typically
EUV) – we usually use NASA SDOSolar radiation storms
High Energy Electron Flux
Usually linked to CHs
Observations
GOES >2MeV electron flux (for monitoring
near Earth fluxes)
S5 (extreme) Flux / particles: Airline passengers / crew may be exposed to
Associated with solar increased radiation;
flares (rapid onset) or 105 pfu; < 1 / cycle Some satellites may suffer temporary outages due
CMEs (gradual onset) to memory impacts.
Some aircraft electronic systems may experience
single event effects (SEE) => upsets or
Can be seen as “snow” unexpected behaviour
in coronagraph images
S3 (strong) 103 pfu; 10 / cycle Radiation hazard avoidance recommended for
astronauts on EVA; passengers & crew in high-flying
Near Earth impact seen aircraft at high latitudes may be exposed to radiation
in GOES proton flux risk.
observations Some SEE risk
HF comms affected at high latsHow do we forecast space weather? © Crown copyright Met Office
All Forecasts are categorical and
    probabilistic
•   Using categories helps by
      • Indicating action affected
          user may need to take.
      • Since forecasts are hard,
          may make forecast
          information more usable
          than more quantitative
          forecast
•   Have already introduced
    categories for flares (M and X
    class) and radiation storms (S3
    and S5 class)
•   Active / very active categories of
    high energy electron fluence
•   For geomagnetic storms use G
    index (KP – 5)
•   Probabilistic forecasts indicate
    level of uncertainty – also useful
    for interpretation
•   (focus on geomagnetic storms
    and flares in the following)
Geomagnetic storm & CME
forecasting
• Forecasters analyse images to identify CMEs and CHs and use WSA Enlil &
persistence model to predict HSSs, CMEs
• Geomagnetic storm forecasts are limited as Bz is unknown other than L1
(DSCOVR/ACE observations)
• Kp forecasts from BGS are statistical – no knowledge of current situation (eg
CMEs)
• So forecasters rely on their experience to interpret the information they have
availableSolar wind / CME forecast
model: WSA Enlil • Models solar wind speed
& density (IMF modelled
but no Bz input).
Predicts CME arrival
times at Earth.
• Inputs:
• (GONG) solar
magnetograms to
model coronal
magnetic field and
provide inner BCs
for Enlil.
• CME parameters
input into Enlil (from
CAT)
• Run every 2hrs
• Forecasts: average
error: +/- 7 hrs; lead
time: CME transit time –
a few hrs
Ensemble prediction
system now operationalCH influence
• CHs influence solar wind and
thus geomagnetic storms
How do we assess impact?
• CH perturbations should be
picked up in magnetograms and
thus WSA Enlil initial conditions
• Use recurrence
• CH size can grow / shrink
from one solar rotation (27
days) to the next
• Solar wind persistence model
very goodFlare Forecast
• Statistical models link complexity of ARs with
probability of occurrence of different classes of
flares
• Forecasters use experience to modify this
before issuing forecast
MOSWOC
issued
forecasts
better than
raw ones
Murray et al (2015)Forecast Verification
Solar Flares
SRSs issued every 6 hrs for each classified AR
RPSS
0.40
0.35
0.30
0.25
0.20
0.15
0.10
0.05
RPSS
0.00
-0.05
Need to know how good
-0.10
-0.15
forecasts are to drive further
-0.20
improvement
-0.25
-0.30
-0.35
NRT verification in operation /
being developed
Rolling 12-monthly RPSS values (x) with 90% bootstrapped
CIs for each day of the geomag storm forecast (Mar-Oct International praise and
2016). Day 1,2,3 & 4 are indicated by solid, long dashed,
short dashed and dotted lines, respectively. demandWay forward and Issues © Crown copyright Met Office
Toward Sun-Earth coupled modelling

                                                                 • Magnetosphere
                                                                 • Radiation belts
                           • Solar wind
                             (interplanetary space)

  • Photosphere
    (solar surface)
  • Corona
    (solar atmosphere)                                         • Ionosphere
                               •Upper / lower atmosphere
                                                               • Thermosphere
                               coupling (via whole             • Middle and Lower
                               atmosphere UM)
                                                                 atmosphere
                               •Thermo / ionosphere
                               coupling

GOAL: Coupled Sun-to-Earth models with DA for much-enhanced forecast capacity
Sun-to-Earth modelling
What’s missing?
----------------------------------------------- No coupling ! ------------------------------------------
•Ionospheric
•CME prediction scintillation
•coronal magnetic field •Strength of •Thermosphere
modelling
storms / modelling
•What ARs shall substorms •Thermo / ionosphere
be eruptive? •Bz prediction coupling
•No magnetosphere
•DA / IPS data model ! •Upper / lower
•Flare prediction, AR atmosphere coupling
tracking •SEP propagation
(whole atmosphere
•CH and filament model)
identification
•SEP initiation
---------------------------------------------- Forecast verification in development -----------------------------------------------
Opinion of MOSWOC Scientists, Forecasters, ManagersOther (WSA) Enlil developments • WSA initialised with Carl GONG m/graphs Henney • Do this better using (AFRL) DA – ADAPT • ADAPT gives ensemble solutions – possible ensemble of ambient solar wind forecasts • IPS – ground based • Also trialling NLFFF solar wind obs – to drive model (Durham / St Enlil Andrews) – 1st step • Possibly also new Bz to CME prediction measurements 10X in – but major advance of current research needed
Towards Coupled Modelling
SEPs:
• SPARX
High energy electrons:
• BAS RB model? Physics-based,
  not confined to GEO
Magnetosphere:
   • SWMF (Michigan) being
     implemented and tested
   • Will enable Magnetosphere /
     Ionosphere coupling
Thermosphere / ionosphere:
   • Extended UM (to ~150 km) in
     development + coupling to
     TIEGCM
The observation network
Apart from DSCOVR and GOES, all
observations “science” not “operational”
Risk to CME monitoring since SOHO and
STEREO beyond planned lifetime. Solutions:
• L1 and L5 operational missions planned
• Alternative observations – ground based L5 mission will replicate
radio telescopes (IPS) and enhance STEREO:
Magnetosphere has similar issues – quite a lot of • c/graph
GEO obs but few elsewhere
• HI
Ionosphere well observed but thermosphere and
radiation not • m/graph
Observation requirements defined via WMO but • EUV imager
more concerted efforts needed
• Solar wind (U,r,B)Summary
• Space Weather related to solar eruptions and impacts
health and technology – so on UK NRR
• =>MOSWOC monitors / forecasts SpWx for UK
• How do we observe and forecast space weather?
• Issues
• More and better (and coupled) models needed – but lots
of underpinning research and improved understanding
needed
• More operational data (including L1/L5 missions)
urgently needed 32
© Crown copyright Met OfficeExtra slides
National risk register
                     The UK government response guide
                                                                                  Pandemic flu
Catastrophic                                       Electricity
                                                    failure
                                Coastal floods

 Significant                                                                      Severe space
                                 Transport                       Effusive
                                 accidents                       volcano            weather

                 Industrial
                 accidents
 Moderate
                                                                                    Heavy snow
                                                                                    & low temps

   Minor        Impact                                                             Volcanic ash

                               Public
  Limited      Likelihood     disorder
                                         Drought                     Industrial
                                                                       action

                  Low           Medium low          Medium         Medium high          High
Active region classification
Zpc format: Combined:
Z – modified α – unipolar
Zürich class
β – bipolar
(general
distribution, size) γ – mixing of
polarities
p – primary
penumbra shape δ – opposite
polarity
c – interior spot
umbrae within
compactness
one penumbra
• Larger and more complex ARs typically give you
the strongest flares and biggest CMEs
• AR classification can drive some models
© Crown copyright Met OfficeOther models used
D-RAP: HF absorption due to
flares, SEPs
Bernese: TEC (ionosphere):
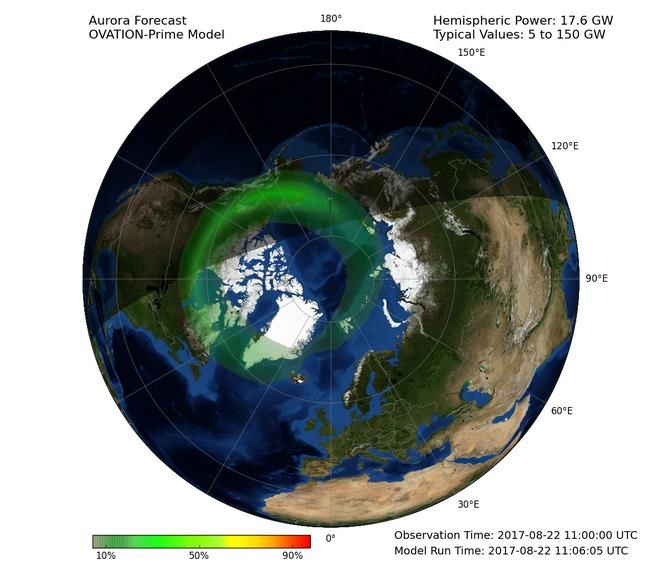
•OVATION Aurora Forecast Model GNSS impacts
•Nowcast version operational and 3
day forecast version being testedSEPs / Proton flux Forecasts based on • active region analysis • assessment of NRT data from GOES
Electron flux
                                 Relativistic
                                 Electron
                                 Forecast Model
                                 (REFM)
                                    •    Forecasts of >2
                                         MeV flux at
                                         GEO up to 3
                                         days ahead
                                    •    Driven by L1
                                         data ACE /
                                         DSCOVR
                                    •    Statistical model
                                         trained on
                                         historical data
Issued forecasts based on:
  •   REFM forecasts
  •   assessment of CHs
  •   assessment of NRT data from GOES
You can also read