SPATIOTEMPORAL PARAMETERS AND GAIT VARIABILITY IN PEOPLE WITH PSORIATIC ARTHRITIS (PSA): A CROSS-SECTIONAL STUDY
←
→
Page content transcription
If your browser does not render page correctly, please read the page content below
Walha et al. Journal of Foot and Ankle Research           (2022) 15:19
https://doi.org/10.1186/s13047-022-00521-y

 RESEARCH                                                                                                                                         Open Access

Spatiotemporal parameters and gait
variability in people with psoriatic arthritis
(PsA): a cross-sectional study
Roua Walha1, Nathaly Gaudreault1, Pierre Dagenais1 and Patrick Boissy1,2*

  Abstract
  Background: Foot involvement is a major manifestation of psoriatic arthritis (PsA) and can lead to severe levels of
  foot pain and disability and impaired functional mobility and quality of life. Gait spatiotemporal parameters (STPs)
  and gait variability, used as a clinical index of gait stability, have been associated with several adverse health
  outcomes, including risk of falling, functional decline, and mortality in a wide range of populations. Previous studies
  showed some alterations in STPs in people with PsA. However, gait variability and the relationships between STPs,
  gait variability and self-reported foot pain and disability have never been studied in these populations. Body-worn
  inertial measurement units (IMUs) are gaining interest in measuring gait parameters in clinical settings.
  Objectives: To assess STPs and gait variability in people with PsA using IMUs, to explore their relationship with self-
  reported foot pain and function and to investigate the feasibility of using IMUs to discriminate patient groups
  based on gait speed-critical values.
  Methods: Twenty-one participants with PsA (age: 53.9 ± 8.9 yrs.; median disease duration: 6 yrs) and 21 age- and
  sex-matched healthy participants (age 54.23 ± 9.3 yrs) were recruited. All the participants performed three 10-m walk
  test trials at their comfortable speed. STPs and gait variability were recorded and calculated using six body-worn
  IMUs and Mobility Lab software (APDM®). Foot pain and disability were assessed in participants with PsA using the
  foot function index (FFI).
  Results: Cadence, gait speed, stride length, and swing phase were significantly lower, while double support was
  significantly higher, in the PsA group (p < 0.006). Strong correlations between STPs and the FFI total score were
  demonstrated (|r| > 0.57, p < 0.006). Gait variability was significantly increased in the PsA group, but it was not
  correlated with foot pain or function (p < 0.006). Using the IMUs, three subgroups of participants with PsA with
  clinically meaningful differences in self-reported foot pain and disability were discriminated.
  Conclusion: STPs were significantly altered in participants with PsA, which could be associated with self-reported
  foot pain and disability. Future studies are required to confirm the increased gait variability highlighted in this study
  and its potential underlying causes. Using IMUs has been useful to objectively assess foot function in people with
  PsA.
  Trial registration: ClinicalTrials.gov, NCT05075343, Retrospectively registered on 29 September 2021.
  Keywords: Psoriatic arthritis, Foot pain, Foot function, Spatiotemporal parameters, Gait variability, Gait analysis

* Correspondence: Patrick.Boissy@usherbrooke.ca
1
 Faculty of Medicine and Health Sciences, Université de Sherbrooke,
Sherbrooke, QC, Canada
2
 Research Center on Aging, CIUSSS Estrie CHUS, Sherbrooke, QC, Canada

                                      © The Author(s). 2022 Open Access This article is licensed under a Creative Commons Attribution 4.0 International License,
                                      which permits use, sharing, adaptation, distribution and reproduction in any medium or format, as long as you give
                                      appropriate credit to the original author(s) and the source, provide a link to the Creative Commons licence, and indicate if
                                      changes were made. The images or other third party material in this article are included in the article's Creative Commons
                                      licence, unless indicated otherwise in a credit line to the material. If material is not included in the article's Creative Commons
                                      licence and your intended use is not permitted by statutory regulation or exceeds the permitted use, you will need to obtain
                                      permission directly from the copyright holder. To view a copy of this licence, visit http://creativecommons.org/licenses/by/4.0/.
                                      The Creative Commons Public Domain Dedication waiver (http://creativecommons.org/publicdomain/zero/1.0/) applies to the
                                      data made available in this article, unless otherwise stated in a credit line to the data.
Walha et al. Journal of Foot and Ankle Research (2022) 15:19 Page 2 of 13 Background However, there are scarce data on gait STPs in people Psoriatic arthritis (PsA) is a chronic inflammatory ar- with spondyloarthritis, including PsA [14, 25]. For in- thropathy associated with skin psoriasis and belongs to stance, a recent study demonstrated changes in gait the spondyloarthropathy family. Several musculoskeletal STPs including reduced gait speed, stride length, and manifestations can occur during the disease course, and swing time, and increased double support time, which both axial and peripheral joints can be affected. The foot were associated with self-reported pain in people with and the ankle are common targets of inflammation and axial spondyloarthritis [26]. Similar changes were re- their involvement could be a major manifestation of the ported in a few studies in people with PsA [5, 27, 28]. disease in terms of frequency and severity [1–3]. Foot For example, Hyslop et al. assessed cadence, gait speed, and ankle problems include dactylitis, enthesitis, syno- stride length, and double support time in people with vitis, and tenosynovitis and can lead to foot and/or ankle PsA with and without enthesitis and showed that stride pain, stiffness, swelling, and deformity [4–8]. Conse- length was significantly lower in the PsA group with quently, a high proportion of patients could experience enthesitis [27]. A study by Woodburn et al., which was moderate to high levels of foot impairment and difficul- based on the same cohort as Hyslop et al., showed a sig- ties with activities of daily living that require good foot nificant decrease in gait speed in a PsA group with function, such as walking [3, 4, 9]. enthesitis compared to healthy controls [28]. On the Pain and physical function are identified among the other hand, Wilkins et al. investigated cadence, gait most important clinical domains to be measured in PsA speed, and double support time in people with PsA with clinical studies by the Group for Research and Assess- and without active dactylitis. Their findings showed a ment of Psoriasis and Psoriatic arthritis (GRAPPA) [10]. decreased gait speed and increased double support in While patient-reported outcomes are commonly used to both PsA groups. However, no significant differences assess pain and perceived function, gait analysis could be were demonstrated compared to the control group. This used to obtain objective measures of physical function could be explained by the small sample size, the rela- [11] In people with inflammatory joint disease, including tively young mean age of the study participants (36.7 ± rheumatoid arthritis (RA) and PsA, different gait param- 21.5 years) and the short disease duration (4.6 ± 6.7 eters of varying complexity, such as joint kinetics and years), which were previously shown to be correlated kinematics, plantar pressure, and spatiotemporal param- with gait parameters in people with RA [5, 29]. eters (STPs), have been employed to assess either global Overall, the above studies demonstrate alterations in function or localized foot function [12–14]. Among gait STPs. However, despite including participants with these parameters, STPs, which typically encompass gait confirmed foot involvement, it is not clear whether al- speed, stride length, cadence, double support, and swing tered gait STPs are associated with self-reported foot time present certain ease of interpretability by both clini- pain and disability. On another note, the reported alter- cians and patients and have great utility in predicting ations could be indicative of increased gait instability health outcomes. For example, a reduced gait speed was since such changes are characteristics of cautious gait associated with an increased risk of falling [15], func- patterns that are typically undertaken by older adults to tional decline [16] and mortality in older adults [17]. increase stability [30]. In fact, a few recent studies dem- Gait speed was also designated the 6th vital sign, and onstrated altered static and dynamic balance [31, 32] precise cut-off values have been used to predict specific and increased risk of falling in people with PsA [33]. outcomes in older adults [18, 19]. Both the STP mean Fall-related risk factors have not been studied in people values and the variation around them, referred to as gait with PsA. Nevertheless, research in RA showed that variability, are key metrics in gait evaluation [20]. Gait swollen and tender lower extremity joints were among variability is used as a clinical index for gait stability [21] the most significant fall-related risk factors [34]. Taking and is associated with an increased risk of falling in all this into account, despite being a relevant and easy- older adults [22]. to-measure gait parameter, no previous research has in- Importantly, STPs and gait variability can now easily vestigated gait variability and its relationship with self- be measured with emerging lightweight, low-cost, and reported foot pain and function in people with PsA. easy-to-use wearable inertial measurement units (IMUs). Thus, given the limited evidence regarding STPs, gait These latter have shown acceptable accuracy and preci- variability, and their relationship with foot pain and dis- sion in measuring STPs in people with PsA and axial ability in people with PsA, this study aimed 1) to investi- spondyloarthritis [23, 24]. gate STPs and gait variability in participants with PsA Many studies investigated gait STPs in people with RA with foot pain and compare them to age- and sex- with foot involvement and showed significant alterations matched healthy participants using body-worn IMUs, 2) in gait STP which included reduced gait speed, stride to explore the relationship between STPs, gait variability, length and cadence, and increased double support [14]. and self-reported foot pain and disability, and 3) to
Walha et al. Journal of Foot and Ankle Research (2022) 15:19 Page 3 of 13
investigate the feasibility of using body-worn IMUs to Outcomes and measurement tools
discriminate patient groups based on gait speed-critical Clinical parameters
values.
Disease characteristics Disease duration, current medi-
cation, and C-reactive protein (CRP) levels, as a marker
Methods of systemic inflammation, were obtained from the pa-
Study design tient’s medical record.
A portion of the data presented in this descriptive cross-
sectional study pertains to an ongoing pre-experimental Foot and lower limb pain Given that lower limb and
trial exploring the effects of custom-made foot orthoses lower back pain are not uncommon in people with PsA
on foot pain and function and gait STPs in people with and that they could affect gait patterns [26, 36–39],
PsA. Baseline gait STP measures in participants with knee, hip, and lower back pain were assessed in addition
PsA captured during a standardized 10-m walk within to foot pain using the numerical rating scale (NRS) in
this pre-experimental study were compared to age- and participants with PsA and healthy controls. Participants
sex-matched controls undergoing the same clinical gait were asked to circle a number between 0 and 10 that
evaluation protocol. best fits their average pain intensity experienced in the
foot, knee, hip, and lower back over the seven days pre-
Participants ceding the data collection. Moreover, all the participants
Twenty-one participants with PsA were consecutively re- in the PsA group were examined by a trained podiatrist
cruited from the rheumatology outpatient clinics at the with eight years of professional clinical experience, in an
Hotel Dieu University Hospital CHU of Sherbrooke independent podiatry clinic. Pain sites and deformities at
(CHUS). Inclusion criteria were the following: being be- the feet were documented from the podiatrist’s clinical
tween 20 and 70 years of age, having a rheumatologist- examination record.
confirmed PsA diagnosis, having recurrent and moderate
(> 3 points) to severe (> 6 points) foot pain as reported Foot function Foot function was measured in the PsA
on a 0 to 10 numerical rating scale [35], and receiving group with the Foot Function Index (FFI), a reliable and
stable medication for at least the three months preced- valid questionnaire that has been proven suitable for use
ing recruitment. Exclusion criteria applied to patients in people with foot disorders and a low functioning sta-
with diabetes, neurological disease, or any musculoskel- tus [40, 41]. The FFI was chosen to be used in this study
etal disease that could impact normal gait patterns. Pa- because it has a validated version in French [42]. The
tients who received intra-articular corticosteroid FFI comprises 23 items divided into three sub-scales
injections or any conservative foot treatment, such as measuring foot pain (FFI-Pain), foot disability (FFI-Dis-
foot orthoses, within the past three months were ex- ability), and foot-related activity limitation (FFI-Activity
cluded because they may influence their gait. Twenty- Limitation). Each FFI item is recorded on an NRS (0 to
one control participants matched for age and sex with 10). A total score and three sub-scale scores were calcu-
no self-reported foot/ankle problems were also recruited lated. For an easier interpretation, the scores are pre-
using flyers posted in the research center and the word- sented as percentages, where a higher percentage
of-mouth strategy. They had to be devoid of a current or indicates higher levels of foot pain and related disability.
recent history of foot/ankle pain and self-reported gait
deficits. The study was approved by the CIUSSS de l’Es- Gait analysis
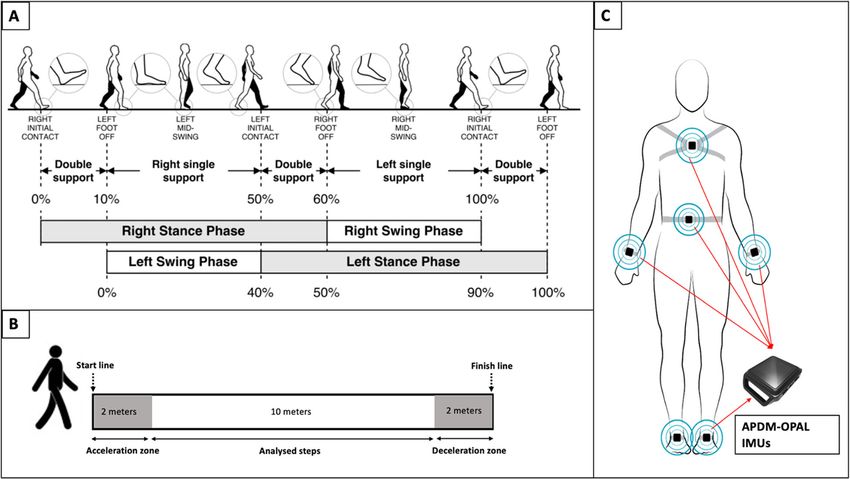
trie-CHUS Institutional Review Board and all the partici- Gait STPs presented and defined in Table 1 and Fig. 1A
pants provided written informed consent. [44] were measured in participants with PsA and healthy
controls using Opal IMUs and Mobility Lab software
(APDM Wearable Technologies, Portland, OR, USA).
Data collection procedure The Mobility Lab has been validated in healthy and
Upon their arrival at the Université de Sherbrooke Re- pathological populations such as Parkinson’s disease
search Center on Aging, demographic data, including [45–47]. The accuracy of this system was also assessed
sex, age, body mass index (BMI), and foot and lower in people with PsA in a previous work that showed ac-
limb pain, were obtained for all participants (PsA and ceptable errors in measuring gait STPs recorded over a
controls). Perceived foot function was additionally treadmill at a normal walking speed [23]. The mobility
assessed in PsA participants. Afterward, an instrumented lab includes a set of six IMUs each with a triad of sen-
gait analysis was performed for each participant (PsA sors (a 3-axis accelerometer, a 3-axis gyroscope, and a 3-
and controls). Disease-related information was obtained axis magnetometer) (Fig. 1. C), an access point for wire-
for participants with PsA from their medical records. less data transmission and synchronization and softwareWalha et al. Journal of Foot and Ankle Research (2022) 15:19 Page 4 of 13
Table 1 Gait Spatiotemporal Parameters (SPTs), measurement units, and definitions
Variables Units Definitions
Cadence Step/minute Number of steps per minute
(step/min)
Gait speed Meter/second The forward speed of the subject, measured as the forward distance traveled during the gait cycle divided by
(m/s) the gait cycle duration.
Stride length Meters (m) The forward distance traveled by a foot during a gait cycle.
Double support % GCT The percentage of the gait cycle in which both feet are on the ground.
time
Swing time % GCT The percentage of the gait cycle in which the foot is not on the ground.
Foot strike degrees The angle of the foot dorsiflexion at the point of initial contact. The pitch of the foot when flat is zero and
angle positive when the heel contacts first.
Stride time % The percentage of each participant’s standard deviation of stride time is divided by the same parameter mean
variability value.
GCT gait cycle time
Definitions were provided by [43]
(Mobility Lab) that provides an automated estimation of for the analysis (Fig. 1. B). The participants were asked
several STPs (Table 1). Details on the algorithm allowing to walk at their usual preferred self-selected speed wear-
for STP calculation with the Mobility Lab system have ing comfortable walking shoes, and none of the partici-
been previously described [48]. pants used foot orthoses or modified footwear. The
All the participants performed three trials of the 10-m Mobility Lab IMUs were fixed with elastics straps on the
walk test (10MWT) (Fig. 1. B), which consists of walking chest, the lower back, and both wrists and feet as recom-
over a 14-m straight walkway at a comfortable speed. mended by the manufacturer’s instructions (Fig. 1. C).
Two extra meters at the beginning and the end of the Stride time variability was chosen as a measure of gait
trials were added to account for the acceleration and de- variability, as it is the most commonly reported param-
celeration, and only the central 10 m were considered eter in clinical studies [49]. This metric was calculated
Fig. 1 A The gait cycle phases taken from an open access article [40]; B 10 m walk test (10MWT); C The Mobility Lab sensors placementWalha et al. Journal of Foot and Ankle Research (2022) 15:19 Page 5 of 13
as the coefficient of variation (CV), defined as the per- males, 16 females) with a mean age of 54.2 ± 9.3 years
centage of each participant’s standard deviation of stride were included (Table 1). BMI was significantly higher in
time divided by its mean value: participants with PsA than in healthy controls (29.3 ± 4.5
vs 24.4 ± 3.4), p < 0.001). Because of the different thresh-
SD olds used by the laboratories, CRP levels are reported as
CV ¼ x 100%
Mean normal or high. CRP levels were missing, high and nor-
mal for 4, 1 and 16 participants, respectively. Ninety per-
cent of the patients were treated with disease-modifying
Statistical analysis anti-rheumatic drugs (DMARDs) and/or biological
Based on data from a previous study comparing gait pa- therapy.
rameters between people with PsA diagnosed with rear- The NRS scores showed moderate to severe levels of
foot enthesitis and healthy controls [27], an average effect lower limb pain in the PsA group. 52.4 and 38.1% of the
size was calculated from the means and standard devia- participants with PsA reported moderate and severe foot
tions reported for cadence, gait speed, stride length, and pain, respectively, while foot and lower limb pain levels
double support time. Given the calculated effect size (d = were close to zero in healthy participants (Table 2). The
0.8), a total sample size of 32 participants (16 per group) FFI sub-scores also showed moderate to severe levels of
was required to detect significant differences in gait STPs self-reported foot pain (55.7 ± 18.3) and disability
with a paired t-test at an α of 0.01 and a power of 0.95. (44.6 ± 22.7) in participants with PsA. The most fre-
The Shapiro-Wilk test was used to examine data dis- quently reported pain sites at the feet were the ankles,
tribution. Paired t-tests and the Wilcoxon signed-rank followed by the metatarsals, toes, and heels (plantar and/
test were used to assess the differences in gait STPs and or posterior heel), and 18 (85%) participants had simul-
stride time variability between participants with PsA and taneous forefoot and rearfoot pain. Sixty-two percent of
matched healthy controls, and Cohen’s effect size was the participants in the PsA group had heel valgus, 67%
calculated to quantify the magnitude of these differences. had hammer/claw toes and 24 and 19% had hallux val-
ANCOVA was used to adjust the differences in STPs be- gus and hallux rigidus, respectively.
tween PsA and healthy participants for the effect of
BMI. Pearson’s and Spearman’s correlation coefficients Spatiotemporal parameters and gait variability in PsA and
were calculated to assess the relationships between STPs, healthy participants
gait variability, and self-reported foot pain and function Gait STPs for left and right foot in PsA and healthy par-
in participants with PsA. Correlation coefficients were ticipants are presented in Table 3. There were significant
considered weak, moderate and strong for values be- differences between the two groups in all the measured
tween 0.1 and 0.3, 0.3 and 0.5, and > 0.5, respectively STPs except for the foot strike angle of the right foot.
[50]. Given the clinical relevance of gait speed and the STPs averaged for left and right foot and stride time
availability of reference values for this metric, subgroups variability adjusted for BMI in PsA and healthy partici-
of participants with PsA were differentiated based on pants are summarized in Table 4. Before adjusting the
critical values of gait speed (1.0 m/s: the limit below data for BMI, all STPs except for foot strike angle were
which gait speed values are associated with higher mor- significantly different between groups. Cadence, gait
tality and 1.2 m/s: the lower limit of the confidence speed and stride length and swing time were signifi-
interval for normative gait speed [17, 51]). The relation- cantly lower in participants with PsA, and large effect
ships between gait speed, FFI total score and FFI sub- sizes were reported (p < 0.006; 1.08 < d < 1.3) (Table 4).
category scores for these three subgroups were visual- Gait cycle duration and double support time were sig-
ized in scatter plots. nificantly higher in the PsA group, and large effect sizes
As multiple variables that may be highly correlated were also reported (p < 0.006; d = 1.2 and d = 1.26)
were tested, the Bonferroni correction method was used (Table 4). After adjusting the differences for BMI, only
to reduce type I error resulting from multiple testing. cadence, gait cycle duration, and gait speed remained
Therefore, P values < 0.006 were considered statistically significantly different between groups, while the differ-
significant. Analyses were performed using SPSS version ences in stride length (p = 0.026), double support (p =
26.0 (IBM SPSS, Armonk, NY). 0.022), and swing time (p = 0.023) were no longer signifi-
cant. Stride time variability was significantly higher in
Results the PsA group before and after adjusting for BMI (p =
Demographics and clinical characteristics 0.001 and p = 0.005), and a moderate effect size was re-
Twenty-one participants with PsA (5 males, 16 females) ported (d = 0.68) (Table 4).
with a mean age of 53.9 ± 8.9 years and a mean disease Three subgroups of participants with PsA (PsA1,
duration of 11.5 ± 10.2 years and 21 healthy controls (5 PsA2, and PsA3) were differentiated based on gaitWalha et al. Journal of Foot and Ankle Research (2022) 15:19 Page 6 of 13
Table 2 Demographics and clinical characteristics of participants with PsA and healthy participants
Variables PsA CONTROLS
Mean ± SD Mean ± SD
AGE (years) 53.9 ± 8.9 54.23 ± 9.3
2)
BMI (kg/m 29.3 ± 4.5) 24.4 ± 3.4*
SEX (M: F) 5: 16 5: 16
DISEASE DURATION (years) 11.5 ± 10.2 (Median = 6, IQR: 12) –
CRP (mg/l)
Normal 16 (94%)
High 1 (6%)
Pharmacological therapy
DMARDs 6 (30%)
Biological therapy 5 (25%)
DMARDs and Biological therapy 7 (35%)
Foot pain (0 to 10 points) 5.6 ± 1.9 0.2 ± 0.6*
Knee pain (0 to 10 points) 4.7 ± 2.6 0.5 ± 1.2*
Hip pain (0 to 10 points) 4.8 ± 2.9 0.1 ± 0.3*
Lower back pain (0 to 10 points) 5.4 ± 2.7 1.6 ± 2.5*
Foot function Index
FFI-Pain (%) 55.7 ± 18.3 –
FFI-Disability (%) 44.6 ± 22.7
FFI-Activity limitation (%) 34.3 ± 24.4
FFI-Total (%) 47.02 ± 18.3
Pain sites –
Toes 15 (71%)
Metatarsals 16 (76%)
Heels 11 (52%)
Ankles 17 (81%)
Deformities –
Rearfoot valgus 13 (62%)
Hallux valgus 5 (24%)
Hallux rigidus 4 (19%)
Hammer/claw toes 14 (67%)
Values are mean ± standard deviation and percentages for categorial variables, p values < 0.006 are considered significant, *: p < 0.006. BMI body mass Index, M
males, F females, FFI foot function index
Table 3 Spatiotemporal parameters (STPs) for left and right foot in participants with PsA and healthy matched controls
Variable PsA participants Control participants p-value
Left Right Left Right Left Right
Cadence (step/min) 108.1 ± 10.8 107.7 ± 10.8 120 ± 6.8 119.9 ± 6.9 0.000 0.000
Gait cycle duration (s) 1.1 ± 0.1 1.1 ± 0.1 1 ± 0.1 1 ± 0.1 0.000 0.000
Gait speed (m/s) 1.1 ± 0.2 1.1 ± 0.2 1.4 ± 0.2 1.3 ± 0.2 0.000 0.000
Stride length (m) 1.2 ± 0.2 1.2 ± 0.2 1.4 ± 0.2 1.3 ± 0.1 0.001 0.001
Double support time (% GCT) 21.9 ± 4.1 22.1 ± 4.1 17.8 ± 2.7 18 ± 2.7 0.000 0.000
Swing time (% GCT) 39.4 ± 1.9 38.6 ± 2.4 41.3 ± 1.4 40.8 ± 1.4 0.001 0.000
Foot strike angle (degrees) 25.3 ± 4.1 24.7 ± 3.9 28.6 ± 2.7 27.7 ± 3.7 0.008 0.015
Values are Mean ± standard deviation, p values < 0.006 are considered significant
PsA Psoriatic arthritis, GCT gait cycle timeWalha et al. Journal of Foot and Ankle Research (2022) 15:19 Page 7 of 13
Table 4 Spatiotemporal parameters (STPs) averaged for left and right foot and stride time variability in participants with PsA and
healthy matched controls before and after adjustment for BMI
Variables PsA participants Control participants Cohen’s
d
Mean ± SD Adj Mean (SE) Mean ± SD Adj Mean (SE)
Cadence (step/min) 107.91 ± 10.78 107.47 (2.12) 120.08 ± 6.8a 120.55 (2.17) b
1.3
a b
Gait cycle duration (s) 1.13 ± 0.14 1.13 (0.03) 1.00 ± 0.06 1.00 (0.03) 1.2
a b
Gait speed (m/s) 1.07 ± 0.23 1.10 (0.05) 1.35 ± 0.2 1.38 (0.06) 1.3
Stride length (m) 1.17 ± 0.18 1.19 (0.04) 1.34 ± 0.13a 1.32 (0.04) 1.08
Double support (% GCT) 22.00 ± 4.13 21.43 (0.79) 17.95 ± 2.7a 18.55 (0.81) 1.16
Swing time (% GCT) 39.0 ± 2.08 39.28 (0.40) 41.03 ± 1.36a 40.73 (0.41) 1.15
a
Foot strike angle (degrees) 24.99 ± 3.79 25.16 (0.80) 28.15 ± 2.97 27.97 (0.82) 0.92
Stride time variability (%) 4.03 ± 3.56 4.49 (0.58) 2.32 ± 0.72a 1.84 (0.60) b 0.68
Values are mean ± standard deviation and adjusted mean (Standard error)
PsA Psoriatic arthritis, Adj adjusted mean, SE Standard error, d Cohen’s effect size, GCT gait cycle time
a
Significant differences in mean values between PsA and healthy participants
b
Significant differences in adjusted mean values between PsA and healthy participants
speed-critical values. Patients in PsA1 had gait speed PsA2 and PsA3 represented 32, 41 and 27% of the total
values below 1.0 m/s with a mean gait speed of 0.81 ± sample, respectively.
0.16 m/s; PsA2 included patients with gait speed values
between 1.0 m/s and 1.2 m/s, and the mean gait speed Relationship between STP, gait variability, and clinical
for this subgroup was 1.08 ± 0.05 m/s; and PsA3 was parameters
composed of patients with gait speed values greater than Correlation coefficients between STPs, stride time vari-
1.2 m/s with a mean gait speed of 1.34 ± 0.1 m/s. PsA1, ability and clinical parameters in participants with PsA
Fig. 2 Correlation matrix of the relationships between spatiotemporal parameters, stride time variability and the foot function indexWalha et al. Journal of Foot and Ankle Research (2022) 15:19 Page 8 of 13 are presented in Fig. 2. All the STPs were strongly and and PsA3) are presented in Fig. 3. Participants in PsA1 significantly correlated with the FFI total score and the had the highest scores on all the sub-scales and the total disability sub-score (0.57 < |r| < 0.87, p < 0.006). All the FFI compared to PsA2 and PsA3 (FFI-Total: 62.21 ± STPs except for cadence and gait cycle duration were 11.36% for PsA1, vs 48.68 ± 12.36% and 26.83 ± 11.14% correlated with the pain and activity limitation sub- for PsA2 and PsA3, respectively). Knowing that the min- scores (0.63 < |r| < 0.8, p < 0.006) (Fig. 2). Gait speed had imal clinically important difference (MCID) for the FFI the highest correlation coefficients with the FFI total total score is equal to 7%, the differences in the FFI total score (r = − 0.87) and the disability sub-score (r = − 0.78), scores found between these subgroups were clinically while foot strike angle had the highest correlations with meaningful. the pain sub-score (FFI-Pain) (r = − 0.71). Swing time It was theorized that CRP levels, disease duration, knee (r = − 0.80) had the highest correlations with the activity pain, hip pain, and lower back pain would affect STPs limitation sub-score (FFI-Activity limitation). Regarding and interfere with their relationship with the FFI. How- gait variability, there was no significant correlation be- ever, none of these potential confounders was correlated tween stride time CV and clinical parameters of foot with STPs except for knee pain, which was moderate pain and disability. with foot strike angle (r = − 0.48, p = 0.028), but the The relations between gait speed and the total FFI strength of the relationship did not reach the signifi- score and sub-scores for PsA subgroups (PsA1, PsA2, cance level. Fig. 3 Scatter plots of the relationships between gait speed and the foot function index for PsA subgroups. PsA1 Participants with gait speed below 1.0 m/s, PsA2 participants with gait speed comprised between 1.0 and 1.2 m/s and PsA3 participants with gait speed higher than 1.2 m/s, FFI Foot function index. Δ1 Difference in the FFI total score between PsA2 and PsA3. Δ2 Difference in the FFI total score between PsA1 and PsA2
Walha et al. Journal of Foot and Ankle Research   (2022) 15:19                                                    Page 9 of 13

Discussion                                                       demonstrated. This finding suggests that even though
The aims of this study were first to assess the differences      pharmacological treatments might be efficient on sys-
in gait STPs and gait variability measured with IMUs             temic inflammation control, significant foot pain and re-
during a 10-m walk test between participants with PsA            lated disability can still be present in people with PsA.
and foot pain and age- and sex-matched healthy partici-             Furthermore, clinically important differences in STPs
pants and second to investigate the relationships be-            between PsA and healthy participants and strong corre-
tween gait STPs and variability and clinical outcomes of         lations between foot pain, foot function, and STPs, espe-
foot pain and disability.                                        cially gait speed, were also demonstrated. Interestingly,
                                                                 these correlations were not affected by the CRP levels,
Spatiotemporal parameters                                        disease duration, or lower limb pain since none of these
Our findings showed significant differences in all the           clinical parameters was significantly correlated with STP.
STPs between participants with PsA and matched con-              Although direct comparison between pain levels re-
trols. These differences included lower cadence, gait            ported in Hyslop et al. and those reported in the present
speed, stride length, swing time, and foot strike angle          study cannot be made due to the different measurement
and higher gait cycle duration and double support time           tools used, our findings suggest that foot pain may play
in the PsA group than in the healthy controls. However,          a major role in gait alterations in people with PsA.
only cadence, gait speed, and gait cycle duration                   Based on gait speed values, it was possible to discrim-
remained significantly different after adjusting for BMI.        inate between three PsA subgroups. PsA participants
Nearly 50% of our PsA sample had a BMI above 30 kg/              who had gait speed values below 1.0 m/s had higher FFI
m2, which is not surprising because obesity is a common          scores than those for whom gait speed was between 1.0
comorbidity of PsA [52]. Moreover, obesity is known to           m/s and 1.2 m/s and those with gait speed above 1.2 m/
alter STPs, which has been suggested to be a strategy to         s. There was not enough power to statically test the dif-
lower joint loadings [53]. Therefore, it is logical that         ferences in the FFI scores between these three sub-
BMI affected the differences in STPs between partici-            groups. However, knowing that the MCID for the FFI
pants with PsA and controls in our study.                        total score is 7 points, the results showed that differ-
  A few previous studies showed some alterations in              ences between these gait speed-based subgroups could
STPs in people with PsA, but not all of them demon-              be clinically significant. This suggests that gait speed
strated significant differences between PsA participants         may be a relevant metric not only to assess gait alter-
and healthy controls. It is important to mention that all        ation in people with PsA but also to have more objective
these studies included participants with a younger mean          insight into the impact of the disease on self-reported
age compared to that reported in our study. Of note, in          foot pain and disability.
a recent systematic review, age was shown to have sig-              The results from studies addressing gait STPs in pa-
nificant effects on slowing STPs in healthy adults [30].         tients with RA are coherent with our study. For example,
Thus, the more significant between-group differences             a previous systematic review on gait analysis of the lower
demonstrated in the present study could be attributed to         limb in patients with RA showed that they tend to walk
a combined effect of age and disease. Moreover, in the           slower, with a longer gait cycle, a shorter step length, a
study by Hyslop et al., the participants were matched for        longer double support time, and a lower cadence com-
BMI, which was normal in PsA and control participants            pared to healthy subjects [55]. These findings were con-
[27]. The results reported in our study highlighted the          firmed in a recent meta-analysis that reported a
effects of BMI on STP. Moreover, the impact of obesity           significant decrease in gait speed, stride length, and ca-
on foot function and structure in older adults has been          dence and a significant increase in double support in pa-
demonstrated in a previous study [54]. This suggests             tients with RA compared to healthy participants. Similar
that increased BMI could significantly alter foot function       to the present study, this meta-analysis also reported
and gait in people with PsA which could explain the              large effect sizes for the differences between RA and
nonsignificant differences reported in Hyslop. In                healthy participants (effect sizes (95% CI) were 1.55
addition, in this latter study, even though patients with        (0.83 to 2.27); 1.66 (1.49 to 1.84); 0.97 (0.45 to 1.49)) and
confirmed enthesitis were included, low to moderate              1.01 (0.66 to 1.36) for gait speed, stride length, cadence
levels of foot pain were reported by the authors which           and double support time, respectively [14].
can also help explain their findings. In our study, al-             It appears that walking slower with shorter steps is a
though nearly 90% of the PsA participants were man-              common compensatory strategy that people with arth-
aged on DMARDs/biologicals and most of them had                  ritic foot disease use to reduce loads and pain in the af-
normal CRP levels, a high prevalence of simultaneous             fected joints and to increase stability [53, 56, 57]. It has
forefoot and rearfoot pain and moderate to severe levels         been reported that reducing gait speed leads to lower
of self-reported foot pain and disability were                   joint flexion and extension moments in hip, knee, and
Walha et al. Journal of Foot and Ankle Research (2022) 15:19 Page 10 of 13
ankle joints [58] and that reducing step length allows for and to link gait parameters to clinically relevant domains
a decrease in the vertical ground reaction forces [59– in PsA as determined by the GRAPPA [64].
61]. Moreover, double limb support, in contrast to single Body-worn IMUs for gait analysis are more than ever
limb support and swing (% GCT), is the most stable used in clinical assessment and clinical studies in several
phase during gait, and all these parameters represent the neurological diseases, such as Parkinson’s disease, stroke,
ability of the patient to transfer their body weight to the and multiple sclerosis [65–67]. These systems are easy
affected limb [62]. Our findings, similar to previous to use, time- and cost-effective, do not require special
studies in RA patients, showed a significant increase in equipment or expertise, and could be used in different
double support and a reduction in the swing phase [14]. settings. In addition, recent evidence suggests that they
This suggests that spending more time on both feet could accurately and reliably measure STPs in people
could be an adaptive approach to increase stability and with axial spondyloarthritis and PsA [23, 24]. This study
reduce pain during gait. suggests that body-worn IMUs could be useful to obtain
an objective measure of functional mobility in people
Gait variability with PsA.
Analysis of gait variability is a clinically relevant param- There are some limitations to this study. First, given
eter in the evaluation of gait and responses to interven- the small sample size and the uneven distribution of
tions and is a viable option for the quantitative males and females in our study sample, the findings can-
evaluation of gait stability [21]. To our knowledge, gait not be generalized to the population. Second, the pa-
variability has never been investigated in people with tients were included based on their subjective perception
PsA or other populations with foot involvement associ- of foot involvement. Although from a clinical perspec-
ated with arthritic joint disease. In our study, the mean tive, the patients’ perception of pain and disability is a
stride time variability was higher in the PsA group vital criterion, adding ultrasonography/MRI data to con-
(4.49 ± 3.56%) than in the control group (2.32 ± 0.72%) firm the presence of enthesopathy, tendinopathy, syno-
and above the normative values reported for stride time vitis, and/or bone erosions would have given more
variability (1.1 to 2.6%) [49], indicating increased gait in- insight into the severity of foot involvement. Third, CRP
stability. This is consistent with novel findings from a re- levels were documented from the participant’s clinical
cent study that reported an increased risk of falling in records, which led to missing data and a delay (up to 3
people with PsA [33]. Increased gait variability and in- months in a few participants) between CRP level assess-
stability could be ascribed to pain, muscle weakness, re- ment and data collection. Moreover, important clinical
stricted range of motion, and a decrease in domains, including disease activity, skin disease activity,
proprioception caused by inflammation in the foot joints and fatigue, were not assessed which could significantly
and the surrounding structures [20]. However, there limit the proper description of the study cohort. Add-
were no significant correlations between foot pain and itionally, it is important to mention that gait variability
stride time variability. Findings from a recent study was assessed over a 10-m distance. Ideally, future studies
reporting a significant alteration of static and dynamic should consider longer distances while assessing this
balance in people with PsA also showed that there were metric. Finally, the presence or absence of foot deformity
no correlations between balance parameters, foot pain was recorded in a qualitative manner (presence/ab-
and foot function [32]. This suggests that pain may not sence). Using standardized tools such as the foot posture
be a determinant of gait variability and that this metric index [68] could have been more relevant to ensure
could be accepted as an independent gait parameter that comparability between studies.
should be assessed systematically in people with PsA.
However, this needs to be confirmed in larger and longi- Conclusion
tudinal studies. Further studies are also needed to inves- Foot pain and disability have been reported to be im-
tigate the involvement of muscle weakness, reduced portant manifestations of PsA. This was confirmed in
range of motion, and alterations of the proprioceptive this study since severe levels of foot-related disability
system in gait variability in people with PsA. were reported despite the use of DMARD/biological
This study showed that the disease duration and CRP therapy in more than 80 % of the patients. Disability was
levels were not correlated with self-reported foot pain further demonstrated through the objective assessment
and function, which is consistent with results from a of foot function. The findings showed that STPs ob-
previous study conducted in people with spondyloarthri- tained from IMUs during a standardized 10-m walk test
tis [63]. On the other hand, gait spatiotemporal parame- were significantly altered and that there were strong cor-
ters, especially gait speed, were strongly correlated with relations between pain, disability levels, and STPs. In
these clinical outcomes. It would be relevant to investi- addition, this study demonstrated for the first time in-
gate these associations in larger and longitudinal studies creased gait variability in people with PsA which was notWalha et al. Journal of Foot and Ankle Research (2022) 15:19 Page 11 of 13
correlated with pain levels. This suggests that instability 4. Patience A, Helliwell PS, Siddle HJ. Focussing on the foot in psoriatic
during gait in PsA could be independent of foot pain arthritis: pathology and management options. Expert Rev Clin Immunol.
2018;14(1):21–8. https://doi.org/10.1080/1744666X.2018.1413351.
and that it should be further assessed in larger studies. 5. Wilkins RA, Siddle HJ, Redmond AC, Helliwell PS. Plantar forefoot pressures
The findings of this study add important information on in psoriatic arthritis-related dactylitis: an exploratory study. Clin Rheumatol.
gait in people with PsA, a population for which research 2016;35(9):2333–8. https://doi.org/10.1007/s10067-016-3304-z.
6. Polachek A, Li S, Chandran V, Gladman DD. Clinical Enthesitis in a
on gait and posture is scarce. prospective longitudinal psoriatic arthritis cohort: incidence, prevalence,
characteristics, and outcome. Arthritis Care Res. 2017;69(11):1685–91. https://
Abbreviations doi.org/10.1002/acr.23174.
BMI: Body mass index; CRP: C reactive protein; CV: Coefficient of variation;
7. Turner DE, Hyslop E, Barn R, McInnes IB, Steultjens MPM, Woodburn J.
DMARD: Disease-modifying anti-rheumatic drugs; FFI: Foot function index;
Metatarsophalangeal joint pain in psoriatic arthritis: a cross-sectional study.
GCT: Gait cycle time; MCID: Minimal clinically important difference;
Rheumatol Oxf Engl. 2014;53(4):737–40. https://doi.org/10.1093/rheuma
NRC: Numerical rating scale; PsA: Psoriatic arthritis; STPs: Spatiotemporal
tology/ket435.
parameters; 10MWT: 10-m walk test
8. Kaeley GS, Eder L, Aydin SZ, Gutierrez M, Bakewell C. Dactylitis: a hallmark of
psoriatic arthritis. Semin Arthritis Rheum. 2018;48(2):263–73. https://doi.org/1
Acknowledgments
0.1016/j.semarthrit.2018.02.002.
Not applicable.
9. Carter K, Walmsley S, Chessman D, Rome K, Turner DE. Perspectives of
patients and health professionals on the experience of living with psoriatic
Authors’ contributions
arthritis-related foot problems: a qualitative investigation. Clin Rheumatol.
RW and PB conceived the study. RW collected and analyzed the data and
2019;38(6):1605–13. https://doi.org/10.1007/s10067-018-04411-2.
wrote the first full draft of the manuscript. PB assisted with the analysis of
10. Leung YY, Ogdie A, Orbai A-M, Tillett W, Coates LC, Strand V, et al.
data. PB, PD and NG all reviewed the manuscript drafts. All authors read and
Classification and outcome measures for psoriatic arthritis. Front Med. 2018;
approved the final manuscript.
5:246. https://doi.org/10.3389/fmed.2018.00246.
11. Doi T, Nakakubo S, Tsutsumimoto K, Kim M-J, Kurita S, Ishii H, et al. Spatio-
Authors’ information
temporal gait variables predicted incident disability. J Neuroengineering
Affiliations:
Rehabil. 2020;17(1):11. https://doi.org/10.1186/s12984-020-0643-4.
Faculty of Medicine and Health Sciences, Université de Sherbrooke,
Sherbrooke, QC, Canada. 12. Hyslop E, Woodburn J, McInnes IB, Semple R, Newcombe L, Hendry G, et al.
Roua Walha, Nathaly Gaudreaut, Pierre Dagenais and Patrick boissy. A reliability study of biomechanical foot function in psoriatic arthritis based
Research center on aging, CIUSSS Estrie CHUS, Sherbrooke, QC, Canada. on a novel multi-segmented foot model. Gait Posture. 2010;32(4):619–26.
Patrick Boissy. https://doi.org/10.1016/j.gaitpost.2010.09.004.
13. Turner DE, Helliwell PS, Siegel KL, Woodburn J. Biomechanics of the foot in
Funding rheumatoid arthritis: identifying abnormal function and the factors
This research was funded by The CANADIAN MSK REHAB RESEARCH associated with localised disease “impact”. Clin Biomech Bristol Avon. 2008;
NETWORK, CFI-148081. 23(1):93–100. https://doi.org/10.1016/j.clinbiomech.2007.08.009.
14. Carroll M, Parmar P, Dalbeth N, Boocock M, Rome K. Gait characteristics
Availability of data and materials associated with the foot and ankle in inflammatory arthritis: a systematic
The dataset used and analyzed during the current study is available from review and meta-analysis. BMC Musculoskelet Disord. 2015;16:134.
walha.roua@usherbrooke.ca on reasonable request. 15. Kyrdalen IL, Thingstad P, Sandvik L, Ormstad H. Associations between gait
speed and well-known fall risk factors among community-dwelling older
Declarations adults. Physiother Res Int. 2019;24(1):e1743. https://doi.org/10.1002/pri.1743.
16. Verghese J, Wang C, Holtzer R. Relationship of clinic-based gait speed
Ethics approval and consent to participate measurement to limitations in community-based activities in older adults.
The study was approved by the CIUSSS de l’Estrie-CHUS Ethics Board (2019– Arch Phys Med Rehabil. 2011;92(5):844–6. https://doi.org/10.1016/j.apmr.201
3182), and all the participants gave their informed consent to participate in 0.12.030.
the study. 17. Studenski S, Perera S, Patel K, Rosano C, Faulkner K, Inzitari M, et al. Gait
speed and survival in older adults. JAMA. 2011;305(1):50–8. https://doi.org/1
Consent for publication 0.1001/jama.2010.1923.
Not applicable. 18. Fritz S, Lusardi M. White paper: “walking speed: the sixth vital sign”. J Geriatr
Phys Ther. 2009;32(2):46–9.
Competing interests 19. Middleton A, Fritz SL, Lusardi M. Walking speed: the functional vital sign. J
The authors declare no conflict of interest. The funders had no role in the Aging Phys Act. 2015;23(2):314–22. https://doi.org/10.1123/japa.2013-0236.
design of the study; in the collection, analyses, or interpretation of data; in 20. Hausdorff JM. Gait variability: methods, modeling and meaning. J
the writing of the manuscript; or in the decision to publish the results. NeuroEngineering Rehabil. 2005;2(1):19. https://doi.org/10.1186/1743-
0003-2-19.
Received: 11 September 2021 Accepted: 10 February 2022 21. Hamacher D, Singh NB, Van Dieën JH, Heller MO, Taylor WR. Kinematic
measures for assessing gait stability in elderly individuals: a systematic
review. J R Soc Interface. 2011;8(65):1682–98. https://doi.org/10.1098/rsif.2
References 011.0416.
1. Bezza A, Niamane R, Amine B, El Maghraoui A, Bensabbah R, Hajjaj-Hassouni 22. Hausdorff JM, Rios DA, Edelberg HK. Gait variability and fall risk in
N. Involvement of the foot in patients with psoriatic arthritis. A review of 26 community-living older adults: a 1-year prospective study. Arch Phys Med
cases. Joint Bone Spine. 2004;71(6):546–9. https://doi.org/10.1016/j.jbspin.2 Rehabil. 2001;82(8):1050–6. https://doi.org/10.1053/apmr.2001.24893.
002.06.001. 23. Walha R, Lebel K, Gaudreault N, Dagenais P, Cereatti A, Della Croce U,
2. Nordbø ECA, Aamodt G, Ihlebæk CM. Subjective health complaints in et al. The accuracy and precision of Gait Spatio-temporal parameters
individuals with psoriasis and psoriatic arthritis: associations with the extracted from an instrumented sock during treadmill and Overground
severity of the skin condition and illness perceptions - a cross-sectional walking in healthy subjects and patients with a foot impairment
study. Int J Behav Med. 2017;24(3):438–46. https://doi.org/10.1007/s12529-01 secondary to psoriatic arthritis. Sensors. 2021;21(18):6179. https://doi.
7-9637-4. org/10.3390/s21186179.
3. Hyslop E, McInnes IB, Woodburn J, Turner DE. Foot problems in psoriatic 24. Soulard J, Vaillant J, Balaguier R, Baillet A, Gaudin P, Vuillerme N. Foot-worn
arthritis: high burden and low care provision. Ann Rheum Dis. 2010;69(5): inertial sensors are reliable to assess spatiotemporal Gait parameters in axial
928. https://doi.org/10.1136/ard.2009.111971. Spondyloarthritis under single and dual task walking in axialWalha et al. Journal of Foot and Ankle Research (2022) 15:19 Page 12 of 13
Spondyloarthritis. Sensors. 2020;20(22):6453. https://doi.org/10.3390/s202264 43. Comprehensive Gait and Balance Analysis - APDM Wearable Technologies
53. [Internet]. APDM. 2020 [cited 2021 Jun 18]. Available from: https://apdm.
25. Soulard J, Vaillant J, Agier C-T, Vuillerme N. Gait characteristics in patients com/mobility/
with ankylosing spondylitis: a systematic review. Clin Exp Rheumatol. 2021; 44. Tunca C, Pehlivan N, Ak N, Arnrich B, Salur G, Ersoy C. Inertial sensor-based
39(1):173–86. robust Gait analysis in non-hospital settings for neurological disorders.
26. Soulard J, Vaillant J, Baillet A, Gaudin P, Vuillerme N. Gait and axial Sensors. 2017;17(4):825. https://doi.org/10.3390/s17040825.
Spondyloarthritis: comparative Gait analysis study using foot-worn inertial sensors. 45. Morris R, Stuart S, McBarron G, Fino PC, Mancini M, Curtze C. Validity of
JMIR MHealth UHealth. 2021;9(11):e27087. https://doi.org/10.2196/27087. mobility lab (version 2) for gait assessment in young adults, older adults
27. Hyslop E. Biomechanics of enthesitis of the foot in psoriatic arthritis and Parkinson’s disease. Physiol Meas. 2019;40(9):095003. https://doi.org/10.1
[Internet] [Ph.D.]. Glasgow Caledonian University; 2013 [cited 2021 Oct 16]. 088/1361-6579/ab4023.
Available from: https://ethos.bl.uk/OrderDetails.do?uin=uk.bl.ethos.601641 46. Schmitz-Hübsch T, Brandt AU, Pfueller C, Zange L, Seidel A, Kühn AA, et al.
28. Woodburn J, Hyslop E, Barn R, McInnes IB, Turner DE. Achilles tendon Accuracy and repeatability of two methods of gait analysis - GaitRite™ und
biomechanics in psoriatic arthritis patients with ultrasound proven mobility lab™ - in subjects with cerebellar ataxia. Gait Posture. 2016;48:194–
enthesitis. Scand J Rheumatol. 2013;42(4):299–302. https://doi.org/10.3109/ 201. https://doi.org/10.1016/j.gaitpost.2016.05.014.
03009742.2012.747626. 47. Washabaugh EP, Kalyanaraman T, Adamczyk PG, Claflin ES, Krishnan C.
29. van der Leeden M, Steultjens M, Dekker JHM, Prins APA, Dekker J. The Validity and repeatability of inertial measurement units for measuring gait
relationship of disease duration to foot function, pain and disability in parameters. Gait Posture. 2017;55:87–93. https://doi.org/10.1016/j.gaitpost.2
rheumatoid arthritis patients with foot complaints. Clin Exp Rheumatol. 017.04.013.
2007;25(2):275–80. 48. Salarian A, Russmann H, Vingerhoets FJG, Dehollain C, Blanc Y, Burkhard PR,
30. Herssens N, Verbecque E, Hallemans A, Vereeck L, Van Rompaey V, Saeys W. et al. Gait assessment in Parkinson’s disease: toward an ambulatory system
Do spatiotemporal parameters and gait variability differ across the lifespan for long-term monitoring. IEEE Trans Biomed Eng. 2004;51(8):1434–43.
of healthy adults? A systematic review. Gait Posture. 2018;64:181–90. https:// https://doi.org/10.1109/TBME.2004.827933.
doi.org/10.1016/j.gaitpost.2018.06.012. 49. König N, Taylor WR, Baumann CR, Wenderoth N, Singh NB. Revealing the
31. Amor-Dorado JC, Barreira-Fernandez MP, Llorca J, Gonzalez-Gay MA. quality of movement: a meta-analysis review to quantify the thresholds to
Oculographic, clinical test of sensory integration and balance and pathological variability during standing and walking. Neurosci Biobehav Rev.
computerized dynamic Posturography findings in patients with psoriatic 2016;68:111–9. https://doi.org/10.1016/j.neubiorev.2016.03.035.
arthritis. Otol Neurotol Off Publ Am Otol Soc Am Neurotol Soc Eur Acad 50. Cohen J. Statistical power analysis for the behavioral sciences. 2nd ed. New
Otol Neurotol. 2017;38(3):448–53. https://doi.org/10.1097/MAO. York: Routledge; 1988. 567 p.
0000000000001296. 51. Bohannon RW, Williams AA. Normal walking speed: a descriptive meta-
32. Duruoz MT, Baklacioglu HS, Sanal Toprak C, Gencer Atalay K, Atagunduz MP. analysis. Physiotherapy. 2011;97(3):182–9. https://doi.org/10.1016/j.physio.201
The evaluation of the static and dynamic balance disorders in patients with 0.12.004.
psoriatic arthritis. Rheumatol Int. 2018;38(11):2063–8. https://doi.org/10.1007/ 52. Kumthekar A, Ogdie A. Obesity and psoriatic arthritis: a narrative review.
s00296-018-4137-7. Rheumatol Ther. 2020;7(3):447–56. https://doi.org/10.1007/s40744-020-0021
33. Carter K, Walmsley S, Oliffe M, Hassett G, Turner DE. Increased falls risk in 5-6.
people with psoriatic arthritis-related foot problems: a novel finding. 53. Runhaar J, Koes BW, Clockaerts S, Bierma-Zeinstra SMA. A systematic review
Rheumatol Oxf Engl. 2021;60(2):976–7. https://doi.org/10.1093/rheuma on changed biomechanics of lower extremities in obese individuals: a
tology/keaa654. possible role in development of osteoarthritis. Obes Rev Off J Int Assoc
34. Stanmore EK, Oldham J, Skelton DA, O’Neill T, Pilling M, Campbell AJ, et al. Study Obes. 2011;12(12):1071–82. https://doi.org/10.1111/j.1467-789X.2011.
Risk factors for falls in adults with rheumatoid arthritis: a prospective study. 00916.x.
Arthritis Care Res. 2013;65(8):1251–8. https://doi.org/10.1002/acr.21987. 54. Mickle KJ, Steele JR. Obese older adults suffer foot pain and foot-related
35. Boonstra AM, Stewart RE, Köke AJA, Oosterwijk RFA, Swaan JL, Schreurs functional limitation. Gait Posture. 2015;42(4):442–7. https://doi.org/10.1016/
KMG, et al. Cut-off points for mild, moderate, and severe pain on the j.gaitpost.2015.07.013.
numeric rating scale for pain in patients with chronic musculoskeletal pain: 55. Baan H, Dubbeldam R, Nene AV, van de Laar MAFJ. Gait analysis of the
variability and influence of sex and catastrophizing. Front Psychol. 2016;7: lower limb in patients with rheumatoid arthritis: a systematic review. Semin
1466. https://doi.org/10.3389/fpsyg.2016.01466. Arthritis Rheum. 2012;41(6):768–788.e8.
36. Mills K, Hunt MA, Ferber R. Biomechanical deviations during level walking 56. Mündermann A, Dyrby CO, Hurwitz DE, Sharma L, Andriacchi TP. Potential
associated with knee osteoarthritis: a systematic review and meta-analysis. strategies to reduce medial compartment loading in patients with knee
Arthritis Care Res. 2013;65(10):1643–65. https://doi.org/10.1002/acr.22015. osteoarthritis of varying severity: reduced walking speed. Arthritis Rheum.
37. Bahl JS, Nelson MJ, Taylor M, Solomon LB, Arnold JB, Thewlis D. 2004;50(4):1172–8. https://doi.org/10.1002/art.20132.
Biomechanical changes and recovery of gait function after total hip 57. Valderrabano V, Nigg BM, von Tscharner V, Stefanyshyn DJ, Goepfert B,
arthroplasty for osteoarthritis: a systematic review and meta-analysis. Hintermann B. Gait analysis in ankle osteoarthritis and total ankle
Osteoarthr Cartil. 2018;26(7):847–63. https://doi.org/10.1016/j.joca.2018.02. replacement. Clin Biomech Bristol Avon. 2007;22(8):894–904. https://doi.
897. org/10.1016/j.clinbiomech.2007.05.003.
38. Eitzen I, Fernandes L, Kallerud H, Nordsletten L, Knarr B, Risberg MA. Gait 58. Lelas JL, Merriman GJ, Riley PO, Kerrigan DC. Predicting peak kinematic and
characteristics, symptoms, and function in persons with hip osteoarthritis: a kinetic parameters from gait speed. Gait Posture. 2003;17(2):106–12. https://
longitudinal study with 6 to 7 years of follow-up. J Orthop Sports Phys Ther. doi.org/10.1016/S0966-6362(02)00060-7.
2015;45(7):539–49. https://doi.org/10.2519/jospt.2015.5441. 59. Frederick EC, Hagy JL. Factors affecting peak vertical ground reaction forces in
39. Demirel A, Onan D, Oz M, Ozel Aslıyuce Y, Ulger O. Moderate disability has running. J Appl Biomech. 1986;2(1):41–9. https://doi.org/10.1123/ijsb.2.1.41.
negative effect on spatiotemporal parameters in patients with chronic low 60. Martin PE, Marsh AP. Step length and frequency effects on ground reaction
back pain. Gait Posture. 2020;79:251–5. https://doi.org/10.1016/j.gaitpost.202 forces during walking. J Biomech. 1992;25(10):1237–9. https://doi.org/10.101
0.05.015. 6/0021-9290(92)90081-B.
40. Budiman-Mak E, Conrad KJ, Roach KE. The foot function index: a measure of 61. Debi R, Mor A, Segal O, Segal G, Debbi E, Agar G, et al. Differences in gait
foot pain and disability. J Clin Epidemiol. 1991;44(6):561–70. https://doi.org/1 patterns, pain, function and quality of life between males and females with
0.1016/0895-4356(91)90220-4. knee osteoarthritis: a clinical trial. BMC Musculoskelet Disord. 2009;10(1):127.
41. Agel J, Beskin JL, Brage M, Guyton GP, Kadel NJ, Saltzman CL, et al. https://doi.org/10.1186/1471-2474-10-127.
Reliability of the Foot Function Index: A report of the AOFAS Outcomes 62. Winter DA, Patla AE, Frank JS, Walt SE. Biomechanical walking pattern
Committee. Foot Ankle Int. 2005;26(11):962–7. https://doi.org/10.1177/10711 changes in the fit and healthy elderly. Phys Ther. 1990;70(6):340–7. https://
0070502601112. doi.org/10.1093/ptj/70.6.340.
42. Pourtier-Piotte C, Pereira B, Soubrier M, Thomas E, Gerbaud L, Coudeyre E. 63. Ozaras N, Havan N, Poyraz E, Rezvanı A, Aydın T. Functional limitations due
French validation of the foot function index (FFI). Ann Phys Rehabil Med. to foot involvement in spondyloarthritis. J Phys Ther Sci. 2016;28(7):2005–8.
2015;58(5):276–82. https://doi.org/10.1016/j.rehab.2015.07.003. https://doi.org/10.1589/jpts.28.2005.You can also read