ST. LUCIE COUNTY, FLORIDA - APPENDIX C Economics APRIL 2016 - Jacksonville District
←
→
Page content transcription
If your browser does not render page correctly, please read the page content below
ST. LUCIE COUNTY, FLORIDA

 COASTAL STORM RISK MANAGEMENT PROJECT

DRAFT INTEGRATED FEASIBILITY STUDY AND ENVIRONMENTAL
 ASSESSMENT

 APPENDIX C
 Economics

 APRIL 2016
1. EXECUTIVE SUMMARY

 S t. Lucie County is located on the central-east coast of Florida to the immediate south of Indian
 River County, and the immediate north of Martin County. Portions of St. Lucie County’s 22 mile
 shoreline are subject to erosion caused by both storms and natural shoreline processes. A study
 was undertaken to assess the feasibility of providing Federal Coastal Storm Risk Management
 (CSRM) measures to portions of the county’s shoreline. The local sponsor for this project, St. Lucie
 County, has indicated strong support for feasibility phase studies to address CSRM. They have also
 declared willingness and the capability to share applicable costs in the current study. In accordance with
 appropriate federal guidance, an investigation was performed to estimate the economic benefits of
 alleviating erosion, inundation, and wave-attack damage to coastal infrastructure.

 Alternative Evaluation
 Upon initiation of a preliminary screening, followed by a detailed evaluation of a final array of
 alternatives, the project delivery team has determined a National Economic-Development Plan (NED)
 (i.e. a plan that maximizes net-benefits), and a Tentatively-Selected Plan (TSP) for reducing coastal storm
 and erosion damage to infrastructure. These plans were evaluated using FY2015 price levels and the
 FY2016 federal water resources discount rate of 3.125%. The evaluation covered the span of a 50-year
 period of analysis with a base year of 2020. Alternatives were measured against the criteria of efficiency,
 effectiveness, and acceptability. Refer to Table 1-1 for more detail on the evaluation of the final array of
 alternatives en route to selecting a NED. Benefit values in this table include those derived from land loss
 estimations and incidental recreation benefits. It is important to note that this table represents costs
 and benefits estimated during the alternative evaluation process based on best available information at
 that time. Once the most promising alternatives were established further refinements to both costs and
 benefit models were performed. The refinement results in two of the alternatives, ABerm20DuneEx and
 ABerm30DuneEx, being modeled at a higher level of detail1 and thus final values of costs and benefits
 will vary from those listed in Table 1-1.

 Table 1-1: Alternative Net Benefits & BCRs (Screening-Level Costs)
 Alternative Brief Description Total Costs (AAEQ) Net Benefits (AAEQ) BCR
 Name
 ABerm20DuneEx Existing Dune and 20' $ 1,327,721 $ 767,852 1.58
 sacrificial berm
 ABerm30DuneEx Existing Dune and 30' $ 1,358,477 $ 733,004 1.54
 sacrificial berm
 ABerm40DuneEx Existing Dune and 40' $ 1,356,253 $ 735,194 1.54
 sacrificial berm
 ABERM10DuneEx Existing Dune and 10' $ 1,691,824 $ 401,904 1.24
 sacrificial berm
 Dune10 10' Dune Extension $ 1,926,323 $ 161,395 1.08

 The plan with the highest net benefits (NED) is the project that maintains the current dune and berm
 template while adding 20’ of sacrificial fill (ABerm20DuneEx). The NED plan is also the TSP. Table 1-2

 1
 Additional high-value structures that had been absent from initial modeling were added during this refinement.
 The CSRM benefits provided by the various projects to these structures are absent from Table 1-1.
 1-2 | P a g e
provides a summary of the TSP with and without land-loss and incidental recreation benefits2. Values in
this table reflect all cost and benefit modeling refinements.

 Table 1-23: Economic Summary of the TSP
 STORM STORM DAMAGE
 STORM DAMAGE
 ECONOMIC DAMAGE REDUCTION +
 REDUCTION + LAND-
 SUMMARY REDUCTION LAND-LOSS +
 LOSS BENEFITS
 BENEFITS RECREATION
 Price Level FY16 FY16 FY16
 FY16 Water
 Resources Discount 3.125% 3.125% 3.125%
 Rate
 Average Annual
 Storm Damage $3,179,950 $3,179,950 $3,179,950
 Reduction Benefits
 Average Annual
 $0 $276,819 $276,819
 Land-Loss Benefits
 Average Annual
 $0 $0 $584,018
 Recreation Benefits
 Average Annual
 $3,179,950 $3,456,769 $4,040,787
 Total Benefits
 Average Annual
 $1,925,977 $1,925,977 $1,925,977
 Cost
 Average Annual
 $1,253,973 $1,530,792 $2,114,810
 Net Benefits
 Benefit Cost Ratio 1.65 1.80 2.10

2
 Unlike incidental recreation benefits, land-loss benefits are considered primary benefits in CSRM studies. Both
benefit categories are discussed in detail in sections 4.2 and 4.3.
3
 This table reflects the project after certified costs have been calculated (including the 20% contingency) and with
the addition of high-value structures in reach R115 not present during initial modeling.
 1-3 | P a g e

TABLE OF CONTENTS

1. Executive Summary ............................................................................................................................ 1-2
1. Introduction ....................................................................................................................................... 1-7
2. Existing Conditions ............................................................................................................................. 2-8
2.1 Socio-Economic Conditions ........................................................................................................ 2-8
 2.1.1 Demographic Characteristics ............................................................................................. 2-8
 2.1.2 Economic Characteristics ................................................................................................... 2-8
2.2 Study Area .................................................................................................................................. 2-9
2.3 Data Collection ......................................................................................................................... 2-11
2.4 Existing Condition Coastal Structure Inventory ....................................................................... 2-11
 2.4.1 Structure & Contents Value ............................................................................................. 2-12
 2.4.2 Evacuation Route ............................................................................................................. 2-15
3. Coastal Storm Risk Managment Benefits ......................................................................................... 3-15
3.1 Benefit Estimation Approach Using Beach-fx .......................................................................... 3-16
3.2 Assumptions ............................................................................................................................. 3-17
 3.2.1 Timeframe and Discount Rate ......................................................................................... 3-17
 3.2.2 Rebuilding ........................................................................................................................ 3-18
 3.2.3 Damage Functions............................................................................................................ 3-19
3.3 Future without Project Condition (FWOP)............................................................................... 3-21
 3.3.1 Damage Distribution by Structure Category and Type .................................................... 3-22
 3.3.2 Spatial Distribution of Without Project Damages ............................................................ 3-23
 3.3.3 Damage Distribution by Damage Driving Parameter ....................................................... 3-27
 3.3.4 Temporal Distribution of Damages .................................................................................. 3-27
 3.3.5 Evacuation Route Flooding .............................................................................................. 3-29
 3.3.6 FWOP Damages in Alternative Sea-Level-Rise Scenarios ................................................ 3-30
3.4 FWOP Condition Conclusion .................................................................................................... 3-34
3.5 Future with Project Condition.................................................................................................. 3-34
 3.5.1 Management Measures ................................................................................................... 3-34
 3.5.2 Alternative Development ................................................................................................. 3-35
 3.5.3 Alternative Comparison ................................................................................................... 3-35

 1-4 | P a g e
3.5.4 Performance of NED/TSP in the SLR scenarios ................................................................ 3-37
4. The NED Plan.................................................................................................................................... 4-38
4.1 Project Cost Refinements......................................................................................................... 4-39
4.2 Land-Loss Benefits ................................................................................................................... 4-39
4.3 Incidental Recreation Benefits ................................................................................................. 4-40
4.4 Benefits of the NED Plan .......................................................................................................... 4-47
 4.4.1 Benefits of the NED on Evacuation Route Inundation ..................................................... 4-48
 4.4.2 NED Benefit-Cost Ratio .................................................................................................... 4-49
4.5 Conclusion ................................................................................................................................ 4-49

 THE TABLES…….

Table 1-1: Alternative Net Benefits & BCRs (Screening-Level Costs) ......................................................... 1-2
Table 1-2: Economic Summary of the TSP ................................................................................................. 1-3
Table 2-1: Distribution of Structures & Structure Value by Study Reach ................................................ 2-12
Table 2-2: Economic Value of Structure Inventory by Structure Type .................................................... 2-15
Table 3-1: Distribution of Damages by Damage Category ....................................................................... 3-22
Table 3-2: Distribution of Damages by Category in the SLR scenarios .................................................... 3-30
Table 3-3: AAEQ Damages for Final Array of Alternatives ....................................................................... 3-36
Table 3-4: AAEQ Benefits and Costs for Final Array of Alternatives ........................................................ 3-36
Table 3-5: AAEQ Benefits and Costs for TSP in different SLR Scenarios .................................................. 3-38
Table 4-1: NED Project Cost Refinements (AAEQ) ................................................................................... 4-39
Table 4-2: Current Unit Day Values for Recreation ................................................................................. 4-41
Table 4-3: Total Unit Day Point Scores applied to St. Lucie County......................................................... 4-42
Table 4-4: Criteria Score Comparison in Year 2045 ................................................................................. 4-43
Table 4-5: Beach Visitations ..................................................................................................................... 4-44
Table 4-6: Visitation Constraints .............................................................................................................. 4-46
Table 4-7: Benefits (PV) and % Damage Avoided by Reach ..................................................................... 4-47
Table 4-8: NED Damages by Category (PV) .............................................................................................. 4-47
Table 4-9: Economic Summary of TSP (AAEQ) ......................................................................................... 4-50

 THE FIGURES…………

Figure 2-1: Map of Project Area ............................................................................................................... 2-10
Figure 2-2: Structure Value & Damage Element Distribution by Reach .................................................. 2-14
Figure 3-1: Model Stabilization ................................................................................................................ 3-18

 1-5 | P a g e
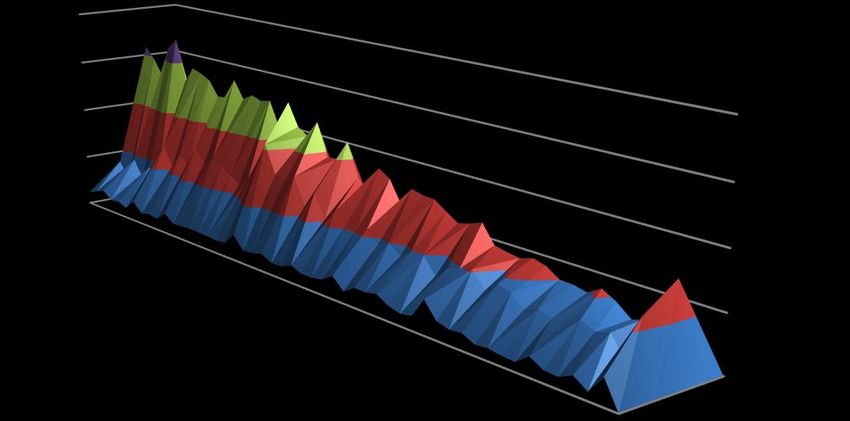
Figure 3-2: Example Damage Function .................................................................................................... 3-20
Figure 3-3: FWOP Present Value Damages by Reach ($ and %) .............................................................. 3-24
Figure 3-4: Spatial Distribution of Damages and Erosion Rates by Model Reach ................................... 3-26
Figure 3-5: Damages Over Time by Combined Reaches (Non-PV$) ........................................................ 3-28
Figure 3-6: Damages Over Time by Reach (PV$)...................................................................................... 3-29
Figure 3-7: Total Damages by SLR Scenario ............................................................................................. 3-30
Figure 3-8: Percent of Total Damages by Driver in the SLR Scenarios ..................................................... 3-32
Figure 3-9: SLR Damages by Model Reach .............................................................................................. 3-33
Figure 3-10: Percent of Lots Condemned in SLR Scenarios ..................................................................... 3-33
Figure 3-11: Alternative Comparisons (AAEQ) ......................................................................................... 3-37
Figure 3-12: TSP BCR Comparison in the SLR Scenarios .......................................................................... 3-38
Figure 4-1: Average Land Lost Each Year ................................................................................................. 4-40
Figure 4-2: Indications of Lower Aesthetic Quality and Damaged Access in the Existing Condition....... 4-43
Figure 4-3: Public Beach Access in Project Footprint............................................................................... 4-46
Figure 4-4: NED Benefits by Year (PV)...................................................................................................... 4-48
Figure 4-5: BCRs with Refined Costs ........................................................................................................ 4-49

 1-6 | P a g e
1. INTRODUCTION
 The purpose of this appendix is to tell the story of the economics investigation and resulting analysis. A detailed explanation of the qualitative
 rigor and the precise modeling efforts, from inputs to outputs, which gave rise to the tentatively-selected plan (TSP) will be provided. The
 subsequent sections will cover the following topics:

 Existing Conditions: Items discussed include an assessment of socio-economic conditions, spatial organization of the study area, and an
 inventory of the coastal infrastructure within the study area.
 Future Without-project Condition (FWOP): The FWOP is a forecast of the economic conditions and structure values located within the
 project area that are subject to the risks associated with coastal processes and coastal storms. The FWOP is the basis for alternative
 comparison in order to obtain the benefits from any potential federal project.
 Coastal Storm Risk Management (CSRM) Benefits: This section will cover the methods and assumptions used to estimate the future
 without-project and future with-project condition using Beach-fx, while also accounting for risk and uncertainty. The future without-project
 condition (FWOP) will cover the distribution of the damages in the following dimensions:
 Spatial (Where)
 Categorization of structures (What)
 Damage driving parameter (How)
 Temporal (When)

 Discussion of the future-with project condition (FWP) will address the management measures and alternative plans evaluated. In addition, a
 sensitivity analysis of how the alternatives perform under varying sea-level rise scenarios is provided.

 NED & TSP Plan Selection and Performance: This section addresses the quantitative analysis executed to determine which alternative
 maximizes national economic development (NED) and which alternative will be the TSP. A detailed description of the performance of the
 NED plan, including certified cost estimates, is provided with the same four dimensions described above in the CSRM section. The
 methodology underpinning the calculation of additional benefits provided by the project (i.e. land-loss benefits, incidental recreation
 benefits) will be summarized as well.

 1-7 | P a g e
2. EXISTING CONDITIONS
 A key step in the planning process is to establish the existing (i.e. current) condition by developing an inventory and characterizing the critical
 resources within the project area. The existing condition is also a key component for forecasting the FWOP, which is described in detail below
 (Section 3.3). All structure and content values presented in this section are in FY2015 price levels.

 2.1 Socio-Economic Conditions
 St. Lucie County is located in the central-east region of Florida and has approximately twenty-two miles of coastline along the Atlantic Ocean.
 The cities comprising the county are Ft. Pierce, Port St. Lucie and the communities of Hutchinson Island and St. Lucie Village. It is also one of four
 counties included in the Research Coast Economic Development Coalition4.

 2.1.1 Demographic Characteristics5
 According to the US Census Bureau, the 2010 population of St. Lucie County was 277,789 with a land area of 571.93 square miles. Over the past
 several years, the county has seen rapid population growth. Between 2000 and 2010 the county grew by approximately 44%. Since then, the
 population has grown by 4.8% to reach an estimated 291,028 in July of 2014.
 The ethnic makeup of St. Lucie County is relatively homogeneous. Caucasians make up approximately 71.8% of the population. The largest
 minority group is African American, which make up approximately 19.1%. All other racial groups comprise less than 10% of the total population.
 The median age for residents is 43.3 and those aged 60 years and over represent 27.4% of the population. Overall, St. Lucie County is largely an
 adult population with those aged 18 years and older at 77.7%.

 2.1.2 Economic Characteristics
 With several notable attractions located within its borders tourism is a critical component of the economy. St. Lucie County is a premier
 recreational fishing destination with a variety of species available for catch. Notably, the International Game Fish Association (IGFA) reports the
 record-setting spotted sea trout catch occurred within county waters (17 lbs. 7 oz., Ft. Pierce). In addition to the miles of pristine beaches and
 nature reserves, the county’s Tradition Field is also host to the New York Mets Major League Baseball team for the entirety of spring training. As
 a result of this influx of tourists St. Lucie County has over 6,000 jobs in the service industry6.

 4
 Research Coast Representatives Promote Region for Business. Vero News. December 7, 2015
 5
 All figures from this section are from source: United States Census Bureau, American Fact Finder. Unless otherwise specified, data references 2010 Census.
 6
 Source: St. Lucie Economic Development Council
 2-8 | P a g e
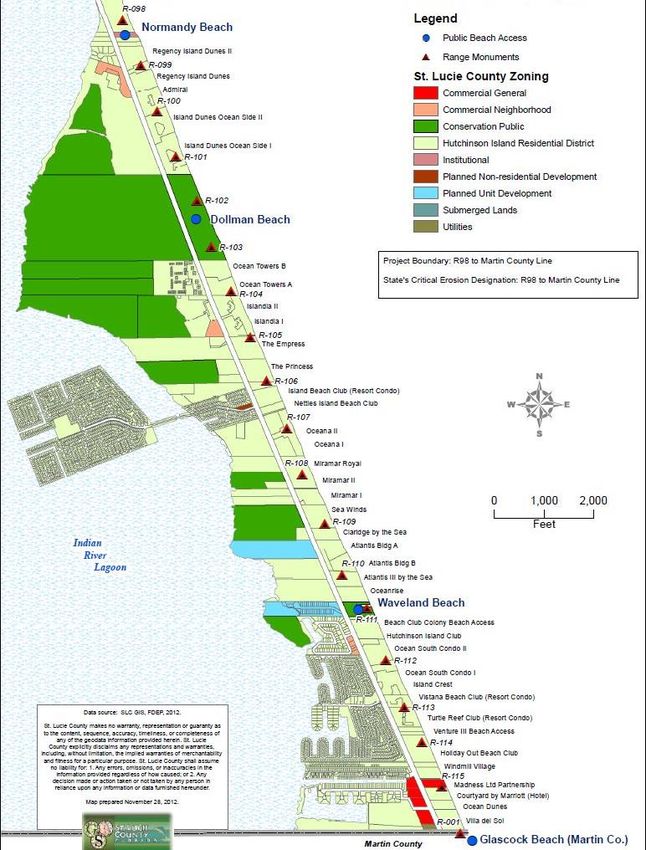
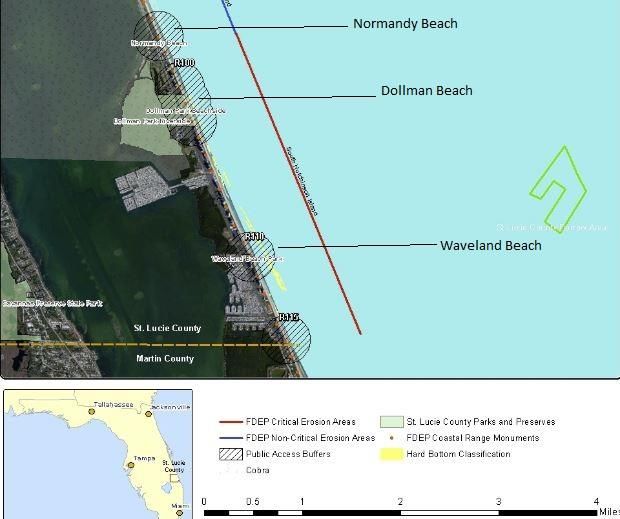
Additionally, agriculture, manufacturing and health care are all important drivers of economic activity in St. Lucie. According to the United States
Department of Agriculture, the county has more than 75,000 acres of crop land between grapes, citrus, and oranges alone7. Manufacturing
accounts for 1,870 jobs and health care an additional 2,89066.

The income trends within St. Lucie County are very similar to that of the state of Florida overall. The following is a summary of those trends from
the most recent year available (2014)8:

 Median Household Income: $42,665
 Per Capita Income: $23,422
 Individuals Below Poverty Line: 14.2%
 Unemployment Rate: 7.5%
 Individuals Receiving Social Security Income: 42.2%
 Individuals with Retirement Income: 22.8%

2.2 Study Area
The initial study area ranged from the Florida Department of Environmental Protection (FDEP) range monument (R) R-077 to R001 (Martin
County line). Four reaches were established within the 7.3 mile span of coastline: The Power Plant, North Hutchinson Island, Narrows of
Hutchinson Island, and South Hutchinson Island. Preliminary modeling indicated that the federal project should focus exclusively on the South
Hutchinson Island reach due to its erosive nature and dense development. Though the power plant represented a potential risk for damages,
heavy existing fortification suggested further measures would prove redundant. As a result, the project area was refined to begin at R098 and
end at R001 as displayed in Figure 2-1. All benefit and cost analysis performed and described in this appendix refer specifically to this project
area.

7
 Source: CropScape – USDA National Agricultural Statistics Service
8
 Source: Us Census Fact Finder 2014
 2-9 | P a g e
Figure 2-1: Map of Project Area

 2-10 | P a g e
2.3 Data Collection
Economists and real estate specialists have collected and compiled detailed structure information for 3.4 miles9 of St. Lucie County’s coastline. In
total, 241 damageable structures were collected for economic modeling using Beach-fx. The structure inventory includes all structures that are
within 500 feet of the mean-high-water line.

Real estate professionals from the USACE Jacksonville District (SAJ), using geo-spatial parcel data from St. Lucie County, provided detailed data
on each structure including: geographic location, structure type, foundation type, construction type, width, length, number of floors,
depreciated replacement value, and year built.

The St. Lucie County study area consists of seven profiles, 18 model reaches, and 61 lots for economic modeling and reporting purposes. This
hierarchical structure is depicted as follows:

 Profiles: Coastal surveys of the shoreline modified by USACE SAJ Coastal Engineering personnel to apply coastal morphology changes to the
 model reach level. Profiles are strictly used for modeling purposes and only referred to in this section for informational purposes. Specific
 information regarding the makeup of the profiles can be found in the Engineering Appendix of this report.
 Beach-Fx Model Reaches: Quadrilaterals parallel with the shoreline used to incorporate coastal morphology changes for transfer to the lot
 level. In this study the model reaches use Florida Department of Environmental Protection (FDEP) range monuments and are inclusive of
 reaches R098-R115 and will be referred to simply as “reaches” throughout this appendix. Figure 2-1 above displays these reaches in the
 project area.
 Lots: Quadrilaterals encapsulated within reaches used to transfer the effect of coastal morphology changes to the damage element. Lots
 also ensure that the model does not overstate damages by placing value parameters around rebuilding (this is discussed further in section
 3.2.2).
 Damage Elements: Represent a unit of coastal inventory in the existing condition and a store of economic value subject to losses from
 wave-attack, inundation, and erosion damages. Damage elements are a primary model input and the topic of focus in the following section.

2.4 Existing Condition Coastal Structure Inventory
Information on the existing economic conditions along the St. Lucie County coastline was collected for economic modeling purposes. The
information on the coastal assets detailed in this section was collected from St. Lucie County mapping resources, site visits, and contractors.

9
 Approximate length from R098-R001
 2-11 | P a g e
Each parcel along the beach was identified as developed or undeveloped, with streets and parks noted. USACE real estate specialists provided
depreciated replacement value of existing structures within the study area.

2.4.1 Structure & Contents Value
The economic value of the existing St. Lucie County structure inventory represents the depreciated replacement costs of damageable structures
(i.e. damage elements) and their associated contents along the coastline. Real Estate professionals from the USACE SAJ district worked together
with economists and planners to provide economic valuations for all of the 241 damageable structures and their contents. These damage elements
have an overall estimated value of $670.2M, with structure and content valuations of $579M and $91M respectively. Content values were
established as a ratio to overall structure value. The ratios were determined by SAJ economists based on available information from St. Lucie
County and best professional judgment. The overall distribution of value by reach is summarized in Table 2-1.

 Table 2-1: Distribution of Structures & Structure Value by Study Reach

 Reach Structure Value Content Value % Total Value # Damage Elements % of Damage Elements
 R098 $ 868,902.27 $ 91,773.15 0.1% 5 2.1%
 R099 $ 70,328,170.49 $ 11,335,908.92 12.2% 18 7.5%
 R100 $ 65,393,014.73 $ 8,938,155.87 11.1% 7 2.9%
 R101 $ 33,292,909.48 $ 4,583,020.93 5.7% 12 5.0%
 R102 $ 510,685.00 $ - 0.1% 2 0.8%
 R103 $ 382,169.00 $ - 0.1% 1 0.4%
 R104 $ 59,638,936.30 $ 8,233,070.10 10.1% 16 6.6%
 R105 $ 50,671,440.86 $ 6,935,733.30 8.6% 12 5.0%
 R106 $ 38,827,603.52 $ 5,262,028.06 6.6% 10 4.1%
 R107 $ 23,131,258.80 $ 3,342,885.26 3.9% 14 5.8%
 R108 $ 67,674,190.47 $ 9,683,230.57 11.5% 16 6.6%
 R109 $ 36,383,413.42 $ 5,941,501.65 6.3% 18 7.5%
 R110 $ 23,862,725.12 $ 3,165,471.52 4.0% 11 4.6%
 R111 $ 26,672,081.83 $ 4,018,669.57 4.6% 20 8.3%
 R112 $ 31,434,921.66 $ 4,406,245.96 5.3% 12 5.0%
 R113 $ 26,669,669.63 $ 6,969,432.38 5.0% 19 7.9%
 R114 $ 1,393,214.69 $ 217,112.45 0.2% 17 7.1%
 R115 $ 22,365,139.75 $ 7,626,234.68 4.5% 31 12.9%

 2-12 | P a g e
Total $ 579,500,447.02 $ 90,750,474.43 100% 241 100%

Despite the relatively uniform distribution of damage element count, the values aggregated by reach show significant variation, with four of the
reaches (R099, R100, R104, R108) accounting for approximately 45% of total value (as demonstrated by the spikes displayed in Figure 2-2). The
variation is due mainly to differentiation between the types of development within the reach. Specifically, reaches with large commercial
structures, such as R113 and R115 with Turtle Reef and Villa Del Sol condominium complexes, tend to contain greater value than neighboring
reaches, such as R102-R103 which is a public conservation area. For modeling and reporting purposes the structure inventory was separated into
four different structure types. Table 2-2 provides a summary of these structure types and the associated inventory values10.

10
 Some of the high-rise structures and other condominiums in the project area are used for commercial activity and many are residential. For economic
modeling purposes the delineation between commercial and residential may differ from that of SAJ real estate appendices. However, the total values of the
structures do not vary and thus represent the same inventory. Most condos and high-rises were deemed commercial for damage aggregation.
 2-13 | P a g e
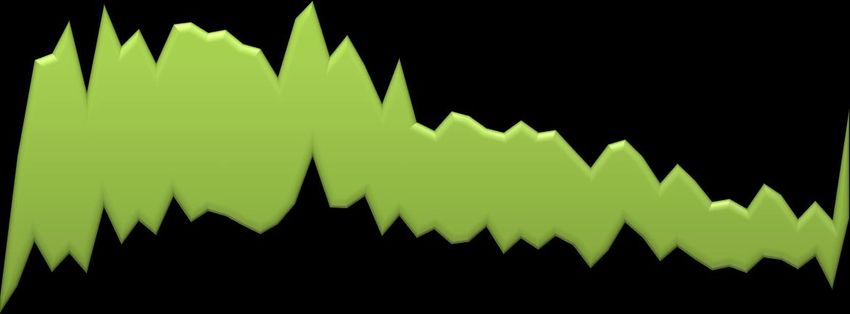
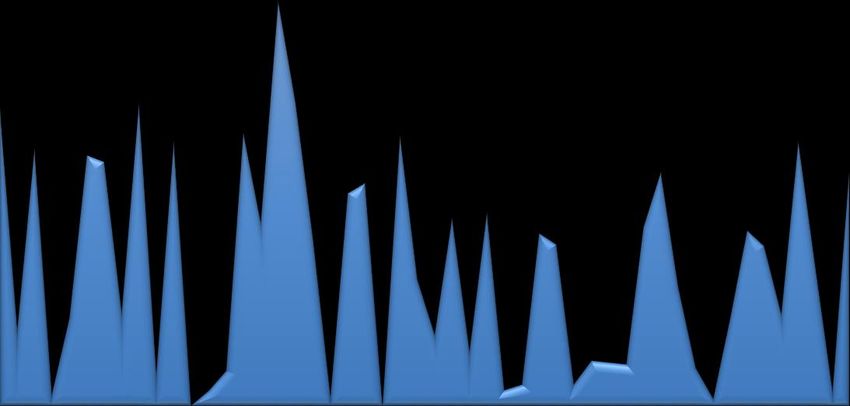
Figure 2-2: Structure Value & Damage Element Distribution by Reach11

 Structure Value & Damage Element Distribution by Reach
 MILLIONS $80.00 14.0%

 $70.00
 12.0%

 $60.00
 10.0%

 $50.00
 8.0%

 $40.00

 6.0%
 $30.00

 4.0%
 $20.00

 2.0%
 $10.00

 $- 0.0%
 R098 R099 R100 R101 R102 R103 R104 R105 R106 R107 R108 R109 R110 R111 R112 R113 R114 R115

 % Total Damage Elements Structure Value Content Value

11
 The percent score on the right axis corresponds with the damage element count, not the damage element dollar value.
 2-14 | P a g e
Table 2-2: Economic Value of Structure Inventory by Structure Type
 Structure Type Structure Value Contents Value Total % of Total Structure Count
 Value
 Commercial $ 557,424,139.88 $ 90,315,788.35 $ 647,739,928.23 96.64% 59
 Other $ 11,071,645.80 $ 52,780.96 $ 11,124,426.76 1.66% 118
 Public $ 10,258,756.90 $ 18,109.26 $ 10,276,866.16 1.53% 62
 Residential $ 745,904.44 $ 363,795.86 $ 1,109,700.30 0.17% 2
 Grand Total $ 579,500,447.02 $ 90,750,474.43 $ 670,250,921.45 100% 241

 2.4.2 Evacuation Route
 The residents of South Hutchinson Island rely heavily on Florida State Road A1A as a means to evacuate during extreme hurricane events.
 Additionally, A1A provides residents with access to, and from, critical infrastructure and services located on the mainland such as fire
 departments, police departments, and hospitals. The project area impacts 3.4 miles of A1A since it parallels the coastline throughout South
 Hutchinson Island. A1A connects residents to the mainland via Northeast Causeway Boulevard to the south and Seaway Drive to the north. Any
 obstruction to A1A in the southern reaches that blocks access to Northeast Causeway Boulevard would result in traffic needing to be rerouted
 approximately 16 miles north to Seaway Drive. All of the nearest hospital services, which are located on the mainland, require clear access to
 A1A. An analysis of flood concerns impacting A1A and how a project ameliorates these effects will be discussed in subsequent sections.

3. COASTAL STORM RISK MANAGEMENT BENEFITS
 This section of the appendix covers the approach used to estimate the economic benefits of reducing hurricane and storm related damages in St.
 Lucie County using Beach-fx. The topics covered include:

 Benefit Estimation Approach Using Beach-fx
 The Future-Without Project Condition (FWOP)
 The Future-With Project Condition (FWP)

 3-15 | P a g e
3.1 Benefit Estimation Approach Using Beach-fx
Beach-fx was developed by the USACE Engineering Research and Development Center in Vicksburg, Mississippi. On April 1, 2009 the Model
Certification Headquarters Panel certified the Beach-fx CSRM model based on recommendations from the Planning Center of Expertise (PCX).
The model was reviewed by the PCX for Coastal and Storm Damage and found to be appropriate for use in CSRM studies. The model links the
predictive capability of coastal evolution modeling with project area infrastructure information, structure and content damage functions, and
economic valuations to estimate the costs and total damages under various shore protection alternatives. The output generated from the model
is then used to determine the benefits of each alternative. As an event-based Monte Carlo life-cycle simulation, Beach-fx fully incorporates risk
and uncertainty. It is used to simulate future hurricane and storm damages at existing and future years and to compute accumulated present-
worth damages and costs. Storm damage is defined as the ongoing monetary loss to contents and structures incurred as a direct result of waves,
erosion, and inundation caused by a storm of a given magnitude and probability. The model also computes permanent shoreline reductions so
that land-loss benefits can be derived exogenously. These damages and associated costs are calculated over a 50-year period of analysis based
on storm probabilities, tidal cycle, tidal phase, beach morphology and many other factors. Beach-fx also provides the capability to estimate the
costs of certain future measures undertaken by state and local organizations to protect coastal assets.

Of course, the abovementioned computations require inputs from USACE personnel in order to function accurately. Data on historic storms,
beach survey profiles, and private, commercial and public structures within the project area are used as these inputs. Refer to sections 2.2 and
2.4 for detailed information on key input data specific to St. Lucie County.

The future structure inventory and values are the same as the existing condition. This conservative approach neglects any increase in value
accrued from future development. Though Florida has historically experienced increases in density and value in real-dollar terms, using the
existing inventory is considered preferable due to the uncertainty involved in projections of future development.

The FWOP damages are used as the base condition and potential project alternatives are measured against this base. The difference between
FWOP and FWP damages will be used to determine primary CSRM benefits.

Once benefits for each of the project alternatives are calculated, they will be compared to the costs of implementing the alternative. Dividing the
total benefits by the total costs of the alternative yields a benefit-to-cost ratio (BCR). This ratio must be greater than 1.0 (i.e. the benefits must
be greater than the costs) in order for the alternative to be justified and implementable. The federally preferred plan, or National Economic
Development Plan (NED) is the plan that maximizes net benefits. Net benefits are determined by simply subtracting the cost of any given
alternative from the benefits of that alternative ( – = ).

 3-16 | P a g e
3.2 Assumptions
Beach-fx accuracy is not only dependent upon inputs but also requires a meticulous level of thought be given to the parameters (i.e.
assumptions) under which the model is bound. This section describes some key assumptions specific to the St. Lucie County CSRM study and the
resulting consequences.

3.2.1 Timeframe and Discount Rate
 Start Year: The year in which the simulation occurs is 2008. In order to ensure that emergency nourishment efforts effected by St. Lucie
 County (completed in May 2013) in response to the 2004 and 2005 hurricane season did not influence the outcome of the ongoing feasibility
 study, it was agreed that the representative FWOP shoreline for the study would be established using survey data collected in the summer
 of 2006. However, subsequent analysis of the data showed that the 2006 survey did not provide adequate foreshore and offshore coverage
 of the project area to complete the Beach-fx analysis. A comparison of the available portions of the 2006 survey and a comprehensive
 shoreline survey taken in August 2008 showed insignificant difference in shoreline dimensions between the two. Therefore, the 2008
 shoreline was determined to be a good representation of the FWOP condition.
 Base Year: The year in which the benefits of a constructed federal project would be expected to begin accruing is 2020.
 Period of Analysis: 50 years
 Discount Rate: 3.125% FY2016 Federal Water Resources Discount Rate
 Iterations: Beach-fx was run using 100 iterations. The moving average of FWOP damages reached equilibrium by this point and was thus
 determined an adequate number of iterations. Figure 3-1 demonstrates the model achieving equilibrium as the moving average does not
 vary by more than two percent after the 65 iteration.

 3-17 | P a g e
Figure 3-1: Model Stabilization
 40.00%

 PERCENT CHANGE FROM PREVIOUS ITERATION (RED)
 $90,000,000.00

 30.00%
 MOVING AVERAGE PV DAMAGES (BLUE)

 $80,000,000.00

 $70,000,000.00
 20.00%
 $60,000,000.00 Model Reaches
 Equilibrium 10.00%
 $50,000,000.00

 $40,000,000.00 0.00%

 $30,000,000.00
 -10.00%
 $20,000,000.00
 -20.00%
 $10,000,000.00

 $- -30.00%
 1 4 7 10 13 16 19 22 25 28 31 34 37 40 43 46 49 52 55 58 61 64 67 70 73 76 79 82 85 88 91 94 97 100
 ITERATION

3.2.2 Rebuilding
The rebuilding parameter within Beach-fx allows the economic modelers to restrict the amount of monetary investment allocated to structural
repair for any specific building type in order to most accurately reflect real-world behavior. Rebuilding does not refer to a total rebuild event (i.e.
100% of structure value), but rather a repair event (i.e. some non-zero percent of value intended to restore the structure). Allowing for an
unlimited amount of rebuilding in the period of analysis may be unrealistic for a CSRM study and can potentially overstate damages in the
FWOP. However, issuing emergency permits for rebuilding on lots meeting a minimal setback restriction is generally the rule, not the exception

 3-18 | P a g e
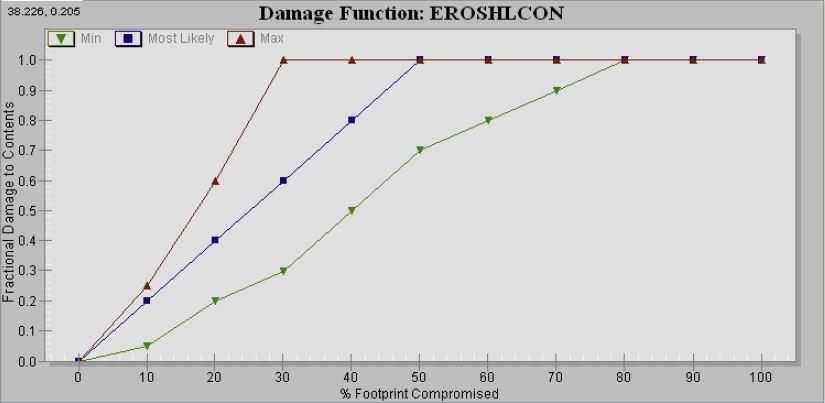
in Florida. Common practice and historical evidence also show that rebuilding lost structures, provided setback restrictions are met, occurs
frequently12. As a result, the number of rebuilds within the model has been limited to reflect this behavior as follows:

 Number of Times Rebuilding Allowed Assumptions
 Public Access Structures13: 124X
 Commercial Recreation Facilities14: 62X
 Remaining: 31X

Additionally, after long-term erosion has claimed more distance on the oceanfront lot than the building requires, the model ceases to reinstate
the same property. The model also considers a lot “condemned” once 50%15 of the total value of that lot is damaged. These assumptions will
continue to prevent overestimation of the FWOP damages while allowing for realistic rebuilding to occur.

3.2.3 Damage Functions
Damage functions are used within the model to determine the extent of storm-induced damages attributable to any specific combination of
damage element type, foundation type, and construction type. There are a total of six types of damage function which include erosion damages,
inundation damages, and wave damages for both contents and structure. The functions are completely user-definable within the model and
transfer damages to the individual damage elements. Damage is determined as a percentage of overall structure or content value using a
triangular distribution (minimum, most likely, maximum). The range of percentage points used for the damage is determined by parameters
dependent upon which function is being triggered. For erosion it is dependent upon the extent to which the structure’s footprint has been
compromised and inundation and wave-attack are dependent upon storm-surge heights in excess of first-floor elevation. An example diagram of
how these damage functions operate is provided by Figure 3-2.

12
 Reference Florida Office of General Counsel order 12-1453 and 12-1264 as examples.
13
 Examples of public access structures include dune walks, shelters, guard shacks and roads.
14
 Examples of commercial recreation facilities include pools, parking areas, and tennis courts.
15
 This amount, the lot condemnation ratio, can be manipulated within the model as needed but is set to 50% for this study
 3-19 | P a g e
Figure 3-2: Example Damage Function

For the vast majority of aforementioned combinations within this study the damage functions used were those developed by the Institute for
Water Resources (IWR), within the Coastal Storm Damage Workshop (CSDW), Coastal Storm Damage Relationships Based on Expert Opinion
Elicitation in 2002. However, the various high-rise buildings located within the project area proved to be the exception since the IWR wave-
damage function did not adequately address these structures. Using empirical evidence on the performance of high-rise structures during major

 3-20 | P a g e
hurricanes16 it was conservatively assumed that wave-attack damages would likely only affect the lower floors. As a result, the high-rise
structures were separated into three categories:

 HIGHRISE1: Maximum of 6-10 floors
 HIGHRISE2: Maximum of 11-14 floors
 HIGHRISE3: Maximum of 16-20 floors

Once separated, a relationship between the structure value and maximum number of floors was established to create the triangular distribution
of values for the model to accurately calculate wave-attack damages.

3.3 Future without Project Condition (FWOP)
Descriptive statistics on the damages per the FWOP model results are as follows:

 Mean: PV $82,844,425 (AAEQ~ $3,296,624)
 Standard deviation: $65,241,923 (AAEQ~ $2,596,167)
 Coefficient of Variance: .79
 Median: $81,015,316 (AAEQ~ $3,223,834)

The nearness in value between the mean and standard deviation indicates some volatility of the FWOP damage incurred in the project area
throughout the 100 iterations. This volatility is due to the fact that damages are primarily driven by storm occurrence and severity rather than
annual erosion rates. In short, St. Lucie County’s shoreline structures are highly susceptible to storm damage in the FWOP.
Pursuant to estimating FWOP damages and associated costs for the study area in St. Lucie County, Beach-fx was used to estimate damages and
costs in the following categories:

 Damages:
 Structure Damage: Economic losses resulting from the structures situated along the coastline being exposed to wave attack,
 inundation, and erosion damages. Structure damages account for 71% of the damages for the FWOP.
 Contents Damage: The material items housed within the structures (usually air-conditioned and enclosed) that are potentially subject
 to damage. Content damages are 29% of the total damages.

16
 Sources: FEMA Mitigation Assessment Team Report for Hurricane Katrina (July 2006) and Hurricane Sandy (November 2013)
 3-21 | P a g e
3.3.1 Damage Distribution by Structure Category and Type
This section addresses what is being damaged in the FWOP by structure category and type. The coastal inventory was categorized as
‘Commercial’, ‘Public Access & Recreation’, and ‘Residential’. Table 3-1 provides greater detail on the type of structures within each category as
well as the composition of the FWOP damages within those categories. The distribution of the damages by category is as follows:

 Commercial: 87.34%
 Public Access & Recreation Structures: 12.57%
 Residential: .09%
 Table 3-1: Distribution of Damages by Damage Category
 Category Type Structure Contents Total % of Total
 Commercial BUILDING-1 $ 45,678,775.25 $ 23,331,162.27 $ 69,009,937.53 83.30%
 COMM-1 $ 20,144.20 $ 8,382.24 $ 28,526.45 0.03%
 HIGHRISE-1 $ 778,118.18 $ 113,309.67 $ 891,427.85 1.08%
 HIGHRISE-2 $ 988,656.23 $ 137,557.45 $ 1,126,213.67 1.36%
 HIGHRISE-3 $ 1,153,621.63 $ 149,471.28 $ 1,303,092.91 1.57%
 Commercial Subtotal $ 48,619,315.50 $ 23,739,882.91 $ 72,359,198.41 87.34%

 Public Access & Recreation Structures DECK $ 397,772.57 $ 0.00 $ 397,772.57 0.48%
 DUNEWALK $ 6,266,873.05 $ - $ 6,266,873.05 7.56%
 GARAGE $ 36,932.06 $ 27,635.02 $ 64,567.09 0.08%
 GARAGE-U $ 216,293.46 $ 108,146.73 $ 324,440.19 0.39%
 GUARDSHACK $ 10,475.47 $ 1,467.47 $ 11,942.94 0.01%
 PARKING $ 799,913.17 $ - $ 799,913.17 0.97%
 PATIO $ 931.85 $ - $ 931.85 0.00%
 POOL $ 2,042,506.32 $ - $ 2,042,506.32 2.47%
 POOLHEATER $ 511.98 $ - $ 511.98 0.00%
 PUBLIC-1 $ 2,005.33 $ 281.73 $ 2,287.06 0.00%
 SHELTER $ 495,528.63 $ - $ 495,528.63 0.60%
 STORAGE $ 1,912.19 $ 1,185.56 $ 3,097.75 0.00%
 ROAD-1 $ 104.94 $ - $ 104.94 0.00%
 TENNIS $ 455.24 $ - $ 455.24 0.00%
 PA & Rec Subtotal $ 10,272,216.27 $ 138,716.52 $ 10,410,932.79 12.57%

 Residential MFR-3 $ 15,407.32 $ 4,329.99 $ 19,737.32 0.02%
 SFR-3 $ 32,676.90 $ 21,879.63 $ 54,556.52 0.07%
 Residential Subtotal $ 48,084.22 $ 26,209.62 $ 74,293.84 0.09%
 GRAND TOTAL $ 58,939,615.99 $ 23,904,809.05 $ 82,844,425.04 100%

 3-22 | P a g e
3.3.1.1 Commercial
The St. Lucie shoreline is dotted with various commercial real estate subject to damage. The structures are primarily condominium complexes or
large hotels and represent nearly three-quarters of all the damages in the FWOP. Again, some of these condominiums may be used primarily as
permanent residences and thus deemed residential in real estate appendices. However, for purposes of economic damage aggregation the
delineation between condominiums was not made and they are deemed commercial.

3.3.1.2 Residential
The only two varieties of residential structures in the project area are three-story multi-family residences (MFR-3 in Table 3-1) and three-story
single-family residences (SFR-3 in Table 3-1). The damage incurred to these structures is paltry and makes up less than one percent of overall
damages.

3.3.1.3 Public Access and Recreation Structures
A public access structure refers to those that provide the general public with safe access to beaches and shorelines throughout St. Lucie County
which include, but are not limited to, roads, dune walks, public shower and bathroom facilities, and life-guard stations. A recreation structure
refers to items such as pools, patios and tennis courts.

3.3.2 Spatial Distribution of Without Project Damages
FWOP damages really spike in the southern portion of St. Lucie’s shoreline. Reaches R113-R115 make up around 84% of the damages, while the
remainder are relatively evenly distributed; R098 and R100-R103 are the only reaches that account for less than one-percent of damages each.
R115 accounts for the lion’s share of total damage at 60% due in large part to several groups of valuable condominium complexes situated very
near the dune that are on slab foundations instead of deep-pile. Structures on slab foundation are far more susceptible to damages from erosion
than those with a deep-pile foundation and their location in the nearshore further compounds the damage risk. The spatial damage results are
summarized in Figure 3-3.

 3-23 | P a g e
Figure 3-3: FWOP Present Value Damages by Reach ($ and %)
 $60.00 60.00%

MILLIONS $50.00 50.00%

 $40.00 40.00%

 $30.00 30.00%

 $20.00 20.00%

 $10.00 10.00%

 $- 0.00%
 R098 R099 R100 R101 R104 R105 R106 R107 R108 R109 R110 R111 R112 R113 R114 R115

 % of Total (Right Axis) $ Damage (PV) (Left Axis)

 3-24 | P a g e
Figure 3-4 illustrates the spatial distribution of damages and erosion rates17 by reach. Similar to Figure 3-3 above, Figure 3-4 displays minor
damages until R107 and then the spikes at R113 and R115. The spatial distribution of erosion and damage shows the following pattern:

 R098-R101: This stretch has the highest erosion rates averaging .89 ft./year but relatively low damages at around 3% of the total.
 R099 is the main driver of damages in this range due to the presence of condominium complexes in the nearshore environment.
 R102-R103: There are no damages occurring in these two reaches. This is primarily due to the fact that there are only two
 damageable elements in these reaches and they are set back far enough from the shoreline to avoid all damages. Also, erosion rates
 are minimal and R103 sees annual accretion versus erosion.
 R104: Despite having the highest level of accretion in the project area this reach still incurs a fair amount of damage. The average
 annual accretion is offset by the value and high density of structures susceptible to storm-based damages within the reach (roughly
 seven-percent of total damage elements, refer to previous Figure 2-2).
 R105-R112: Erosion rates begin to rise throughout these southern reaches and culminate in a secondary peak of .66 ft./year at R112.
 Despite the increasing erosion rates, the damages are fairly smooth in this area and hover around the average for all reaches
 excluding outliers (R113 and R115).
 R113-R115: In these final reaches the erosion rate is stable and very near the mean. Again, the spike in damages is driven almost
 entirely by the many structures on slab foundations in the nearshore.

17
 Negative erosion rates indicate areas of annual accretion
 3-25 | P a g e
Figure 3-4: Spatial Distribution of Damages and Erosion Rates by Model Reach

 Ft/Year
 $50 1.5
MILLIONS

 $45
 1.3

 $40
 High damages
 despite 1.1

 $35 moderate
 erosion due to
 high-value 0.9
 $30

 $25 0.7

 $20
 0.5

 Area of
 $15
 average
 annual 0.3

 $10 accretion

 0.1
 $5

 $- -0.1
 R098 R099 R100 R101 R102 R103 R104 R105 R106 R107 R108 R109 R110 R111 R112 R113 R114 R115
 Average Erosion Rate (Ft/Yr) $ Damage (PV)

 3-26 | P a g e
3.3.3 Damage Distribution by Damage Driving Parameter
It is very typical for Florida CSRM studies to find that most damages are due to erosion. St. Lucie is no
exception as virtually all of the FWOP damages are attributable to erosion. The distribution of damages
is as follows:

 Erosion: 95.06%
 Inundation: 4.28%
 Wave Attack: .67%

3.3.4 Temporal Distribution of Damages
Damages remain relatively constant on a yearly basis throughout the 50 year period of analysis in non-
present value.
Figure 3-5 illustrates the damages over time by condensed reaches18 in non-present value. In years
2037-2043 there are a series of small spikes in damages and that pattern continues throughout the
remaining years culminating in a final peak in 2069. The pattern brings to light the frequent vulnerability
of the St. Lucie shoreline to the powerful effects of storms and hurricanes. Figure 3-6 displays similar
information but converts the damages into present value (PV). As would be expected due to the effects
of discounting, the damages peak in the relative near-term (2024). However, it is important to note that
despite this discounting, damages remain relatively high in the final half of the project lifecycle as the
cumulative effects of storms and erosion take their toll on shoreline structures.

18
 For graphical display purposes the reaches were grouped as R098-R107, R108-114, and R115. R102 and R103
were not displayed as damages remain at zero throughout the project life.

 3-27 | P a g e
Figure 3-5: Damages Over Time by Combined Reaches (Non-PV$)

 Damages by Year by Reach (Non PV)
$2,500,000.00

$2,000,000.00

$1,500,000.00

$1,000,000.00

 $500,000.00

 $-
 2020
 2022
 2024
 2026
 2028
 2030
 2032
 2034
 2036
 2038
 2040
 2042
 2044
 2046
 2048
 2050
 2052
 2054
 2056
 2058
 2060

 R115
 2062
 2064

 R108-R114
 2066
 2068
 R098-R107
 $- - $500,000.00 $500,000.00 - $1,000,000.00 $1,000,000.00 - $1,500,000.00
 $1,500,000.00 - $2,000,000.00 $2,000,000.00 - $2,500,000.00

 3-28 | P a g e
Figure 3-6: Damages Over Time by Reach (PV$)

 Damages Over Time by Combined Reaches (PV$)
 $2,000,000.00

 $1,500,000.00

 $1,000,000.00

 $500,000.00

 $-
 2020
 2023
 2026
 2029
 2032
 2035
 2038
 2041
 2044
 2047
 2050
 2053
 2056
 2059
 2062

 2065

 R115
 R108-R114
 2068
 R098-R107
 $- - $500,000.00 $500,000.00 - $1,000,000.00
 $1,000,000.00 - $1,500,000.00 $1,500,000.00 - $1,800,000.00

3.3.5 Evacuation Route Flooding
As described in section 2.4.2 Florida State Route A1A is South Hutchinson Island’s hurricane evacuation
route and provides vital access to critical infrastructure and services. Of additional importance, the
Centers for Disease Control report that each year more deaths occur due to flooding than from any
other thunderstorm related hazard and half of those fatalities occur when a vehicle is driven into
hazardous flood water. The National Weather Service (NWS) reports that just 12 inches of rushing water
can carry away a small car and two feet can sweep away most vehicles.

In order to gauge the potential impact of flooding on Florida State Route A1A Beach-fx was adjusted to
model two different scenarios with the statistics from the NWS used as a framework. In the first
scenario, all damage element types were assigned a null damage function except inundation damages to
A1A. In order to gauge the depth of flooding all damages were set to zero until inundation reached one
foot. In this model scenario, 53% of iterations experienced one foot or more of flooding at some point in
the 50 year period of analysis. One of the southern reaches, R112, is flooded in 48% of the iterations.
The importance of the southern reaches is as mentioned above in section 2.4.2; an impassable A1A to
the south could result in traffic needing to be rerouted approximately 16 miles during evacuations.

 3-29 | P a g e
The second scenario followed the exact same methodology but damages were set to zero until
inundation on A1A reached two feet. In this scenario 36% of iterations experienced two or more feet of
flooding. Again, R112 was consistently inundated, having two or more feet in 32% of iterations.

This flooding represents a potential hazard to all residents of Hutchinson Island both within and outside
of the project area boundaries. There are no alternative roads that run north to south and attempting to
navigate flood waters in depths of one foot or more can prove to be fatal.

3.3.6 FWOP Damages in Alternative Sea-Level-Rise Scenarios
Evaluating sea-level rise (SLR) is a vital component in the planning process to ensure alternatives are
selected based on risk-informed analysis. To incorporate risk into the analysis the FWOP must be run
assuming three distinct future rates of SLR. EC 1165-2-211 provides both a methodology and a
procedure for determining a range of SLR estimates based on the local historic rate, the construction
(base) year of the project, and the design life of the project. In St. Lucie County the average baseline
(SLR1), intermediate (SLR2) and high (SLR3) rates were found to be 0.0077 feet/year, 0.0163 feet/year,
and 0.0439 feet/year, respectively. The Beach-fx results that were presented above refer strictly to SLR1,
which is based on the historic rate. The results comparing the SLR scenarios are presented here. Figure
3-7 provides an overall summary of damages in each SLR scenario and includes a trend line;
Table 3-2 shows how those damages are distributed amongst the different structure types.

 Figure 3-7: Total Damages by SLR Scenario
 $506
 MILLIONS

 $500

 $400

 $300 $259

 $200

 $100 $83

 $-
 Base Damages Intermediate Damages High Damages

 Table 3-2: Distribution of Damages by Category in the SLR scenarios
 Category Type SLR1 SLR2 SLR3
 BUILDING-1 $ 69,009,937.53 $ 166,358,715.68 $ 200,645,580.17
 COMM-1 $ 28,526.45 $ 7,821,856.78 $ 16,414,768.69
 Commercial HIGHRISE-1 $ 891,427.85 $ 19,470,428.79 $ 27,098,889.72
 HIGHRISE-2 $ 1,126,213.67 $ 12,475,838.55 $ 65,796,836.01
 HIGHRISE-3 $ 1,303,092.91 $ 19,962,504.08 $ 144,157,930.84
 Commercial Subtotal $ 72,359,198.41 $ 226,089,343.88 $ 454,114,005.42

 Public Access & Recreation Structures DECK $ 397,772.57 $ 893,619.02 $ 732,285.90

 3-30 | P a g e
DUNEWALK $ 6,266,873.05 $ 10,193,506.27 $ 6,826,516.32
 GARAGE $ 64,567.09 $ 1,181,339.52 $ 6,191,787.65
 GARAGE-U $ 324,440.19 $ 2,477,054.75 $ 4,263,194.90
 GUARDSHACK $ 11,942.94 $ 56,403.06 $ 95,976.84
 PARKING $ 799,913.17 $ 3,414,166.33 $ 9,847,325.43
 PATIO $ 931.85 $ 214,891.88 $ 1,044,060.20
 PAVED $ - $ 7,965.17 $ 35,053.97
 POOL $ 2,042,506.32 $ 11,662,156.01 $ 18,503,718.23
 POOLHEATER $ 511.98 $ 45,903.90 $ 96,284.91
 PUBLIC-1 $ 2,287.06 $ 120,708.98 $ 169,874.17
 SHELTER $ 495,528.63 $ 1,082,077.97 $ 1,265,867.67
 STORAGE $ 3,097.75 $ 60,277.05 $ 101,741.83
 ROAD-1 $ 104.94 $ 3,099.01 $ 8,024.79
 ROAD-2 $ - $ 2,893.50 $ 124,222.17
 ROAD-3 $ - $ 314,501.78
 TENNIS $ 455.24 $ 65,332.72 $ 230,355.22
 PA & Rec Subtotal $ 10,410,932.79 $ 31,481,395.13 $ 49,850,791.99

 MFR-3 $ 19,737.32 $ 138,012.93 $ 269,313.60
 Residential
 SFR-3 $ 54,556.52 $ 1,017,657.63 $ 1,267,168.30
 Residential Subtotal $ 74,293.84 $ 1,155,670.56 $ 1,536,481.90
 GRAND TOTAL $ 82,844,425.04 $ 258,726,409.57 $ 505,501,279.31

The SLR results are intuitive in the sense that one would expect damages to be positively correlated with
water levels (i.e. as water levels increase throughout the project life so do damages). What is important
to note, however, is the magnitude of the effect. From SLR1 to SLR2 the difference was a mere .0086
ft./year in average SLR and resulted in an increase of roughly 212%, or $175.9 million, worth of
damages. From SLR2 to SLR3 there was a .0276 ft./year average rise with a corresponding increase of
95%, or $246.8 million, in damages. From SLR1 to SLR3 damages increase over 510%.

There is also an interesting shift in what drives the damages in each scenario. As mentioned in section
3.3.3 above, it is very common for erosion to be the main cause of damages in Florida CSRM studies.
However, as sea levels rise, inundation begins to take on more of the share of damages. By SLR3,
damages caused by erosion have fallen from 95% to 51% with inundation accounting for most of the
difference; coastal overstep is reducing the propensity for erosion. Figure 3-8 displays the changing
trend in how damages are occurring.

 3-31 | P a g e
Figure 3-8: Percent of Total Damages by Driver in the SLR Scenarios

 SLR Damages by Driver (%)

 0.7%
 4% 2% 1%
 100%

 90% 21%

 80% 48%

 70%

 60%

 50% 95%

 77%
 40%

 30% 51%

 20%

 10%

 0%
 Base Intermediate High

 Erosion Innundation Wave Attack

Coastal overstep is also causing an increasing number of lots to be determined condemned within the
model and is shifting damage hot spots into areas that are more susceptible to flooding. Reaches 104-
108 begin to see a larger increase in damages as high-value structures are increasingly inundated (Figure
3-9). In SLR1 there are very few condemned lots during any period of the project lifecycle. However, in
SLR2 19% of lots are determined condemned at some point in the lifecycle and 48% in SLR3 (see Figure
3-10). Not only does this maintain the assertion that St. Lucie County is highly susceptible to storm
damage but also demonstrates how critical a project would be in mitigating damages in the event sea
levels continue to rise above and beyond baseline projections.

 3-32 | P a g e
You can also read