Statistical standard
for geographic areas 2023
←
→
Page content transcription
If your browser does not render page correctly, please read the page content below
Statistical standard for geographic areas 2023
Crown copyright ©
See Copyright and terms of use for our copyright, attribution, and liability statements.

Citation
Stats NZ (2022). Statistical standard for geographic areas 2023. Retrieved from www.stats.govt.nz.

ISBN 978-1-99-104917-9 (online)

Published in December 2022 by
Stats NZ Tatauranga Aotearoa
Wellington, New Zealand

Contact
Stats NZ Information Centre: info@stats.govt.nz
Phone toll-free 0508 525 525
Phone international +64 4 931 4600

www.stats.govt.nz
Statistical standard for geographic areas 2023

Contents
Introduction ..................................................................................................................... 5
    Purpose .................................................................................................................................. 5
    Background ............................................................................................................................ 5

Classification criteria ......................................................................................................... 6
    Target population size ........................................................................................................... 6
    Boundaries relatable to the user ........................................................................................... 6
    Boundaries visible on the ground .......................................................................................... 6
    Compact shape ...................................................................................................................... 6
    Stable over time ..................................................................................................................... 6
    Additional criteria .................................................................................................................. 6

Definitions ........................................................................................................................ 8
    Statistical geographies ........................................................................................................... 8
    Administrative and electoral areas ........................................................................................ 8
    Analytical geographies ........................................................................................................... 9
    New Zealand .......................................................................................................................... 9

Statistical geography hierarchy........................................................................................ 11
    Meshblock............................................................................................................................ 11
    Statistical area 1 (SA1) ......................................................................................................... 12
    Statistical area 2 (SA2) ......................................................................................................... 13
    Statistical area 3 (SA3) ......................................................................................................... 16
    Urban-rural geographies...................................................................................................... 20

Analytical geographies .................................................................................................... 28
    Grids ..................................................................................................................................... 28

Administrative areas ....................................................................................................... 29
    Local government administrative areas .............................................................................. 29
    Electoral areas ..................................................................................................................... 30
    Wards, general wards, and Māori wards ............................................................................. 31
    Other administrative boundaries ........................................................................................ 32

Operational issues .......................................................................................................... 34
    Changes to statistical geographies ...................................................................................... 34
    Changes to local government boundaries ........................................................................... 35
    Changes to electoral boundaries ......................................................................................... 35

                                                                             3
Statistical standard for geographic areas 2023
Glossary.......................................................................................................................... 36
Appendix: Differences between NZSAC92 and SSGA23 ..................................................... 39
References...................................................................................................................... 43
List of tables and figures
List of tables
Table 1. SA3s that don’t align with regional council boundaries .......................................................... 17
Table 2. Treatment of small population islands ................................................................................... 18
Table 3. Treatment of non-digitised SA2s............................................................................................. 19
Table 4. Urban accessibility categories ................................................................................................. 26
Table 5. Urban accessibility indicator classification.............................................................................. 27
Appendix table 1. Differences between NZSAC92 and SSGA23 ........................................................... 39
List of figures
Figure 1. Statistical, electoral, administrative, and analytical geographies.......................................... 10
4Statistical standard for geographic areas 2023
Introduction
Purpose
Statistical standard for geographic areas 2023 (SSGA23) replaces the 2018 standard (SSGA18), which
was published as Statistical standard for geographic areas 2018.
The statistical standard for geographic areas is to be used from 2023. It defines the Stats NZ input
and output geographic classifications, describes their primary purposes, and sets out requirements
and guidelines for the creation and maintenance of statistical geographies.
Background
All data collected, statistical or otherwise, must be referenced to both time and place. Place can be
any geographic reference, for example, the whole of New Zealand, a region, a town, or a lake.
Identifying and classifying places into statistical geographies allows users of statistics to see not just
how data varies but also where it varies.
The SSGA23 is Stats NZ’s official standard for statistical geographic areas in New Zealand. It allows
statistical units, such as households, people, or businesses, to be assigned to the location where they
live, work, and operate. It enables the production of integrated statistics by geographic area. It
provides a range of geographic units that are convenient for data collection, compilation, and output
and are useful for spatial analysis of social, demographic, and economic statistics.
Stats NZ encourages the use of the SSGA23 by other organisations to improve the comparability and
usefulness of statistics generally.
This is the first five-yearly update of the SSGA18 where there have been significant changes in
concepts and statistical areas from the previous New Zealand Standard Areas Classification 1992
(NZSAC92). The SSGA update policy is to undertake ongoing (annual) meshblock maintenance and
carry out a comprehensive update of higher-level geographies before each five-yearly population
and housing census. Changes are kept to a minimum in intervening years to minimise the need to
rebase data that uses statistical geographies.
The SSGA23 has been updated to include new geographies developed since 2018, including:
• statistical area 3 (SA3)
• functional urban area (FUA)
• urban accessibility (UA)
• population grids.
The statistical geographies are available in the 2023 annual Geographic boundaries files release.
Stats NZ would like to thank central and local government organisations, community groups, and
individuals for their valuable contribution to the 2023 update.
5Statistical standard for geographic areas 2023
Classification criteria
The SSGA23 is designed to meet user needs for social, demographic, and economic statistics.
As such, the geographies:
• are useful and relevant for data dissemination at different resolutions
• can be aggregated into larger contiguous units
• are useful building blocks for creating user-defined geographies.
Meshblocks, statistical areas, and urban/rural areas are statistically defined according to these
criteria and principles.
Target population size
The population size of statistical areas should be reasonably consistent to ensure comparability.
Geographies should have a minimum and maximum population threshold, and the range should be
minimised as much as possible. The population size of the geographic area should be balanced
between releasing detailed information and considering privacy and confidentiality, to ensure that
robust statistical outputs can be produced. Near-zero areas (that is, areas with few residents) are
appropriate if they fulfil other criteria.
Boundaries relatable to the user
Geographies should represent a ‘community of place’ where people interact together socially and
economically.
Boundaries visible on the ground
Boundaries should follow dividing features, such as rivers, roads, railway lines, and lakes. This assists
in describing the extent of the statistical area. An area should ideally represent a single land use,
such as the built-up environment, farmland, forests, or wilderness areas.
Compact shape
The statistical area should be compact and have contiguous boundaries to provide flexible and
relevant building block geographies for users and assist with data visualisation.
Stable over time
The boundaries of higher-level geographies should remain stable, where possible, to allow the
comparison of data over time. However, when the population distribution changes, geographies
should be updated to reflect such changes. Boundaries of the smallest geographies should be
regularly maintained to reflect real world changes, such as new subdivisions and motorways.
Additional criteria
Additionally, statistical geographies should:
• be well defined, using objective criteria
• be mutually exclusive and therefore not overlap
6Statistical standard for geographic areas 2023
• be comprehensive, covering the whole area to which the classification applies
• separate land and water (where possible)
• separate urban and rural areas (where possible)
• align to territorial authority and regional council boundaries
• have clear, objective maintenance criteria and plans that specify criteria for changing
boundaries.
7Statistical standard for geographic areas 2023
Definitions
The SSGA23 classification structures are split into three broad groups:
• geographies built directly from meshblocks:
o statistical geographies
o administrative and electoral areas
• grid based geographies not built from meshblocks:
o analytical geographies.
Statistical geographies
The statistical geographies form a hierarchy of geographic areas whose boundaries are specifically
created according to well-defined concepts. In total, they cover the whole geographic New Zealand.
The boundaries align with territorial authority and regional council boundaries, with a few minor
exceptions. The statistical geographies are statistical rather than legal classifications and include:
• meshblock
• statistical area 1 (SA1)
• statistical area 2 (SA2)
• statistical area 3 (SA3)
• urban rural, including
o functional urban area (FUA)
o urban accessibility (UA).
The statistical geographies are defined and maintained by Stats NZ.
Statistical geography hierarchy below provides more information.
Administrative and electoral areas
Central and local government administrative and electoral boundaries were established in legislation
under the Local Government Act 2002 and the Electoral Act 1993. They are defined by the Local
Government Commission and the Representation Commission. Administrative and electoral areas
include:
• regional council
o constituency
o Māori constituency
• territorial authority
o ward, general ward, and Māori ward
o community board / local board
o subdivision
• general electoral district
• Māori electoral district.
8Statistical standard for geographic areas 2023
Local government administrative areas and Electoral areas below provide more information.
Analytical geographies
The Stats NZ grid framework is a new geography, approved in 2022, that has been included in the
SSGA23 to provide users with a data product that is analysis-ready for spatial, geostatistical, and
visualisation applications. The basic geographic unit is a grid cell of three resolutions – 1 kilometre,
500 metres, and 250 metres.
Analytical geographies below provide more information.
New Zealand
For statistical purposes, the term ‘New Zealand’ refers to geographic New Zealand, that is, North
Island, South Island, Stewart Island / Rakiura, and the Chatham Islands, plus the Kermadec Islands,
the Auckland Islands, the Subantarctic Islands (Campbell Island / Motu Ihupuku, Antipodes Islands,
Bounty Islands, and Snares Islands / Tini Heke), and the Ross Dependency.
The North and South Islands, Stewart Island / Rakiura, and Chatham Islands are digitised according
to the New Zealand Transverse Mercator 2000 standard projection for general mapping in New
Zealand. The other islands are not digitised but are included in the statistical geographies to provide
complete coverage of geographic New Zealand.
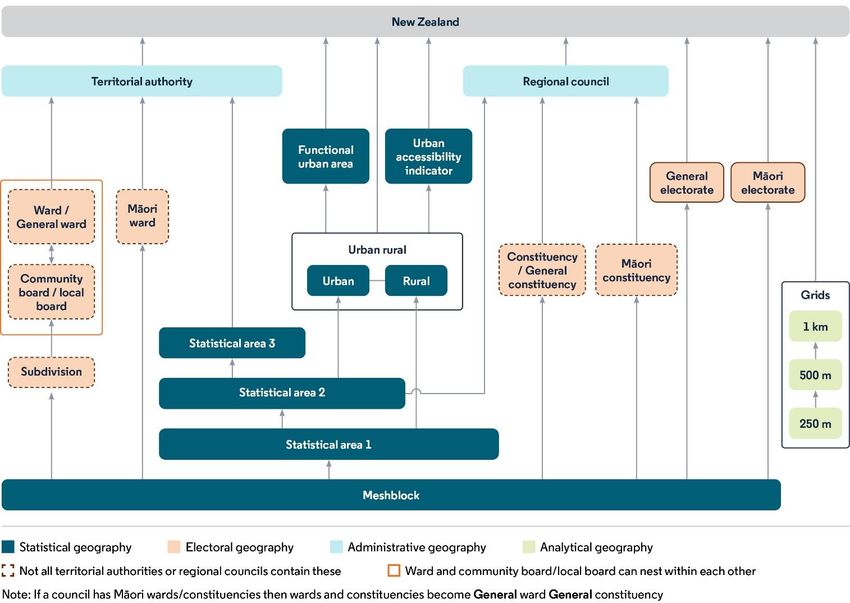
Figure 1 shows how New Zealand’s SSGA23 geographies relate to each other.
9Statistical standard for geographic areas 2023
Figure 1
Statistical, electoral, administrative, and analytical geographies
Figure 1. Statistical, electoral, administrative, and analytical geographies
10Statistical standard for geographic areas 2023
Statistical geography hierarchy
The statistical geography hierarchy has four levels:
• meshblock
• statistical area 1 (SA1)
• statistical area 2 (SA2)
• statistical area 3 (SA3).
Meshblock is the smallest geographic unit for which statistical data is reported by Stats NZ and forms
the basis of New Zealand’s electoral system and local government administration.
Statistical area geographies are aggregations of meshblocks optimised to be of similar population
sizes to enable the release of multivariate data. They are non-administrative areas that sit between
meshblocks and territorial authorities in size. Statistical areas either define or aggregate to define
urban rural areas, territorial authorities, and regional councils.
There are three urban rural geographies:
• urban rural (UR)
• functional urban area (FUA)
• urban accessibility (UA).
The UR is designed to align with SA2s in urban areas and SA1s in rural and water areas. The UR
boundaries also nest within the territorial authority and regional council administrative geographies,
with one exception for the Richmond urban area in the Tasman District, which includes one SA2
from the Nelson City Council area.
The FUA offers a broader definition of urban to include the rural hinterland, or peri-urban areas,
surrounding larger urban areas. The UA classifies rural areas according to their accessibility to or
remoteness from urban areas.
Meshblock
Definition
A meshblock is the smallest geographic unit for which statistical data is reported by Stats NZ. A
meshblock is a defined geographic area, which can vary in size from part of a city block to a large
area of rural land. Each meshblock borders another to form a network covering all New Zealand,
including coasts and inlets and extending to the 200-nautical-mile exclusive economic zone (EEZ),
and is digitised to the 12-nautical-mile limit. Meshblocks are added together to form larger
geographic areas, such as SA1, SA2, SA3, and urban rural areas. They are also used to define
electoral districts, territorial authorities, and regional councils.
Meshblock boundaries generally follow road centre lines, cadastral property boundaries or
topographical features such as rivers. Expanses of water in the form of lakes and inlets are defined
separately from land.
11Statistical standard for geographic areas 2023
The primary purposes of the meshblock classification are:
• to provide a small, relevant, and flexible building-block geography for aggregation into other
statistical geographies
• to ensure geographic boundaries can be physically identified and located on the ground by
alignment with geographic or physical features, or with the cadastre
• to stand as the lowest-level building block, to form the basis of New Zealand’s electoral
system, by which it defines electorates and polling areas for both parliamentary and local
government elections.
As the lowest-level building block, the meshblock classification is primarily an input geography that
supports the electoral system, survey enumeration, and higher-level geographies. Statistical outputs
are limited to single variables, such as census population and dwelling counts, to which
confidentiality rules are applied to prevent disclosing information about individuals living in sparsely
populated areas.
Population size
The optimal size for a meshblock is 30–60 dwellings (containing approximately 60–120 residents).
• When a meshblock exceeds 80 dwellings, it is reviewed for splitting.
• Meshblocks should be no larger than 120 dwellings (unless they contain a large apartment
block or other multi-dwelling building).
• Some meshblocks will be zero population, for example, water or high-country meshblocks.
Classification
The meshblock classification is a flat classification, and in 2023, contains 57,539 meshblocks –
57,523 digitised and 16 non-digitised. It is released annually on 1 January, and occasionally mid-year,
but there are not always changes from the previous classification.
Meshblocks have seven-digit codes but are not named. When meshblocks are split, each new
meshblock is given a new code. The original meshblock codes no longer exist within the new and
future versions of the meshblock classification. Meshblock codes do not change when a meshblock
boundary is nudged.
Meshblocks that existed before 2015 and have not changed are numbered from 0000100 to
3210003. Meshblocks created from 2015 onwards are numbered from 4000000.
Statistical standard for meshblock sets out requirements and guidelines for creating and maintaining
the meshblock classification and Stats NZ’s responsibilities for maintaining the standard.
Classifications: Meshblock provides more information.
Statistical area 1 (SA1)
Definition
The main purpose of the SA1 geography is to provide an output geography that allows the release of
more low-level data than is available at the meshblock level. Built by joining meshblocks, SA1s have
12Statistical standard for geographic areas 2023
an ideal size range of 100–200 residents and a maximum population of about 500. This is to
minimise suppression of population data in multivariate statistics tables.
The SA1 should:
• form a contiguous cluster of one or more meshblocks
• be either urban, rural, or water in character
• be small enough to:
o allow flexibility for aggregation to other statistical geographies
o allow users to aggregate areas into their own defined communities of interest
• form a nested hierarchy with statistical output geographies and administrative boundaries. It
must:
o be built from meshblocks
o either define or aggregate to define SA2s, SA3s, urban rural areas, territorial authorities,
and regional councils.
Population size
SA1s generally have a population of 100–200 residents, with some exceptions.
• SA1s with zero or nominal resident populations are created to represent remote mainland
areas, unpopulated islands, inland water, inlets, or oceanic areas.
• Some SA1s in remote rural areas and urban industrial or business areas have fewer than
100 residents.
• Some SA1s that contain apartment blocks, retirement villages, and large residential facilities
(prisons, boarding schools, etc) have more than 500 residents.
Classification
The SA1 classification is a flat classification and, in 2023, contains 33,164 SA1s (33,148 digitised and
16 non-digitised). The SA1 classification is released annually on 1 January, and occasionally mid-year,
but there are not always changes from the previous classification.
SA1s are not named. SA1 codes have seven digits starting with a ‘7’ and are numbered
approximately north to south. As new SA1s are created, they are given the next available numeric
code. If the composition of an SA1 changes through splitting or amalgamating different meshblocks,
the SA1 is given a new code. The previous code no longer exists within that and future versions of
the SA1 classification.
Classifications: Statistical area 1 provides more information.
Statistical area 2 (SA2)
Definition
The main purpose of the SA2 geography is to provide an output geography for higher aggregations
of population data than can be provided at the SA1 level. The SA2 geography aims to reflect
13Statistical standard for geographic areas 2023
communities that interact socially and economically. In populated areas, SA2s generally contain
similar-sized populations.
The SA2 should:
• form a contiguous cluster of one or more SA1s
• (excluding the exceptions below for small population SA2s) allow the release of data in
multivariate statistics tables with minimal data suppression
• capture a similar type of area, such as a high-density urban area, farmland, wilderness area, or
water area
• be socially homogeneous and capture a community of interest (For example, it may have:
o a shared road network
o shared community facilities
o shared historical or social links
o socio-economic similarity.)
• form a nested hierarchy with statistical output geographies and administrative boundaries. It
must:
o be built from SA1s
o either define or aggregate to define SA3s, UR areas, territorial authorities, and regional
councils.
In larger urban areas, an SA2 often approximates a single suburb or part of a larger suburb. A small
urban area containing up to 5,000 residents may be represented by a single SA2. In rural areas, rural
settlements are included in their respective SA2 with the surrounding rural area.
Population size
SA2s in city council areas generally have a population of 2,000–4,000 residents, while SA2s in district
council areas generally have a population of 1,000–3,000 residents.
SA2s in urban areas where there is significant business and industrial activity, for example ports,
airports, or industrial, commercial, and retail areas, often have fewer than 1,000 residents. These
SA2s are useful for analysing business demographics, labour markets, and commuting patterns.
In rural areas, many SA2s have fewer than 1,000 residents because they are in conservation areas or
cover large areas that have sparse populations, for example, Fiordland.
Stewart Island / Rakiura and Chatham Islands are represented by separate SA2s. Waiheke Island
comprises six SA2s.
To ensure that the SA2 geography covers all New Zealand and aligns with New Zealand’s topography
and local government boundaries, some SA2s have zero or nominal populations. These types of SA2s
are described below.
14Statistical standard for geographic areas 2023
Zero or nominal population SA2s
Alignment with territorial authority and regional council boundaries
In rural areas where territorial authority boundaries straddle regional council boundaries, SA2s have
been created to maintain the statistical geography and administrative area hierarchy. These SA2s,
which each have fewer than 200 residents are: Arahiwi, Tiroa, Rangataiki, Kaimanawa, Taharua, Te
More, Ngamatea, Whangamomona, and Mara. Their locations within territorial authorities and
regional councils are shown below in table 1: SA3s that don't align with regional council boundaries.
Island SA2s
To minimise suppression of population data, small islands with zero or low populations close to the
mainland are generally included in their adjacent land-based SA2.
However, SA2s have been created for single islands or groups of islands that are some distance from
the mainland or to separate large unpopulated islands from urban areas. These SA2s are:
• Three Kings Islands
• Barrier Islands (includes Great Barrier Island (Aotea Island), Te Hauturu-o-Toi / Little Barrier
Island, and other nearby islands)
• Gulf Islands (includes Motutapu, Rangitoto, and other islands in the Hauraki Gulf / Tīpaka
Moana)
• Islands Thames-Coromandel District
• Islands Bay of Plenty Region (Mōtītī Island, Mayor Island / Tūhua, Moutohora Island, and
Whakaari / White Island)
• Matakana Island
• Kapiti Island
• Mana Island
• Islands Tasman District (Best Island, Bell Island, and Moturoa / Rabbit Island)
• Bare Island (in the Hawke’s Bay region but outside the territorial authority area)
• Motunau Island (in the Canterbury Region but outside the territorial authority area).
Water SA2s
SA2s with zero or nominal resident populations designed to represent inland water, inlets, or
oceanic areas include:
• inland lakes larger than 50 square kilometres (lakes smaller than 50 square kilometres are
included with the surrounding land SA2)
• harbours larger than 40 square kilometres
• major ports: Eastland (Gisborne), Taranaki, Napier, Lyttelton, Timaru, Oamaru
• other non-contiguous inlets and harbours, defined by territorial authority
• contiguous oceanic areas, defined by regional council.
To minimise suppression of population data, separate meshblocks/SA1s have been created for
marinas so that they can be attached to their adjacent land-based SA2.
15Statistical standard for geographic areas 2023
Non-digitised SA2s
SA2s for non-digitised oceanic areas, offshore oil rigs, islands, and the Ross Dependency are shown
in table 3: Treatment of non-digitised SA2s below.
Each of these SA2s are represented by a single meshblock.
Classification
The SA2 classification is a flat classification and in 2023 contains 2,395 SA2s (2,379 digitised and
16 non-digitised). It is released annually on 1 January, and occasionally mid-year, but there are not
always changes from the previous classification.
Each SA2 is a single geographic entity with a name and a numeric code. The name refers to a
geographic feature or a recognised place name or suburb. In some instances where place names are
the same or very similar, the SA2s are differentiated by their territorial authority name, for example,
Gladstone (Carterton District) and Gladstone (Invercargill City). Names are provided with and
without tohutō (macrons).
SA2 codes have six digits. North Island SA2 codes start with a 1 or 2, and South Island SA2 codes start
with a 3. They are numbered approximately north to south within their respective territorial
authorities. To ensure the north–south code pattern is maintained, the SA2 codes were given 00 for
the last two digits when the geography was created in 2018. When SA2 names or boundaries change
only the last two digits of the code will change. For example, in 2023:
• SA2 (2018) 135800 Ōwairaka East boundaries were realigned to coincide with territorial
authority local board (TALB) boundaries and renumbered SA2 (2023) 135801 Ōwairaka East
• SA2 (2018) 12370 Castor Bay was split into SA2 (2023) 123701 Castor Bay North and 123702
Castor Bay South to meet SA2 size criteria
• SA2 (2018) 220500 Cape Egmont was renamed SA2 (2023) 220501 Parihaka.
Classifications: Statistical area 2 provides more information.
Statistical area 3 (SA3)
Definition
Statistical area 3 (SA3) is a new output geography, introduced in 2023, that allows aggregations of
population data between the SA2 geography and territorial authority geography.
The SA3 geography aims to meet three purposes. These are to:
• represent suburbs in major, large, and medium urban areas
• in predominantly rural areas, provide geographical areas that are larger in area and
population size than SA2s but smaller than territorial authorities
• minimise data suppression.
Population size
The requirement for SA2s to have similar-sized populations (2,000–4,000 in larger urban areas and
1,000–3,000 in smaller urban areas and rural areas) limits the ability to represent ‘communities of
16Statistical standard for geographic areas 2023
place’. SA3s in major, large, and medium urban areas have been created by combining SA2s to
approximate suburbs as delineated in the Fire and Emergency NZ Localities dataset.
Some of the resulting SA3s have very large populations, the largest being Papatoetoe, with an
estimated resident population of 50,320 at 30 June 2021.
Outside major, large, and medium urban areas, SA3s generally have populations of 5,000–10,000.
Some SA3s are a combination of small urban area SA2s and rural SA2s, for example:
• a small urban area with 5,000–10,000 residents, such as SA3 61910 Alexandra, which contains
the two Alexandra urban SA2s of Alexandra North and Alexandra South
• a small urban area with more than 5,000 residents plus surrounding ‘rural’ SA2(s), such as SA3
54810 Marton, which includes the two Marton urban SA2s (Marton North and Marton South)
and Marton Rural SA2
• a combination of one or more small urban areas with less than 5,000 residents and SA2s
containing rural settlements and other rural areas, such as SA3 50860 Waitākere West, which
includes the rural settlements of Piha, Waitākere Village, Huia, Karekare, and surrounding
rural areas.
Stewart Island / Rakiura and Chatham Islands are represented by separate SA3s. The six Waiheke
Island SA2s are combined into one SA3 for Waiheke Island, with a combined population of just under
10,000.
To minimise the amount of unsuppressed data that can be provided in multivariate statistical tables,
SA2s with fewer than 1,000 residents are combined with other SA2s wherever possible to reach the
1,000 SA3 population target. However, there are still many SA3s with zero or nominal populations.
Their treatment is described below.
Zero or nominal population SA3s
Alignment with territorial authority and regional council boundaries
Small population SA2s designed to maintain alignment between territorial authority and regional
council geographies are merged with other SA2s to reach the 5,000–10,000 SA3 population target.
These merges mean that some SA3s do not align with regional council boundaries but are aligned to
territorial authority. The treatment of these SA2s and their resulting SA3s are shown in table 1.
Table 1
SA3s that don’t align with regional council boundaries
Table 1. SA3s that don’t align with regional council boundaries
Statistical area 2 Regional council Territorial authority Statistical area 3
Arahiwi Waikato Region Rotorua District Rotorua District South
Tiroa Manawatū-Whanganui Region Waitomo District Waitomo District Rural
Rangataiki Bay of Plenty Region Taupo District Taupo District South
Kaimanawa Waikato Region Taupo District Taupo District South
Taharua Hawke's Bay Region Taupo District Taupo District South
Te More Manawatū-Whanganui Region Taupo District Taupo District South
Ngamatea Hawke's Bay Region Rangitikei District Rangitikei District North
Whangamomona Manawatū-Whanganui Region Stratford District Stratford District Rural
Mara Wellington Region Tararua District Tararua District Other
17Statistical standard for geographic areas 2023
Island SA3s
To minimise suppression of population data, small islands with zero or low populations close to the
mainland are generally included in their adjacent land-based SA2/SA3.
The allocation of zero or nominal population island SA2s to SA3s is shown in table 2.
Table 2
Treatment of small population islands
Table 2. Treatment of small population islands
Statistical area 2 Regional council Territorial authority Statistical area 3
1. Island SA2s joined with other SA2s in the SA3 geography
Gulf Islands Auckland Region Auckland Hibiscus and Bays Rural
Islands Thames- Waikato Region Thames-Coromandel Mercury Bay
Coromandel District District
Matakana Island Bay of Plenty Region Western Bay of Plenty Western Bay of Plenty
District District North
Kapiti Island Wellington Region Kapiti Coast District Kapiti Coast District Coast
Mana Island Wellington Region Porirua City Porirua City Rural
Islands Tasman District Tasman Region Tasman District Moutere Coast
2. Island SA2s outside territorial authority or region are the same in the SA3 geography
Three Kings Islands Area Outside Region Area Outside Region Three Kings Islands
Islands Bay of Plenty Bay of Plenty Region Area Outside Territorial Islands Bay of Plenty
Region Authority Region
Bare Island Hawke's Bay Region Area Outside Territorial Bare Island
Authority
Motunau Island Canterbury Region Area Outside Territorial Motunau Island
Authority
Water SA3s
To minimise the number of SA3s, inland water SA2s are aggregated and named by territorial
authority, as in the urban rural classification.
Similarly, inlet SA2s are aggregated and named by territorial authority or regional council where the
water area is outside the territorial authority.
Oceanic SA2s translate directly to SA3s as they are already aggregated to regional council.
To minimise suppression of population data, separate meshblocks have been created for marinas so
that they can be attached to their adjacent land-based SA2/SA3.
Non-digitised SA3s
To minimise the number of SA3s, non-digitised SA2s are aggregated as in the urban rural
classification, shown in table 3.
18Statistical standard for geographic areas 2023
Table 3
Treatment of non-digitised SA2s
Table 3. Treatment of non-digitised SA2s
Statistical area 2 Statistical area 3/UR
New Zealand Economic Zone Oceanic outside region
Oceanic Kermadec Islands Oceanic outside region
Oceanic Campbell Island Oceanic outside region
Oceanic Auckland Islands Oceanic outside region
Oceanic Bounty Islands Oceanic outside region
Oceanic Snares Islands Oceanic outside region
Oceanic Antipodes Islands Oceanic outside region
Oceanic Oil Rig Southland Oceanic oil rigs
Oceanic Oil Rig Taranaki Oceanic oil rigs
Kermadec Islands Islands outside region
Campbell Island Islands outside region
Auckland Islands Islands outside region
Bounty Islands Islands outside region
Snares Islands Islands outside region
Antipodes Islands Islands outside region
Ross Dependency Ross Dependency outside region
Classification
The SA3 classification is a flat classification and, in 2023, contains 929 SA3s – 925 digitised and
4 non-digitised. It is released annually on 1 January, and occasionally mid-year, but there are not
always changes from the previous classification.
Each SA3 is a single geographic entity with a name and a numeric code. The name refers to a suburb,
recognised place name, or portion of a territorial authority. In some instances where place names
are the same or very similar, the SA3s are differentiated by their territorial authority, for example,
Hillcrest (Hamilton City) and Hillcrest (Rotorua District). Names are provided with and without
tohutō (macrons).
SA3 codes have five digits. North Island SA3 codes start with a 5, and South Island SA3 codes start
with a 6. The codes are numbered approximately north to south within their respective territorial
authorities. When first created in 2023, the last digit of each code was 0. When SA3 boundaries
change in future, only the last digit of the code will change to ensure the north-south pattern is
maintained.
Classifications: Statistical area 3 provides more information.
19Statistical standard for geographic areas 2023
Urban-rural geographies
There are three urban-rural geographies:
• urban rural (UR)
• functional urban area (FUA)
• urban accessibility (UA).
The UR classifies New Zealand into areas that share common urban or rural characteristics. It is a
form-based geography, that is, urban and rural areas are delineated by what you can see on the
ground. It is used to present a range of Stats NZ population and demographic statistics and estimate
the percentage of residents living in urban areas.
The FUA offers a broader definition of ‘urban’ by adding the surrounding rural hinterland to larger
urban areas.
The UA groups small urban areas and rural SA1s according to their proximity to larger urban areas.
Appendix: Differences between NZSAC92 and SSGA23 summarises the differences between the
three urban-rural geographies.
Urban rural New Zealand, the Stats NZ’s story map, describes urban rural concepts in more detail.
Urban rural (UR)
The UR separately identifies urban areas, rural settlements, other rural areas, and water areas. The
urban areas represent densely developed spaces and encompass residential, commercial, and other
non-residential urban land uses. Rural settlements, other rural areas, and bodies of water represent
areas not included within an urban area.
The UR indicator (IUR) classifies urban, rural, and water areas by type. Urban areas are classified by
population size; rural areas are classified as rural settlements or rural other; and water areas are
classified as inland water, inlet, or oceanic.
Urban areas and rural settlements are form-based geographies delineated by the inspection of aerial
imagery, local government land designations on district plan maps, address registers, property title
data, and any other available information. However, because the underlying meshblock pattern is
used to define the geographies, boundaries may not align exactly with local government land
designations or what can be seen in aerial images.
Urban areas
Urban areas are statistically defined areas with no administrative or legal basis. They are
characterised by high population density with many built-environment features, where people and
buildings are located close together for residential, cultural, productive, trade, and social purposes.
Urban areas are delineated using the following criteria. They:
• form a contiguous cluster of one or more SA2s
• contain an estimated resident population of more than 1,000 people and usually have a
population density of more than 400 residents or 200 address points per square kilometre
• have a high coverage of built physical structures and artificial landscapes, such as:
o residential dwellings and apartments
20Statistical standard for geographic areas 2023
o commercial structures, such as factories, office complexes, and shopping centres
o transport and communication facilities, such as airports, ports and port facilities, railway
stations, bus stations and similar transport hubs, and communications infrastructure
o medical, education, and community facilities
o tourist attractions and accommodation facilities
o waste disposal and sewerage facilities
o cemeteries
o sports and recreation facilities, such as stadiums, golf courses, racecourses, showgrounds,
and fitness centres
o green spaces, such as community parks, gardens, and reserves
• have strong economic ties where people gather to work and for social, cultural, and
recreational interaction
• have planned development within the next five to eight years.
Urban areas are further classified by the size of their estimated resident population as:
• major urban area (100,000 or more residents)
• large urban area (30,000–99,999 residents)
• medium urban area (10,000–29,999 residents)
• small urban area (1,000–9,999 residents).
Urban boundaries are independent of local government and other administrative boundaries, that
is, an urban area may be contained within one or more local government region or administrative
areas. However, the Richmond urban area, which is mainly in the Tasman District, is the only urban
area that crosses territorial authority boundaries. It includes the Daelyn SA2, which is in the Nelson
City Council area.
Rural areas
Rural areas represent land-based areas outside urban areas. They are classified as rural settlements
or other rural.
Rural settlement
Rural settlements are statistically defined areas with no administrative or legal basis. A rural
settlement is a cluster of residential dwellings about a place that usually contains at least one
community or public building.
Rural settlements are delineated using the following criteria. They:
• form a contiguous cluster of one or more SA1s
• contain an estimated resident population of 200–999 or at least 40 residential dwellings
• represent a reasonably compact area or have a visible centre of population, with a population
density of at least 200 residents per square kilometre or 100 address points per square
kilometre
• contain at least one community or public building, such as a church, school, or shop.
21Statistical standard for geographic areas 2023
The UR includes rural settlements that had been called rural centres in NZSAC92, rural settlements
that were previously part of an NZSAC92 urban area, and other identified rural settlements that
meet the above criteria.
To reach the target SA2 population size of more than 1,000 residents, rural settlements are usually
included with other rural SA1s to form an SA2. In some instances, the settlement and the SA2 have
the same name, for example, Kirwee rural settlement is part of the Kirwee SA2.
Some rural settlements whose populations are just under 1,000 are a single SA2. For example, SA2
(2018) 220900 Manaia-Kapuni was separated into SA2s (2023) 220901 Manaia (currently a rural
settlement with a population hovering around 1,000) and 220902 Kapuni. Creating separate SA2s for
these rural settlements allows for easy reclassification to urban areas if their populations grow
beyond 1,000.
Other rural
Other rural areas are the mainland areas and islands located outside urban areas or rural
settlements. Other rural areas include land used for agriculture and forestry, conservation areas, and
regional and national parks.
Other rural areas are defined by territorial authority.
Water
To ensure that the urban rural geography covers the total geographic New Zealand, bodies of water
are classified separately, using the land/water demarcation classification described in the Statistical
standard for meshblock (Stats NZ, 2016).
These water areas are not named and are defined by territorial authority or regional council.
The water classes include:
• inland water (non-contiguous, defined by territorial authority)
• inlets, which includes tidal areas and harbours (non-contiguous, defined by territorial
authority)
• oceanic (non-contiguous, defined by regional council).
To minimise suppression of population data, separate meshblocks have been created for marinas.
These meshblocks are attached to adjacent land in the UR geography.
The UR and IUR classifications
The UR is a flat classification. Each urban area and rural settlement is a single geographic entity with
a name and a numeric code. Names are provided with and without tohutō (macrons).
Other rural areas, inland water areas, and inlets are defined by territorial authority; oceanic areas
are defined by regional council; and each have a name and a numeric code.
Urban rural codes have four digits. North Island locations start with a 1, South Island codes start with
a 2, and oceanic codes start with a 6.
Classifications: Urban rural provides more information.
22Statistical standard for geographic areas 2023
The IUR classifies urban, rural, and water areas by type. The indicators, with their codes in brackets,
are:
• urban area – major urban (11), large urban (12), medium urban (13), small urban (14)
• rural area – rural settlement (21), rural other (22)
• water – inland water (31), inlet (32), oceanic (33).
Classifications: Urban rural provides more information.
In 2023, the UR contains 745 UR areas, including 195 urban areas and 402 rural settlements, based
on 2018 Census data and 2021 population estimates. Their IUR status (urban area size / rural
settlement) may change if their 2023 Census population count moves them up or down a category.
To minimise the number of UR categories, non-digitised SA2s are aggregated to oceanic outside
region, oceanic oil rigs, islands outside region, and the Ross Dependency outside region as shown in
table 3: Treatment of non-digitised SA2s above.
The UR and IUR are released annually on 1 January, and occasionally mid-year, but there are not
always changes from the previous classification.
Functional urban area (FUA)
Definition
FUAs are based on the linkages between where people live and where they work, shop, access
health care, and recreate (which can be called a person's ‘activity space’). According to the OECD
(2012) a functional urban area consists of a city and its commuting zone. Functional urban areas
therefore consist of a densely inhabited city and a less densely populated commuting zone whose
labour market is highly integrated with the city.
The FUA classification uses the UR to demarcate urban areas and SA1s to demarcate surrounding
hinterland (the commuting zone) within FUAs and rural and water areas outside FUAs.
Methodology
Workplace address and usual residence address responses from the 2018 Census of Population and
Dwellings were used to calculate the percentage of workers commuting from 2018 rural SA1s and
urban areas with less than 5,000 residents to 2018 urban areas with 5,000 or more residents.
A commute-in criteria was used, that is, commuting from a secondary urban core, satellite urban
area, or rural SA1 into the urban and secondary urban cores. Decisions on outward commuting were
applied manually using Stats NZ business demography data to identify rural SA1s that had high
employment counts in non-agricultural industries. For example, the SA1 that contains the Tiwai
Point aluminium smelter is included in the Invercargill FUA because many of its workers live in the
Invercargill urban area and commute outwards to Tiwai Point.
An FUA includes urban areas, rural settlements, and rural SA1s where there is an ‘urban core’ (a
major, large, medium, or small urban area with more than 5,000 residents) and may also include:
• one or more secondary urban cores – major, large, or medium urban areas where at least
40 percent of workers commute to the urban core
• one or more satellite urban areas – small urban areas where at least 40 percent of workers
commute to the urban core or associated secondary urban core
23Statistical standard for geographic areas 2023
• hinterland – rural settlements or rural SA1s where at least 40 percent of workers commute
to the urban core or associated secondary urban core plus other rural SA1s that link
satellite urban areas and secondary urban cores to the urban core.
Classification
The FUA classification identifies FUAs by name. A multiple core FUA is named after the largest urban
area it contains, for example, the Christchurch FUA includes the Christchurch urban core and
Rangiora, Kaiapoi, and Rolleston secondary urban cores. There is one exception to the naming rule.
The Paraparaumu-Waikanae-Paekakariki conurbation and surrounding hinterland is named Kapiti
Coast.
The FUA classification has a two-level hierarchical structure. Level 1 is classified by FUA type (TFUA)
a one-digit code and level 2, which has three-digit codes numbered north to south. Some examples
are: 1001 Auckland, 2001 Whangārei, 3001 Cambridge, 4001 Kaitāia.
In 2023, there are 53 FUAs. For the 2023 FUA, there have been minor updates to accommodate
changes to urban area boundaries and SA1 composition. The FUA will be reviewed once 2023 Census
results are available and will be revised if there are significant changes in commuting patterns.
FUA type (TFUA)
FUAs are further categorised by population size. The urban core’s population rather than the entire
FUA’s population is used to maintain consistency between the descriptions of UR urban area and
FUA type. The categories are:
1 Metropolitan area – more than 100,000 residents living in the urban core
2 Large regional centre – urban core population 30,000–99,999
3 Medium regional centre – urban core population 10,000–29,999
4 Small regional centre – urban core population 5,000–9,999.
FUAs are further categorised by population size. The urban core’s population rather than the entire
FUA’s population is used to maintain consistency between the descriptions of UR urban area and
TFUA. The categories are:
1 Metropolitan area (more than 100,000 residents living in the urban core)
2 Large regional centre (urban core population 30,000–99,999)
3 Medium regional centre (urban core population 10,000–29,999)
4 Small regional centre (urban core population 5,000–9,999)
9 Area outside functional urban area.
The Greymouth urban area population is less than 10,000 but is classified as a medium regional
centre, consistent with its treatment as a medium urban area in the UA classification.
The Wanaka urban area, whose population has grown to be more than 10,000, has been reclassified
to a medium urban area in the 2023 UR and a medium regional centre in the TFUA.
To differentiate from the UR classification, when referring to FUAs by name, their FUA type should
also be mentioned, for example, Christchurch metropolitan area, Whangarei regional centre.
24Statistical standard for geographic areas 2023
FUA indicator (IFUA)
The IFUA) classifies UR2023 urban areas and rural SA1s according to their character within their FUA.
The indicators, with their codes in brackets, are:
• urban area within functional urban area – urban core (101), secondary urban core (102),
satellite urban area (103)
• rural area within functional urban area – hinterland (201)
• area outside functional urban area – land area outside functional urban area (901), water area
outside functional urban area (902).
Functional urban areas – methodology and classification (Stats NZ, 2021) provides more information.
Urban accessibility (UA)
Definition
The UA provides a consistent measure of urban accessibility in order to measure the degree of
influence that New Zealand’s urban areas have on their surrounding rural areas. This approach
distinguishes the degrees of rurality in New Zealand and enhances understanding of the differences
across rural areas.
Methodology
Many methods can be used to measure geographic accessibility. For the UA, drive time (duration)
was used to categorise the degree of urban accessibility or rural remoteness at SA1 level. The Open
Source Routing Machine (OSRM) service with data from the OpenStreetMap project was used to
calculate drive time from the address-weighted centroid of SA1s in small urban areas and rural areas
to the edge of their nearest major, large, or medium urban area.
Origin point
The address-weighted centroid (that is, the centre of concentration of addresses) for each land-
based SA1 outside major, large, and medium urban areas was calculated to represent the average
location of residents and was used as the origin in the routing calculation. This address-weighted
centroid gives a more accurate representative location than the geographic centroid, particularly in
larger rural SA1s where the population is clustered in a small part of the SA1. Toitū Te Whenua ӏ
Land Information New Zealand (LINZ) addresses, extracted on census day (6 March 2018), were used
to calculate the address-weighted centroids.
Destination
Points created at the intersection of the outside boundary of UR2018 major, large, and medium
urban areas and the road network were used as the destination points for each route. The use of the
centroid or a representative point for each urban area was considered, but that was too
presumptive of what services are accessed or where business and employment sites are located.
Using urban area centroids would have resulted in dramatically different urban accessibility
measures for rural areas surrounding large sprawling cities such as Auckland, compared with more
compact cities like Tauranga.
Urban accessibility categories
Drive times were categorised into five classes from high urban accessibility to very remote. These
five categories provide adequate distinction given the physical geography of New Zealand and the
degree to which rural areas can be sensibly distinguished. The categories are described in table 4.
25Statistical standard for geographic areas 2023
Table 4
Urban accessibility categories
Table 4. Urban accessibility categories
UA category Duration
High urban accessibility • 0–15 minutes from major urban areas
Medium urban accessibility • 15–25 minutes from major urban areas
• 0–25 minutes from large urban areas
• 0–15 minutes from medium urban areas
Low urban accessibility • 25–60 minutes from major urban areas
• 25–60 minutes from large urban areas
• 15–60 minutes from medium urban areas
Remote • 60–120 minutes from major, large, or medium urban areas
Very remote • more than 120 minutes from major, large, or medium urban areas
When an SA1 centroid fell within the duration thresholds for multiple urban areas, the higher urban
accessibility class was assigned. For example, an SA1 centroid that is 5 minutes from a medium
urban area and 10 minutes from a major urban area was assigned to the high urban accessibility
class.
Entire small urban areas and rural settlements were assigned to a single urban accessibility category.
When SA1s within small urban areas or rural settlements had multiple urban accessibility categories,
the whole urban area or rural settlement was assigned to the accessibility category of the majority
of the SA1s in, or geographic area of, that urban area / rural settlement.
SA1s that did not contain any addresses were assigned a category based on the majority of their
neighbouring SA1s.
SA1 nearshore islands within swimmable or kayaking distance of the mainland were classified as
remote, and islands only accessible by boat were classified as very remote. Nearshore islands that
are part of a mainland SA1 have the same classification as their mainland area.
The western more populated part of Waiheke Island and the rural settlement of Oban at Stewart
Island / Rakiura were classified as having low urban accessibility as they can be reached within 60
minutes by regularly scheduled flights and ferries. The rest of Waiheke Island was classified as
remote.
The urban accessibility indicator (IUA)
The urban accessibility indicator (IUA) classifies urban, rural, and water areas by type. The high and
medium urban accessibility categories are considered to be peri-urban. The external boundaries are
similar to, but not exactly coincident with, the FUA boundaries. FUAs are delineated by actual census
commuting data, whereas the high and medium urban accessibility categories are delineated by
drive times. The IUA is shown in table 5.
26Statistical standard for geographic areas 2023
Table 5
Urban accessibility indicator classification
Table 5. Urban accessibility indicator classification
Level 1 code Level 2 code Name
1 Urban areas
111 Major urban area
112 Large urban area
113 Medium urban area
2 Small urban and rural areas
221 High urban accessibility
222 Medium urban accessibility
223 Low urban accessibility
224 Remote
225 Very remote
3 Water areas
331 Inland water
332 Inlet
333 Oceanic
For the 2023 UA, there have been minor updates to accommodate changes to urban area
boundaries and SA1 composition.
The Wanaka urban area, whose population has grown to be more than 10,000, has been reclassified
to a medium urban area in the 2023 UR. However, it will continue to be classified as a small urban
area in the UA until the analysis is re-run for the next major update.
27You can also read