Stock assessment of tarakihi off the east coast of mainland New Zealand - March 2018
←
→
Page content transcription
If your browser does not render page correctly, please read the page content below
Stock assessment of tarakihi off
the east coast of mainland New
Zealand
New Zealand Fisheries Assessment Report 2018/05

        A.D. Langley
ISSN 1179-5352 (online)
ISBN 978-1-77665-797-1 (online)

March 2018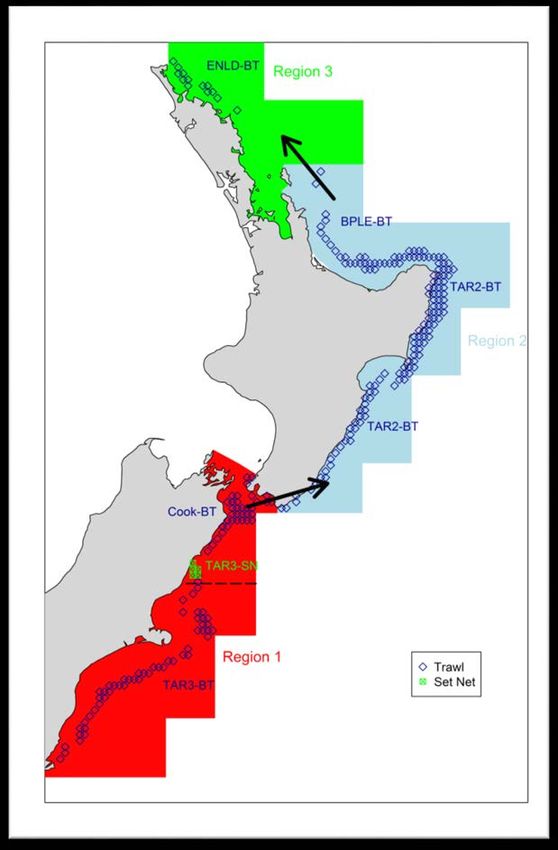
Requests for further copies should be directed to:

Publications Logistics Officer
Ministry for Primary Industries
PO Box 2526
WELLINGTON 6140

Email: brand@mpi.govt.nz
Telephone: 0800 00 83 33
Facsimile: 04-894 0300

This publication is also available on the Ministry for Primary Industries websites at:
http://www.mpi.govt.nz/news-and-resources/publications
http://fs.fish.govt.nz go to Document library/Research reports

© Crown Copyright - Ministry for Primary Industries
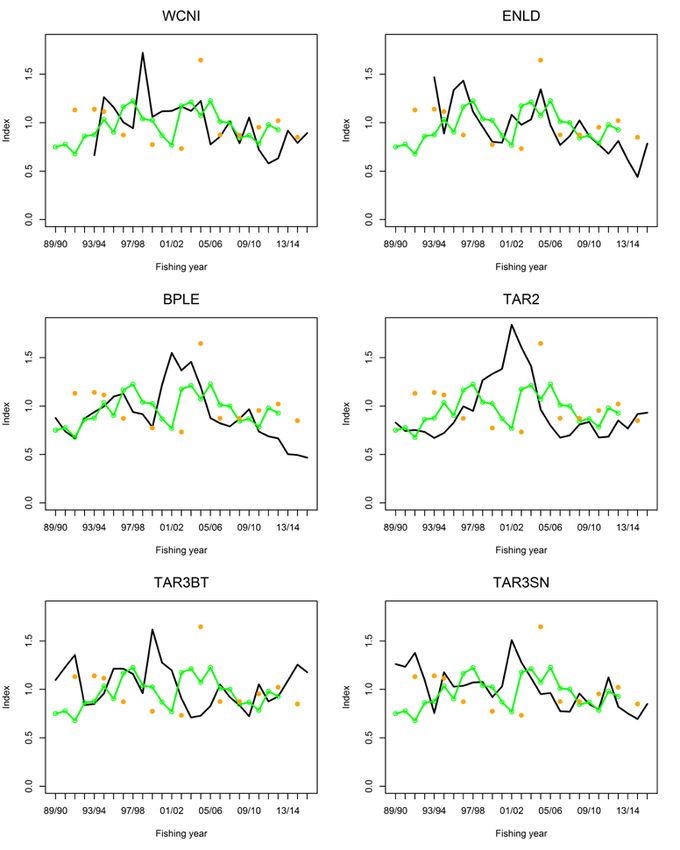
TABLE OF CONTENTS

EXECUTIVE SUMMARY                                             1

1.         INTRODUCTION                                       3

2.         DATA SETS                                          3
     2.1     CPUE indices                                     3
     2.2     Commercial age compositions                       5
     2.3       Trawl surveys                                   6
       2.3.1       Kaharoa inshore trawl surveys               6
       2.3.2       Previous trawl surveys                      6
     2.4       Trawl survey age compositions                   9

3.         BIOLOGICAL PARAMETERS                              10
     3.1       Age and growth                                 10
     3.2       Natural mortality                              12
     3.3     Sexual maturity                                  13

4.         REVIEW OF STOCK STRUCTURE                          13
     4.1     Distribution and relative abundance              13
       4.1.1       Distribution of spawning and juveniles     13
       4.1.2       Distribution of adults                     15
     4.2     Age compositions                                 15
     4.3     Recent trends in stock abundance                 20
     4.4     Tagging studies                                  21
     4.5     Other studies                                    22
     4.6       Summary                                        23

5.         STOCK ASSESSMENT                                   24
     5.1       Data sets                                      24
       5.1.1       Fishery definitions                        24
       5.1.2       Commercial catch history                   25
       5.1.3       Non commercial catch                       27
       5.1.4       Abundance indices                          27
       5.1.5       Commercial age compositions                28
       5.1.6       Trawl survey length and age compositions   28
     5.2       Biological parameters                          28
     5.3       Structural assumptions                         29
       5.3.1       Population structure                       29
       5.3.2       Recruitment                                30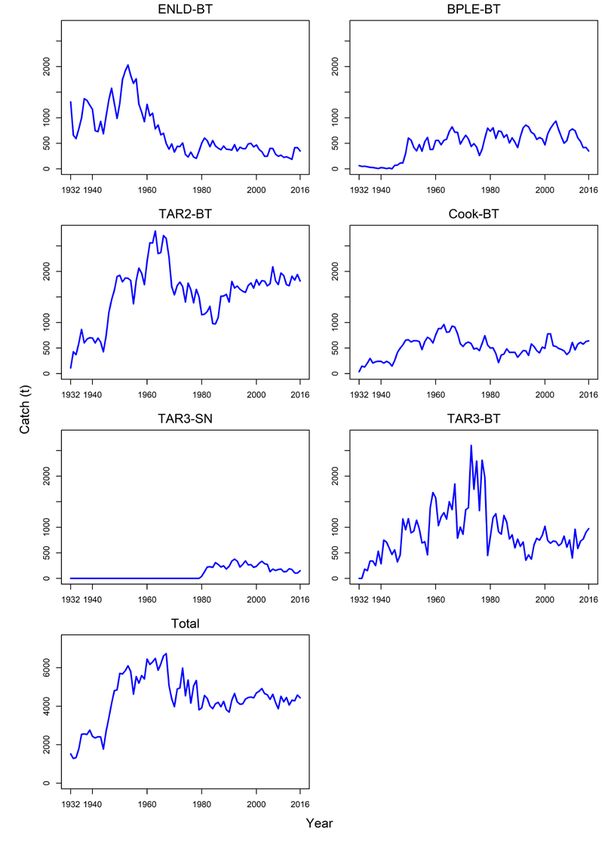
5.3.3       Fishing mortality                           30
       5.3.4       Initial conditions                          30
       5.3.5       Selectivity                                 30
       5.3.6       Movement                                    31
     5.4       Model configuration                             32
       5.4.1       Parameter estimation                        34
     5.5       Model results                                   36
       5.5.1       Parameter estimates                         36
       5.5.2       Model base case                             42
       5.5.3       Model diagnostics                           42
       5.5.4       Model comparisons                           54
       5.5.5       Derived quantities                          55
       5.5.6       Stock status                                57
       5.5.7       Forward Projections                         61

6.         DISCUSSION                                          64

7.         MANAGEMENT IMPLICATIONS                             65

8.         ACKNOWLEDGMENTS                                     66

9.         REFERENCES                                          66

APPENDIX 1. MODEL CATCH HISTORY                                71

APPENDIX 2. TRAWL SURVEY AGE AND LENGTH COMPOSITIONS           73

APPENDIX 3. FISHERY AGE COMPOSITIONS                           76

APPENDIX 4. CPUE INDICES                                       78

APPENDIX 5. MODEL LIKELIHOODS                                  79

APPENDIX 6. LIKELIHOOD PROFILES                                80

APPENDIX 7. MCMC DIAGNOSTICS                                   82

APPENDIX 7. MOVEMENTS OF TARAKIHI FROM EARLY TAGGING STUDIES   85
EXECUTIVE SUMMARY

Langley, A.D. (2018). Stock assessment of tarakihi off the east coast of mainland New Zealand.
New Zealand Fisheries Assessment Report 2018/05. 85 p.
The stock structure of tarakihi off the east coast of mainland New Zealand was reviewed, incorporating
new sources of information; specifically: age composition data from the main commercial fisheries, age
compositions from east coast South Island trawl surveys and updated CPUE indices from the main
tarakihi fisheries. The fisheries in Canterbury Bight/Pegasus Bay are dominated by younger fish and
there is a progressive increase in the proportion of older fish in the catches from TAR 2, the Bay of
Plenty and east Northland, while the relative strength of individual year classes is comparable amongst
these areas. Trends in CPUE indices are also comparable among these fisheries when lagged by the
relative age of recruitment to the respective fishery.
Spawning of tarakihi occurs throughout the eastern areas off the North and South Islands, although two
main spawning areas have been identified around East Cape and off Cape Campbell. There is a
preponderance of juvenile fish in Canterbury Bight/Pegasus Bay and low densities of juvenile tarakihi
in East Northland, the Bay of Plenty and TAR 2. The long pelagic phase of tarakihi may provide a
mechanism for the transfer of the progeny from the latter areas to the nursery grounds in Canterbury
Bight/Pegasus Bay.
Tagging studies indicate that there is a considerable northward movement of fish from the east coast of
the South Island to the Wairarapa coast, East Cape and the Bay of Plenty. Earlier tagging studies also
indicated northward movements of fish from Mahia Peninsula to East Cape and the Bay of Plenty and
a general eastward movement of tagged fish through the Bay of Plenty. There was also some movement
of tagged fish around East Cape from the western Bay of Plenty prior to the main spawning period.
These observations indicate considerable connectivity between tarakihi along the east coast of the South
and North Islands. The current stock hypothesis is that the Canterbury Bight/Pegasus Bay area
represents the main nursery area for the eastern stock unit. At the onset of maturity, a proportion of the
fish migrate northwards to recruit to the East Cape area and, subsequently, the Bay of Plenty and east
Northland areas. Thus, the eastern stock unit is considered to represent a series of connected sub-
populations (of adult fish) that is derived from a common pool of juvenile (pre-recruit) fish.
The results from previous tagging studies also indicate some connectivity between Kaikoura and the
west coast North Island. However, limited data are available from the west coast North Island to
elucidate the degree of the linkage between these areas. Recent age composition data from the west
coast North Island identified similarities and differences in the relative strength of individual year
classes compared to the east coast fisheries, while growth rates of older fish from the west coast North
Island differ from East Northland, suggesting a lack of connectivity between the fisheries around the
north of the North Island.
Limited direct comparisons are available between the age compositions from the east coast tarakihi
fisheries and the west coast South Island (TAR 7) fishery. A more comprehensive analysis of the
available data sets is required to further investigate the stock relationships between east coast tarakihi
and tarakihi off the west coast of the North and South Islands.
The current stock hypothesis was applied to define the spatial domain of the stock assessment of tarakihi
off the east coast of mainland New Zealand. The assessment encompasses the eastern North and South
Islands, including the entire area of TAR 3 and TAR 2 and the eastern portion of TAR 1 (i.e., Fisheries
Management Area 1). The model also includes the eastern area of TAR 7 (Cook Strait) which accounts
for approximately 15% of the annual catch of TAR 7.
The stock assessment of east coast tarakihi was conducted using a statistical, age-structured population
model implemented in Stock Synthesis. The assessment incorporated the available catch, CPUE indices,
trawl survey biomass estimates and age/length frequency distributions, and recent commercial age
compositions. The model data sets were structured into three areas: east coast South Island (including

Ministry for Primary Industries                                           Stock assessment of eastern tarakihi • 1
eastern Cook Strait), central east coast North Island and the Bay of Plenty combined (BPLE-TAR2),
and East Northland. The east coast South Island area included three commercial fisheries: the
Canterbury Bight/Pegasus Bay trawl fishery, Kaikoura set net fishery and the eastern Cook Strait trawl
fishery. The other two areas included a commercial trawl fishery and a relatively small non-commercial
fishery. For each area, a corresponding time-series (or multiple series) of CPUE indices was available.
The range of model options included different levels of spatial complexity to represent the current stock
hypothesis. The spatially stratified models provided reasonable results when configured at relatively
broad spatial scales. However, there were limited data available to reliably estimate some of the key
spatial parameters (especially movement) and a single region (spatially disaggregated) model was
adopted as the preferred (base) assessment model.
The base assessment model provides a good fit to the four sets of CPUE indices, mediated by the fishery
specific selectivity functions informed by the commercial age composition data. These data are
generally coherent with the abundance indices from the trawl surveys and associated age and length
compositions. The model estimates considerable variation in annual recruitment, especially from 1990
onwards. The overall results of the modelling were robust to a wide range of model assumptions related
to spatial structure, initial conditions and the relative weighting of key data sets (CPUE indices and age
compositions).
Spawning biomass is estimated to have been depleted to about the default soft limit of 20% SB0 by the
initial period of the assessment model in 1975, following a period of relative high catches (5000–7000
t) during the 1950s and early 1960s. Spawning biomass remained below the default soft limit since the
mid-2000s and 2015/16 spawning biomass is estimated to be at 17% of the unfished, equilibrium
biomass level (SB2016/SB0 = 0.170) from the base case model. There is a high probability (89%) that the
spawning biomass is below the soft limit (20% SB0) but a very low probability (less than 1%) of being
below the hard limit of 10% SB0. The stock status is similar for the range of model options, although
the stock status is slightly more pessimistic for the model sensitivity analyses with lower productivity
parameters (natural mortality, steepness and maturity).
Equilibrium yields at the target biomass level of 40% SB0 are estimated to be about 4100 t which is
slightly lower than the 2015/16 catch of 4442 t (including a 10% allowance for under reporting).
The projections indicate that a catch reduction of approximately 20% is required to minimise the risk
of reducing the stock below the hard limit (10% SB0) during the next 10 years and improving the
probability that the stock will increase to a level above the soft limit (20% SB0). However, substantially
larger reductions in catch are required to rebuild the stock to the 40% SB0 default target level within a
10-year period.

2 • Stock assessment of eastern tarakihi                                           Ministry for Primary Industries
1.      INTRODUCTION
Tarakihi (Nemadactylus macropterus) are caught in coastal waters of the North and South Islands,
Stewart Island and the Chatham Islands, down to depths of about 250 m. The fishery for tarakihi
developed with the introduction of steam trawlers in the 1890s (Paul 2014). By the mid-1930s, annual
catches had increased to reach about 2000 t. During the late 1940s, annual catches increased
substantially following the introduction of motor trawlers (Vooren 1974). Total catches stabilised at
about 5000–6000 t per annum during 1950–1981 (Francis & Paul 2013).
Most (approximately 80%) of the tarakihi catch has been taken off the east coast of the North and South
Islands, with catches concentrated in the Canterbury Bight, Pegasus Bay, around Cape Campbell and
the eastern approaches to Cook Strait, around East Cape (Mahia Peninsula–Cape Runaway), the Bay of
Plenty and off east Northland (Langley 2017). These areas are encompassed within the eastern area of
TAR 1, and in TAR 2 and TAR 3, and the eastern area of TAR 7. Since 1989/90, these areas have
cumulatively accounted for total annual catches of about 3500–4000 t with catches distributed amongst
the fishstocks in the approximate proportions of 40–45% TAR 2, 20–25% TAR 3, 20–25% TAR 1, and
5–10% TAR 7.
Recent trends in the east coast fisheries have been summarised in Langley (2017) following earlier
studies (Field & Hanchet 2001, Kendrick 2006, Kendrick 2009, Starr & Kendrick 2014). Most of the
catch is taken by the inshore trawl fisheries operating in each area, either targeting tarakihi or catching
tarakihi in association with a range of other inshore finfish species. In addition, a set net fishery targets
tarakihi off the Kaikoura coast. Annual CPUE indices have also been derived for each of the main
commercial fisheries (Langley 2017) and these indices represent the main information available for
monitoring each of the tarakihi fishstocks (eastern area of TAR 1, TAR 2 and TAR 3) (Starr & Kendrick
2014, MPI 2017).
Tarakihi off the east coast of the North and South Islands are considered to belong to a single biological
stock (Hanchet & Field 2001). A previous attempt to conduct an assessment of eastern tarakihi stock
was not successful, primarily due to the limited age composition data available from the commercial
catch (Langley & Starr 2012). To address these deficiencies, intensive age frequency sampling of the
commercial catches from the main fisheries was conducted during 2013/14 and 2014/15 (McKenzie et
al. 2017). Age compositions were also derived for the tarakihi sampled by the time-series of East Coast
South Island trawl surveys (Beentjes et al. 2017).
The resultant age compositions and updated CPUE indices (Langley 2017) provided additional
information to further investigate the stock relationships of tarakihi along the eastern coasts and
progress the assessment of the stock, including estimating biomass and sustainable yields. These
elements represent the second component of project TAR 2016-01 funded by the Ministry for Primary
Industries. The first component of the project included the fishery characterisations and CPUE analyses
conducted for TAR 1, TAR 2 and TAR 3 and is documented in Langley (2017).
The report is structured in four main sections: the first section reviews the available data sets from the
east coast tarakihi fisheries; the second reviews the main life history parameters for tarakihi; the third
reviews the stock structure of tarakihi; and the fourth presents the results of stock assessment modelling
based on the conclusions of the preceding sections.

2.      DATA SETS
This section summarises the main data sets available for tarakihi from the eastern North and South
Islands and adjacent areas. These data are examined in detail in the investigation of tarakihi stock
structure (Section 4). The data also represent key inputs in the stock assessment modelling (Section 5).
2.1        CPUE indices
Standardised CPUE analyses have been conducted for each of the main tarakihi fisheries within TAR
1, TAR 2 and TAR 3, updating and refining previous CPUE analyses to include data from the 1989/90–
2015/16 fishing years (Langley 2017). The fishery-specific standardised CPUE series are the primary
indices of relative abundance for TAR 3 (trawl and set net fisheries), TAR 2 (trawl) and the three fishery
areas that constitute TAR 1 (trawl) (Figure 1).
Ministry for Primary Industries                                             Stock assessment of eastern tarakihi • 3
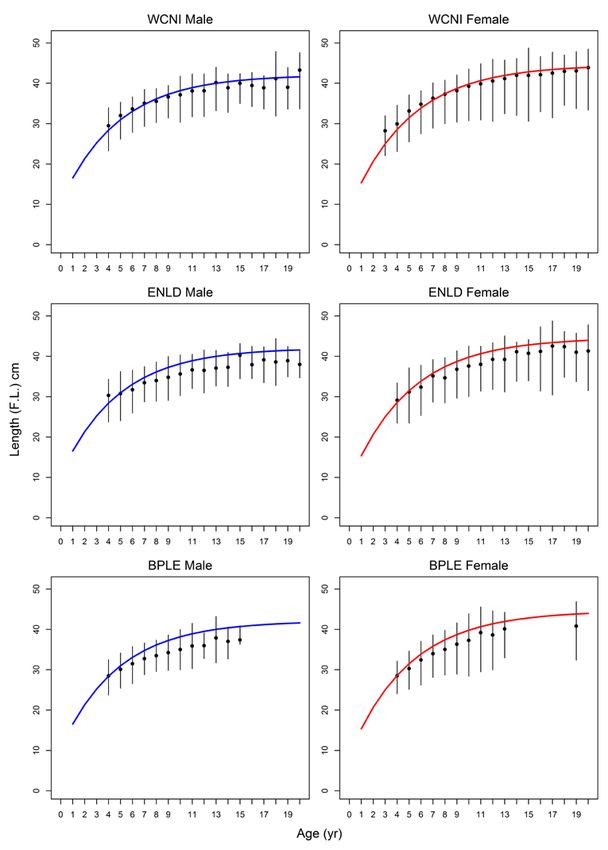
Figure 1: Tarakihi fishstock areas and Statistical Areas that constitute the domain of the east coast tarakihi
          assessment.

In addition, preliminary CPUE analyses were conducted for each fishery using data collected by the
Fisheries Statistics Unit (FSU) during 1983–1988. However, the CPUE indices were not considered to
be informative regarding trends in stock abundance due to the short time series (5–6 years) and the lack
of contrast. Further, there was some concern regarding the reliability of the reporting of catch and effort
data during that period and the indices were not included in the final analyses.
Historical trends in tarakihi catch rates are available for the trawl fisheries operating in the East Cape
area (TAR 2) during 1961–1970 (Vooren 1973, 1974) and in Canterbury Bight (TAR 3) during 1963–
1973 (Sullivan 1981). The CPUE indices for East Cape were calculated as the average annual catch (t)
of tarakihi per fishing day for the Gisborne trawl fleet (Vooren 1974). There was a considerable decline
in the catch rate of tarakihi over the period that was attributed to a decline in stock abundance following
the peak in the total catches of tarakihi during the early–mid-1960s (Vooren 1974) (Appendix 4).
The Canterbury Bight CPUE indices were derived from the February–September fishing season for
tarakihi (Sullivan 1981) (Appendix 4). The average of the monthly catch rates of tarakihi (kg per day)
by the Timaru trawl fleet was used to determine the annual CPUE index. Sullivan (1981) considered
the indices from 1967–1969 to be unreliable due to the absence of larger vessels from the fishery during
the Chatham Island rock lobster (crayfish) boom. Overall, CPUE declined by 45% from 1963–1966 to
1970–1973 (Sullivan 1981).

4 • Stock assessment of eastern tarakihi                                              Ministry for Primary Industries
2.2        Commercial age compositions
Over the last decade, there has been a considerable amount of sampling of the commercial catches from
the main tarakihi fisheries along the east coast of the North and South Island. For most of the fisheries,
four annual age compositions are available, including sampling from successive years in 2013/14 and
2014/15 (Table 1). Sampling from the East Northland trawl fishery was limited to these two years, while
the trawl fishery in the eastern area of Cook Strait was limited to 2013/14. In addition, two comparable
age compositions are available from the west coast North Island fishery (WCNI) (McKenzie et al.
2017).
Table 1: Summary of recent commercial catch sampling conducted from the tarakihi fisheries off the east
          coast of the North and South Island.

 Fishery area               Method   Stat Areas    Fishing years        Reference

 TAR 3                      SN       018           2009/10              Beentjes (2011)
                                                   2010/11              Beentjes et al. (2012)
                                                   2013/14, 2014/15     McKenzie et al. (2017)
 TAR 3                      BT       020,022,024   2009/10              Beentjes (2011)
                                                   2010/11              Beentjes et al. (2012)
                                                   2013/14, 2014/15     McKenzie et al. (2017)
 Cook Strait                BT       016–018       2013/14              McKenzie et al. (2017)
 TAR 2                      BT       011–015       2009/10              Parker & Fu (2011)
                                                   2010/11              Beentjes et al. (2012)
                                                   2013/14, 2014/15     McKenzie et al. (2017)
 Bay of Plenty              BT       008–010       2007/08              Armiger el al. (2010)
 (BPLE)                                            2010/11              McKenzie et al. (2015)
                                                   2013/14, 2014/15     McKenzie et al. (2017)
 East Northland             BT       002–004       2013/14, 2014/15     McKenzie et al. (2017)
 (ENLD)
The age determination protocol for tarakihi was revised following the publication of the results of the
commercial catch sampling conducted in 2009/10 and 2010/11 (Walsh et al. 2016). The study identified
that the previous ageing procedure had resulted in the otoliths being under-aged by one year. For the
current study, these earlier age structures were corrected by the addition of a year to all age classes.
This correction was applied to the age compositions documented in Beentjes (2011), Beentjes et al.
(2012), Parker & Fu (2011) and Armiger el al. (2010).
The more recent sampling of the trawl fishery in TAR 3, derived separate age compositions for the
components of the trawl fishery in Pegasus Bay and Canterbury Bight (McKenzie et al. 2017). The age
compositions differed somewhat between the two areas with a higher proportion of older (over 6 years)
fish in the catch sampled from the Pegasus Bay area. Previous sampling had not partitioned the fishery
by area (Beentjes 2011, Beentjes et al. 2012). For comparability between the two sampling periods, the
more recent annual age compositions from the two areas were amalgamated, weighted by the relative
catch (in number of fish) from each area.
An additional age composition was derived for the ENLD BT fishery in 2007/08 (Armiger el al. 2010).
However, the study was based on a limited number of samples and the resulting age composition was
poorly determined. The age composition also differed considerably from the age structure in the more
recent years (2014 and 2015). On that basis, the 2007/08 age data were excluded from the current
analysis.
For the final assessment model data sets, the data from the trawl fisheries in TAR 2 and BPLE were
amalgamated (Appendix 3). The annual age compositions from the two areas were combined by
weighting the area specific age compositions by the relative tarakihi catch in each area.

Ministry for Primary Industries                                           Stock assessment of eastern tarakihi • 5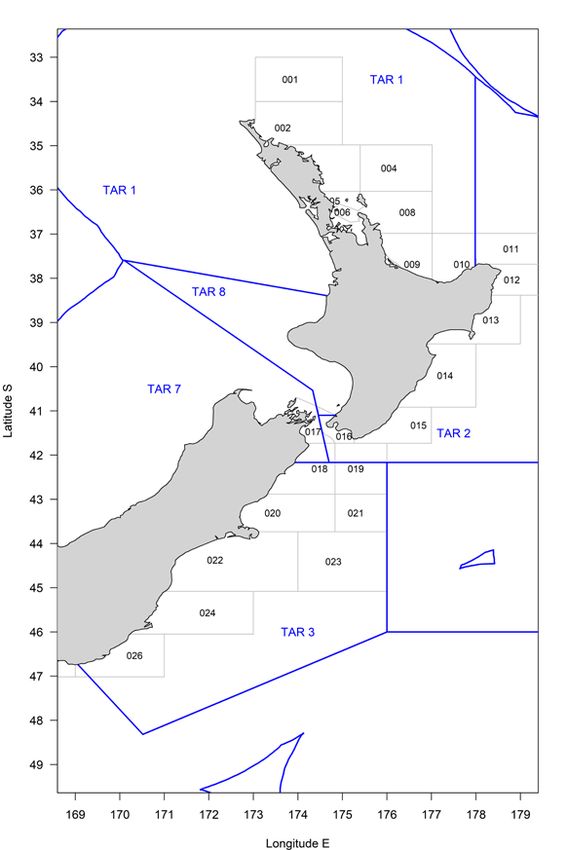
2.3       Trawl surveys
2.3.1     Kaharoa inshore trawl surveys
Inshore trawl surveys off the east coast of the South Island (ECSI) have been conducted by Kaharoa
since 1991 (Table 2). Tarakihi has been one of the main target species for the surveys and the survey
area has consistently encompassed the main depth range of the species (30–400 m) from Pegasus Bay
to Shag Point. The surveys are grouped in two separate series: winter (April–June) surveys conducted
during 1991–1996 (Beentjes & Stevenson 2000) and 2007–2016 and summer (December–January)
surveys during 1996–2000 (Table 2). All trawl surveys used the same set of trawl gear, with the
exception of different codends used between the winter (60 mm inside mesh measurement) and summer
(28 mm mesh) surveys.
Area swept biomass estimates of tarakihi have been derived from the individual trawl surveys (Table 2,
MPI 2017). Due to the differences in seasonal timing of the survey, the winter and summer trawl surveys
have been considered to represent two separate series of abundance indices for tarakihi. A comparison
of biomass estimates from the early winter surveys and summer surveys indicated that the availability
of tarakihi differed between seasons (Hanchet & Field 2001).
Scaled length compositions of tarakihi (unsexed, male and female) are also available from each of the
trawl surveys and are presented in the primary reference document for the individual survey (Table 2).
The final length compositions aggregated all fish by 1 cm length intervals (i.e., unsexed, male and
female combined).
For six of the more recent ECSI trawl surveys, otoliths were collected from the sampled catches of
tarakihi. The otoliths were read to determine the age of the individual fish sampled and length and age
distributions were determined for two depth zones (shallow and deep) (Beentjes et al. 2017).
Subsequently, the otoliths collected from the 2016 ECSI trawl survey were also aged (unpublished data
held by NIWA).
For the current study, composite age compositions were determined for each of the seven trawl surveys
by partitioning the scaled length compositions using an age-length key derived from the corresponding
survey age samples. The final age compositions were aggregated by sex for inclusion in the stock
assessment modelling (Appendix 2).
Four trawl surveys were conducted off the east coast of the North Island (ECNI) during 1993–96
(Stevenson & Hanchet 2000). The survey timing and boundaries were changed after the first survey and
the results from the initial survey are not considered directly comparable with the other three surveys
(conducted in February–March). The survey series was considered to be monitoring tarakihi but was
discontinued as the survey was not reliably monitoring other key species (Stevenson & Hanchet 2000).
Biomass estimates and scaled length compositions are available for tarakihi from the three surveys
(Table 2). Age compositions are not available from the ECNI trawl surveys.
Trawl survey biomass estimates from the Bay of Plenty, Hauraki Gulf and East Northland Kaharoa
inshore trawl surveys were not considered to effectively monitor tarakihi due to the restricted depth
range of the trawl surveys (Morrison et al. 2013).
2.3.2     Previous trawl surveys
Previous inshore trawl surveys off the east coast of the South Island are summarised in Hanchet & Field
(2001). Trawl survey biomass estimates from earlier surveys are summarised in Annala (1988). A series
of nine surveys of the Canterbury Bight were conducted by James Cook during 1980–1982, primarily
targeting barracouta (Hurst & Fenaughty 1985). The survey biomass estimates for tarakihi were low
and relatively imprecise (CV 32–86%) (table 9 of Annala 1988). It is considered that the data collected
from these surveys were unlikely to be particularly informative in the current study due to the short
time-series and the low precision of the biomass estimates for tarakihi.
Additional James Cook surveys targeting tarakihi were conducted off East Cape in 1971 and off the
east coast South Island during the 1970s and 1987 (Table 3). These surveys do not provide estimates of

6 • Stock assessment of eastern tarakihi                                        Ministry for Primary Industries
tarakihi biomass but have been used to derive age compositions of tarakihi. Limited documentation is
available for some of these surveys.

Ministry for Primary Industries                                       Stock assessment of eastern tarakihi • 7
Table 2: Summary of the Kaharoa inshore trawl surveys and tarakihi biomass estimates (total biomass, t) and coefficient of variation (CV).

 Series                Year                Depth range   Biomass (CV)      Age comp            Length comp            Reference
                       (Calendar/Model)

 ECSI, winter          1991/1991           30–400 m       1 712 (0.33)        No                     Yes              Beentjes & Wass (1994)
                       1992/1992           30–400 m         932 (0.26)        No                     Yes              Beentjes (1995a)
                       1993/1993           30–400 m       3 805 (0.55)        No                     Yes              Beentjes (1995b)
                       1994/1994           30–400 m       1 219 (0.41)        No                     Yes              Beentjes (1998a)
                       1996/1996           30–400 m       1 656 (0.24)        No                     Yes              Beentjes (1998b)
                       2007/2007           30–400 m       2 589 (0.24)        Yes                    Yes              Beentjes & Stevenson (2008)
                       2008/2008           30–400 m       1 863 (0.29)        Yes                    Yes              Beentjes & Stevenson (2009)
                       2009/2009           30–400 m       1 519 (0.36)        Yes                    Yes              Beentjes et al. (2010)
                       2012/2012           30–400 m       1 661 (0.25)        Yes                    Yes              Beentjes et al. (2013)
                       2014/2014           30–400 m       2 380 (0.23)        Yes                    Yes              Beentjes et al. (2015)
                       2016/2016           30–400 m       1 444 (0.31)        Yes                    Yes              Beentjes et al. (2016)

 ECSI, summer          1996/1997           10–400 m       3 818 (0.21)        No                     Yes              Stevenson (1997)
                       1997/1998           10–400 m       2 036 (0.24)        No                     Yes              Stevenson & Hurst (1998)
                       1998/1999           10–400 m       4 277 (0.24)        No                     Yes              Stevenson & Beentjes (1999)
                       1999/2000           10–400 m       2 606 (0.15)        No                     Yes              Stevenson & Beentjes (2001)
                       2000/2001           10–400 m       1 510 (0.13)        Yes                    Yes              Stevenson & Beentjes (2002)

 ECNI                  1993/1993           20–400 m                  -        No                      -               Kirk & Stevenson (1996)
                       1994/1994           20–400 m       1 128 (0.20)        No                     Yes              Stevenson & Kirk (1996), Stevenson & Hanchet (2000)
                       1995/1995           20–400 m         791 (0.23)        No                     Yes              Stevenson (1996a), Stevenson & Hanchet (2000)
                       1996/1996           20–400 m         943 (0.15)        No                     Yes              Stevenson (1996b), Stevenson & Hanchet (2000)

8 • Stock assessment of eastern tarakihi                                            Ministry for Primary Industries
2.4 Trawl survey age compositions
Age compositions have been derived from the more recent ECSI Kaharoa inshore trawl surveys (Table
2). In addition, tarakihi age compositions are available from individual trawl surveys conducted by R.V.
James Cook during the 1970s and in 1987 (Table 3).
Table 3: Summary of tarakihi age composition data from James Cook trawl surveys conducted in the 1970s
and in 1987.
Area Year Vessel Reference(s)
Cape Runaway–Mahia Peninsula, 40–155 m March 1971 James Cook Vooren & Tong (1973)
Pegasus Bay Jan–Mar 1970 James Cook Vooren (1973)
Tong (1979)
Pegasus Bay January 1978 James Cook Tong (1979)
Cape Campbell–Kaikoura March 1978 James Cook Tong (1979)
Pegasus Bay–Cape Campbell, 100–200 m April 1987 James Cook Annala et al. (1990)
The 1971 survey of the East Cape area conducted trawling throughout the area that supports the main
TAR 2 fishery. The age composition of the tarakihi sampled was broadly comparable amongst the
individual trawl stations (Vooren & Tong 1973).
Figure 2: Tarakihi age compositions (both sexes combined) from James Cook trawl surveys (see Table 3).
For the 1987 age composition, the terminal age class represents the proportion of fish aged 35
years and older (aggregated age class).
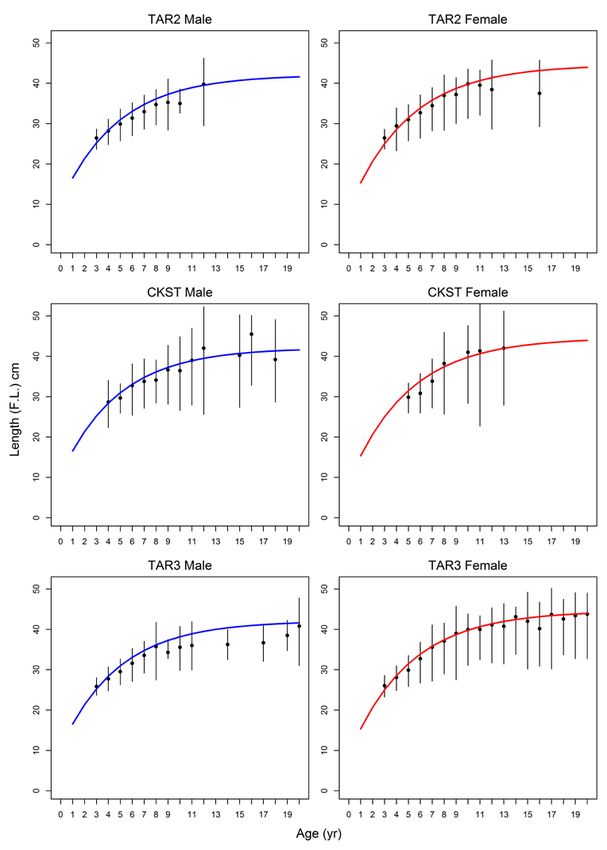
Ministry for Primary Industries Stock assessment of eastern tarakihi • 9The 1987 survey conducted trawl sampling across most of the depth range of tarakihi in the area from Banks Peninsula to Cape Campbell and Annala et al. (1990) concluded that the “sample design probably provided a reasonable random sample of the tarakihi population in this area”. There is no documentation available to describe the derivation of the age compositions determined from the James Cook trawl surveys in Pegasus Bay in 1970 and 1978 and Cape Campbell–Kaikoura in 1978. There is considerable variability in the age compositions from the individual surveys both between areas and between years (Figure 2). The lack of a consecutive series of surveys from an individual area or areas means that the utility of these data is limited. 3. BIOLOGICAL PARAMETERS 3.1 Age and growth Tarakihi growth has been defined using the Von Bertalanffy growth model. Annala (1987) summarised the results of earlier growth studies, including growth estimates from East Cape (McKenzie 1961, Vooren & Tong 1973) and the Bay of Plenty (Tong & Vooren 1972), and concluded that there were no obvious differences in the growth of tarakihi among the areas. Annala et al. (1990) derived Von Bertalanffy growth parameters for the TAR 3 fishstock from otoliths collected from fish sampled during the 1987 James Cook trawl survey of Pegasus Bay–Cape Campbell. Length-weight relationships for male and female tarakihi were also derived from allometric data (length and weight) collected during the survey (Annala et al. 1990). The growth parameters derived for TAR 3 were consistent with the growth parameters derived from the earlier studies in the other areas. An examination of age samples collected from the 2007–2016 Kaharoa ECSI trawl surveys (Section 2.3.1) indicated that the average length-at-age observations were consistent with the growth parameters for TAR 3 derived by Annala et al. (1990). The length-at-age data collected from TAR 2 in 2009/10 (Parker & Fu 2011) included insufficient observations in the older age classes to reliably estimate the parameters of the VB growth model. Nonetheless, for the age classes that dominated the sample (4–8 years), the average length-at-age for male and female fish were similar to the values derived from the TAR 3, TAR 4 and TAR 7 growth models, indicating similar growth patterns of tarakihi amongst these areas. Recent commercial catch sampling in TAR 1, TAR 2 and TAR 3 sampled the age of tarakihi in each of the main fisheries (McKenzie et al. 2017). These data provided the opportunity to compare the average length-at-age amongst six areas: TAR 3 (Canterbury Bight and Pegasus Bay), Cook Strait, TAR 2 (primarily East Cape–Mahia Peninsula), the Bay of Plenty, East Northland and the northern west coast of the North Island (TAR 1W). For each area, individual observations were aggregated by area, sex and fish age. The average length-at-age (and standard deviation) was determined for area/sex/age categories with at least four observations (Figure and Figure 3). The results show that the average length-at-age of male and female fish from the TAR 3, Cook Strait and TAR 2 fisheries are consistent with the lengths predicted from the established TAR 3 growth models (Annala et al. 1990) (Figure ). The average length-at-age from the northern west coast of the North Island fishery is also similar to the TAR 3 growth model (Figure 3). For East Northland and the Bay of Plenty, the average length-at-age of male and female fish is similar to TAR 3 for the 4–6 year age classes; i.e., the age range that fish recruit to the fisheries in these two areas. However, from age 6 years the average length-at-age of fish sampled from the two areas was consistently lower than predicted from the TAR 3 growth models (Figure 3). This difference in length was about 2–3 cm for the older age classes (13–20 years) in the sampled population. These results indicate that initial growth rates of tarakihi in East Northland and the Bay of Plenty are comparable to the other areas, although there is a more rapid attenuation of growth from age 6 years. One hypothesis that could explain these regional patterns in growth is that the fish in the East Northland and the Bay of Plenty share a common nursery ground with the fish from the other areas and, consequently, exhibit a similar initial growth to age 4–6 years. With the onset of sexual maturity, some fish may migrate from the nursery grounds and recruit to the fisheries within the East Northland and 10 • Stock assessment of eastern tarakihi Ministry for Primary Industries
Bay of Plenty areas. The subsequent growth rates could be suppressed if the productivity of fish in these
areas is lower than the other fishery areas and/or there was an earlier onset of sexual maturity or a higher
spawning frequency for the fish in the East Northland and Bay of Plenty areas.
The average length-at-age of older (6+ years) tarakihi in the East Northland fishery is lower than from
the northern west coast North Island fishery (Figure 3), despite the close proximity of the main fisheries
in these two areas. This may indicate a demarcation of the tarakihi populations between the two areas,
at about North Cape.

Figure 3: Average lengths at age (points) and confidence interval (1.96 standard deviations) for male and
          female tarakihi aged otolith samples from 2013/14 and 2014/15 commercial catch sampling
          programmes for TAR 2 (top), Cook Strait (middle) and TAR 3 (bottom). For comparison, the
          growth curve of male (blue lines) and female (red lines) tarakihi from TAR 3 (derived from
          Annala et al. 1990) is also presented.

Ministry for Primary Industries                                            Stock assessment of eastern tarakihi • 11
Figure 3: Average length at age (points) and confidence intervals (1.96 standard deviations) for male and
female tarakihi aged otolith samples from the 2013/14 and 2014/15 commercial catch sampling
programmes for the West Coast North Island (top), East Northland (middle) and the Bay of
Plenty (bottom). For comparison, the growth curve of male (blue lines) and female (red lines)
tarakihi from TAR 3 (derived from Annala et al. 1990) is also presented.
3.2 Natural mortality
An estimate of natural mortality for tarakihi was derived by Vooren (1977) from the age structures of
lightly exploited populations sampled from the west coast South Island in 1971 and 1972. A catch curve
analysis yielded total mortality estimates of 0.13 from both samples. An additional age sample was
available from an unfished population of tarakihi around the Chatham Islands sampled in 1972.
However, that age composition showed considerable variation in the strength of individual year classes
and the total mortality estimates from a catch curve analysis are not considered to be reliable.
12 • Stock assessment of eastern tarakihi Ministry for Primary IndustriesAge compositions were also available from surveys conducted in the Kaikoura area during 1970 and 1971. A catch curve analysis of these data estimated total mortality values of 0.147 and 0.159 and a value of natural mortality of 0.15 was proposed (Vooren 1973). Vooren (1977) considered the estimate of 0.15 to be too high and stated that “M values not greater than 0.1 should be used”. Annala et al. (1990) analysed the population age structure from Pegasus Bay–Cape Campbell in 1987. A catch curve analysis of the male and female age compositions estimated total mortality (Z) values of 0.12–0.16 for males and 0.12–0.15 for females. An approximation of M was also derived from the oldest age observed in the sample (42 years) yielding an estimate of M = 0.11. Annala et al. (1990) concluded that the available information suggested that M is no greater than 0.10. 3.3 Sexual maturity Tong & Vooren (1972) found that tarakihi in the western Bay of Plenty reached first maturity at 25 cm and 24 cm for males and females, respectively. For males, the length at 50% and 100% maturity was 27 cm and 31 cm, respectively, while the corresponding length metrics of female fish were 28 cm and 35 cm. Annala (1987) summarised the results of previous biological studies and concluded that both sexes reach sexual maturity at 4–6 years of age. Parker & Fu (2011) estimated length at maturity for male and female tarakihi from data collected during the 1993 east coast North Island trawl survey. A maturity ogive was determined for female and male fish assuming a logistic function. For female fish, L50% and L95% were estimated to be 33.56 cm and 40.13 cm, respectively. For male fish, L50% and L95% were estimated to be 31.55 cm and 39.78 cm, respectively. For TAR 3, 50% maturity was reached at 33 cm and 32 cm for female and male fish (Beentjes 2011). The lengths at maturity derived from these recent studies are considerably larger than determined by Tong & Vooren (1972). 4. REVIEW OF STOCK STRUCTURE A comprehensive review of tarakihi stock structure was conducted by Hanchet & Field (2001) and updated by Langley & Starr (2012). This section provides a further compilation of the information summarised in the previous documents. Since then, additional age composition data have become available from commercial catch sampling and the ECSI trawl surveys and the CPUE indices have been updated. These data were examined to make inferences about potential stock linkages between fishery areas. 4.1 Distribution and relative abundance 4.1.1 Distribution of spawning and juveniles The information available to characterise the distribution of spawning and juvenile tarakihi has been summarised in detail by Hurst et al. (2000) and Morrison et al. (2014). Ripe and running ripe fish have been recorded from all around mainland New Zealand (Hurst et al. 2000). Vooren (1975) identified important spawning grounds off the east coast of the South Island coast, mainly in the deep water (100–200 m) in southern Cook Strait off Kaikoura Peninsula, in Pegasus Bay, and in the Canterbury Bight. Sampling of the catch from the Kaikoura set net and TAR 3 trawl fisheries indicated that mature and spawning fish were most common during January–March (Beentjes 2011). Annala et al. (1990) noted that ripe and running ripe fish were taken at most stations during a trawl survey of Pegasus Bay–Cape Campbell during April 1987. Mature and ripe tarakihi were also observed from FMA 3 during May–June (Hurst et al. 2000). Recent samples of the commercial catches from East Northland, the Bay of Plenty, TAR 2 and Cook Strait had a higher proportion of female fish with ovaries in the ripe and/or running ripe stages of development during February–April (Hurst et al. 2000, Parker & Fu 2011; Jeremy McKenzie, NIWA, unpublished data). A trawl survey of tarakihi in the East Cape area during March 1971 caught ripe and recently spawned tarakihi (Vooren & Tong 1973). Eggs in surface plankton samples indicated main spawning areas near East Cape, Kaikoura, and Fiordland (Robertson 1978). The larval stage is followed by a pelagic post-larval stage, and the post- larvae metamorphose into bottom-living juveniles when they are 8–10 months old, at a fork length of Ministry for Primary Industries Stock assessment of eastern tarakihi • 13
70–90 mm (Vooren 1972, 1973, Tong & Saito 1977). Limited pre-juveniles have been collected.
Robertson (1978) collected a single sample of 30 pre-juveniles (mean length 70 mm) at the surface at
night, using a light and a dip net. These specimens were taken 1 km offshore in water 15 m deep.
Robertson (1978) postulated that these pre-juveniles, which occurred in Otago waters in late spring and
early summer, were probably spawned in southern Fiordland in the previous summer and autumn period
and would have spent the next 7–10 months drifting northwards in the Southland Current, along the
south and east coasts of the South Island. Annala (1987) considered that larvae from the west coast
South Island spawning grounds may be transported north or south. Those carried south may settle
mainly along the Otago coast and in the Canterbury Bight (Annala 1987).
Vooren & Tong (1973) noted a “scarcity of juveniles up to 4 years old” from the 1971 survey of the
East Cape area and noted that this result was consistent with earlier sampling in the East Cape area in
October 1969. Trawl sampling (141 stations) of the Bay of Plenty during 1961–63 in the 0–100 fathoms
(0–183 m) depth range caught few tarakihi less than 10 inches (25.4 cm) in length (Tong & Elder 1968).
Vooren (1975) identified the main nursery grounds of tarakihi as the south-western coast of the North
Island, Tasman Bay and along the entire eastern coast of the South Island (from Cape Campbell to
Otago Peninsula) and around the Chatham Islands. Juvenile tarakihi (age groups 1 and 2) were also
occasionally recorded from trawl sampling in Hawke Bay (Vooren 1975).
Hurst et al. (2000) mapped the distribution of catches of 0+ and 1+ year tarakihi from trawl surveys.
The catches of 0+ juveniles were mainly off the east coast of the South Island in less than 100 m depth.
1+ juveniles were more widespread around mainland New Zealand. Catches were recorded from the
western Bay of Plenty and from a small number of observations along the central east coast of the North
Island. Negligible catches of juvenile tarakihi were recorded from around the east and west coasts of
the northern North Island. Overall, catch rates of juvenile tarakihi were much larger from the Canterbury
Bight compared to any of the other areas (Hurst et al. 2000).
Annala (1987) presented a synthesis of published and unpublished information on the recruitment of
tarakihi and available information on current systems. The proposed mechanism for the recruitment of
tarakihi involves the migration of the late juveniles and young adults against the prevailing current to
their parental spawning grounds. The larval distribution was described for four main spawning grounds:
west coast South Island, East Cape–Bay of Plenty, Conway Ridge–Pegasus Bay and Chatham Islands
(Annala 1987). The distribution of larvae from the two main spawning grounds along the east coast was
described, as follows:
“Larvae from the East Cape–Bay of Plenty spawning grounds are transported by the East Cape Current
south along the east coast of the North Island, east towards the Chathams by the eddy system, and then
north by the counter current offshore. Larvae settle along the entire east coast of the North Island on
their way south and may be carried around the whole system back to the parental spawning grounds.
Some larvae may reach the Chathams.
The Conway Ridge–Pegasus Bay spawning population may be an important link between tarakihi
“stocks”. Because of the complicated nature of the current systems in this area, larvae may be
transported out and settle along the east coast of central New Zealand from Pegasus Bay to the
Wairarapa coast, be carried through Cook Strait, be entrained in the eddy system off the east coast of
the North Island and carried north towards East Cape, or be carried out to the Chathams” (Annala
1987).
For this study, preliminary modelling was conducted to investigate the passive drift from the known
spawning locations over the seven months following main spawning period (assumed to be in April)
for each year from 2007–2013. The analysis used the monthly average current flow at 5 m depth derived
from the NCEP Global Ocean Data Assimilation System (GODAS) (Behringer & Xue 2004)
(http://iridl.ldeo.columbia.edu/). The results indicated that passive drift from spawning locations off the
east Northland, the Bay of Plenty and East Cape areas resulted in eastward displacement terminating in
areas well offshore from the east coast of the North Island. In contrast, passive drift from a spawning
site at Cape Campbell tended to retain larvae in the vicinity of the Wairarapa coast. The analysis is not
considered to be particularly informative, although it does highlight that the passive drift in the surface

14 • Stock assessment of eastern tarakihi                                          Ministry for Primary Industries
waters is unlikely to provide a mechanism for the progeny of tarakihi from the northern-east coast of
the North Island to reach the nursery grounds off the east coast of the South Island.
4.1.2      Distribution of adults
Trawl surveys show that adult tarakihi are distributed around mainland New Zealand concentrated in
the 100–300 m depth range (Anderson et al. 1998 and Hurst et al. 2000). Langley (2017) defined the
areas of highest tarakihi abundance based on the relative catch rates from the commercial trawl fisheries
in TAR 1, TAR 2 and TAR 3. These areas were relatively contiguous along the eastern coast of the
North and South Islands, although the largest areas of prime tarakihi habitat were around East Cape
(western Bay of Plenty to Mahia Peninsula), in eastern Cook Strait (off Cape Campbell), in the
Canterbury Bight and off east Northland.
Langley (2017) investigated seasonal patterns in trawl catch and effort data by Statistical Area to
identify spatio-temporal variation in tarakihi CPUE that might be indicative of changes in the
availability of tarakihi associated with spawning. Peaks in tarakihi CPUE during the March–May
spawning period occurred off East Northland and in the Bay of Plenty. There is no strong seasonal peak
in CPUE in the East Cape–Mahia Peninsula area. In the areas off the east coast of the South Island,
tarakihi CPUE was highest during December–March and lowest during July–October. Off the
Wairarapa coast, tarakihi CPUE increased during May–June from a lower level in December–March.
4.2        Age compositions
Over the last decade, a comprehensive series of age composition data has been compiled from the
Kaharoa ECSI trawl surveys (Table 2) and the sampling of commercial catches from the tarakihi
fisheries along the east coasts of the South Island and North Island (Table 1). The age compositions are
characterised by the presence of a number of strong and weak year classes. These individual year classes
can be followed through successive sampling events from the same fishery area (Figure 4, Figure 5 and
Figure 6). In addition, over subsequent sampling events these year classes are emergent in the age
compositions from the fisheries in the more northern areas of the east coasts of the South Island and
North Island. Specific observations from the age composition data are as follow.
      •    The ECSI survey age compositions are dominated by fish aged 1–5 years (Figure 4). The age
           composition from the 2009 winter trawl survey was dominated by a strong 2007 year class (age
           2 years). This year class persisted in the 2012 trawl survey age composition (Figure 4).
      •    The age composition from the 2012 winter trawl survey also included a strong 2009 year class
           (age 3 years). The 2008 year class (age 4 years) was relatively weak compared to the two
           adjacent year classes (Figure 4).
      •    The 2007 year class dominated the age composition from the TAR 3 trawl fishery in 2011 (age
           4 years) (Figure 4). This year class was a trivial component of the age composition of the TAR
           3 trawl fishery from 2014 and 2015 (at age 7 and 8 years).
      •    The 2009 year class dominated the age composition from the TAR 3 trawl fishery in 2014 (age
           5 years) but represented a relatively small proportion of the age composition in 2015 (at age 6
           years) (Figure 4).
      •    The 2007 year class recruited to the TAR 3 set net fishery in 2011 (age 4 years) and dominated
           the age composition of the catch in the subsequent sample in 2014 (age 7 years) (Figure 4). The
           2009 year class had also recruited to the fishery by 2014 (age 5 years). This year class was more
           dominant in 2015 (age 6 years), while the relative proportion of fish in the 2007 year class (age
           8 years) decreased.
      •    The 2007 and 2009 year classes were also prominent in the 2014 age composition from the
           Cook Strait trawl fishery (at ages 7 and 5 years, respectively) (Figure 4). The age composition
           also includes a relatively strong year class at age 10 years (2004 year class). The 2004 year
           class had also been prominent in the TAR 3 set net age composition in 2010 (age 6 years).
      •    The 2007 year class recruited to the TAR 2 trawl fishery in 2011 (age 4 years) (Figure 5). The
           2014 and 2015 TAR 2 age compositions were similar to the corresponding TAR 3 set net age
           compositions. The two 2014 age compositions were dominated by the 2007 (age 7 years) and
           2009 (age 5 years), although the 2009 year class was more prominent in the TAR 2 trawl age

Ministry for Primary Industries                                            Stock assessment of eastern tarakihi • 15
composition (Figure 5). The dominance of the 2009 year class increased in the 2015 age
compositions, although the relative importance of the 2007 year class (compared to the 2009
year class) was higher in the TAR 3 set net fishery than the TAR 2 trawl fishery (Figure 5).
• The 2004 year class represented a significant proportion of the TAR 2 age composition in 2010
(age 6 years) and 2011 (age 7 years). This year class represented a negligible component of the
TAR 2 age composition in 2014 (age 10 years) and 2015 (age 11 years) (Figure 5).
• The 2007 year class also recruited to the Bay of Plenty trawl fishery in 2011 (age 4 years)
(Figure 6). This year class persisted in 2014 and 2015 while the 2009 year class became
increasingly dominant. The 2014 and 2015 age compositions from the Bay of Plenty fishery
are similar to the corresponding age compositions from both the TAR 3 set net fishery and the
TAR 2 trawl fishery. There was a slightly higher proportion of older fish in the Bay of Plenty
trawl fishery compared to the TAR 2 trawl fishery, although overall there was a relatively small
proportion of fish in age classes older than 10 years for both fisheries (Figure 6).
• For the East Northland trawl fishery, the strong 2007 year class had recruited to the fishery by
2014, while the 2009 year class (age 5 years) appears to have partially recruited (Figure 6). The
2009 year class is considerably more prominent in the 2015 age composition (at age 6 years).
By comparison to the other fisheries, there was a relatively high proportion of older fish in the
East Northland age composition, especially within the 17–22 age classes (1993–1997 year
classes) (Figure 6).
In addition to the above observations, Parker & Fu (2011) partitioned the TAR 2 trawl age composition
data from 2010 into two areas; i.e. south and north of Mahia Peninsula. The sampled catch from south
of Mahia Peninsula was composed of younger fish, including a significant proportion of 3 year old fish
(previous aged 2 and corrected to age 3 based on the revised ageing protocol).
McKenzie et al. (2017) derived separate age compositions for the TAR 3 trawl fisheries in Canterbury
Bight and Pegasus Bay for 2014 and 2015. The age compositions from the Canterbury Bight were
dominated by age 4–5 year fish and fish older than 6 years were virtually absent. The catches from
Pegasus Bay were also dominated by young fish (4–6 years) although a broad range of older age classes
was also sampled (7–20 years).
16 • Stock assessment of eastern tarakihi Ministry for Primary IndustriesFigure 4: A comparison of annual age compositions collected from the ECSI winter trawl survey (left) and
commercial fisheries in TAR 3 and eastern Cook Strait. Individual year classes are colour coded
to follow the cohorts through successive years. The proportion of fish older than 14 years are
aggregated into the oldest age class.
Ministry for Primary Industries Stock assessment of eastern tarakihi • 17Figure 5: A comparison of annual age compositions collected from the ECSI winter trawl survey (left) and
commercial fisheries in TAR 3 and TAR 2. Individual year classes are colour coded to follow the
cohorts through successive years. The proportion of fish older than 14 years are aggregated into
the oldest age class.
18 • Stock assessment of eastern tarakihi Ministry for Primary IndustriesFigure 6: A comparison of annual age compositions collected from the TAR3-SN, TAR2-BT, BPLE-BT and
ENLD-BT commercial fisheries. Individual year classes are colour coded to follow the cohorts
through successive years. The proportion of fish older than 14 years are aggregated into the oldest
age class.
Limited age composition data are available from the WCNI trawl fishery with sampling conducted in
2014 and 2015 only (McKenzie et al. 2017). The age compositions indicate the presence of the strong
2007 year class which is also present in the east coast age compositions. Nonetheless, while the 2006
year class appears to be weak throughout the age compositions from the east coast fisheries, there is no
indication that this year class is weak in the WCNI fishery (McKenzie et al. 2017). Further, the 2005
year class appears to be relatively strong in the WCNI fishery, although it was only present as a
relatively pronounced year class in the TAR 3 set net fishery in 2011 (age 6 years) and appeared to be
of moderate strength in the age compositions from the other east coast fisheries.
The age composition data from the west coast South Island (WCSI) trawl surveys (in 1995, 1997, 2000,
2003 and 2005) and 2004/05 TAR 7 commercial catches indicate the presence of a strong year class in
1991 and weak year classes in 1989, 1999, 2003 and 2004 (Manning et al. 2008). These limited
observations are broadly consistent with estimates of recruitment strength derived from the stock
assessment modelling of the east coast tarakihi stock which incorporates the age composition data from
the east coast fisheries (see Section 5.5.1). The east coast stock assessment estimates a moderate 1991
year class, weak 1989 and 1999 year classes and moderate 2003 and 2004 year classes. Nonetheless, a
more comprehensive analysis of the age composition data is required to compare the age structure
between the two areas, including an evaluation of the full range of year classes sampled from the WCSI
fishery.
Further, estimates of the abundance of pre-recruit tarakihi from Tasman Bay/Golden Bay (TAR 7)
indicate relatively strong recruitment in 2006, 2008, 2010, 2012 and lower recruitment of the 2014 year
class (MPI 2017). These observations are broadly consistent with the strength of the corresponding
Ministry for Primary Industries Stock assessment of eastern tarakihi • 192006, 2010, 2012 and 2014 year classes estimated from the east coast assessment model, whereas the
2008 year class was estimated as very weak (see Section 5.5.1).
4.3 Recent trends in stock abundance
Langley (2017) compared annual trends in the CPUE indices derived from the TAR 3 trawl and set net
fisheries and trawl fisheries in TAR 2, the Bay of Plenty (TAR 1), East Northland (TAR 1) and west
coast North Island (TAR 1) (Figure 7). The main conclusions of these comparisons are summarised as
follows:
• The Bay of Plenty and TAR 2 trawl CPUE indices both exhibit a strong peak in the annual CPUE
indices during 2000/01–2004/05 (Figure 7). There is a short lag between the two sets of indices
during this period; the increase in TAR 2 CPUE indices preceded the increase in the Bay of Plenty
CPUE indices by one year, while the higher level of CPUE indices from the Bay of Plenty was
maintained for a further year.
• There was also a peak in the CPUE indices from the TAR 3 set net fishery during 2001/02–
2003/04 (Figure 7).
• The increase in CPUE indices for the Bay of Plenty and TAR 2 trawl fisheries was preceded by
a peak in the TAR 3 trawl CPUE indices during 1999/2000–2001/02 (Figure 7). The catch from
the TAR 3 trawl fishery is dominated by younger fish compared to the other two fisheries.
• For the East Northland trawl fishery, there was a period of higher CPUE during 2001/02–2005/06
that followed the peak in the Bay of Plenty trawl CPUE by one year (Figure 7). Both sets of
indices also exhibited another peak during 1995/96–1997/98. This earlier peak in CPUE was not
evident in the indices from the TAR 2 trawl fishery.
• There was a general decline in the CPUE indices from the Bay of Plenty during 2009/2010–
2015/16 which was consistent with the recent trend in the CPUE indices from the East Northland
fishery (Figure 7).
• The CPUE indices from the TAR 3 trawl fishery increased from about 2009/10 to 2015/16. This
increase was been followed by a smaller increase in the CPUE indices from the TAR 2 trawl
fishery (Figure 7).
• The CPUE indices from the northern WCNI fishery do not exhibit the period of higher CPUE
during 2000/01–2004/05 that was evident for TAR 2, the Bay of Plenty and, to a lesser extent,
East Northland (Figure 7).
For the east coast tarakihi fisheries, there are significant positive correlations amongst each set of CPUE
indices once a lag period was incorporated (between individual sets of CPUE indices) (Langley 2017).
In general, the lag intervals that provided the best correlation tended to coincide with the differences in
the age composition of the catches between the corresponding fisheries (i.e., the ages of first
recruitment).
The general increase in the CPUE indices from multiple fisheries during the late 1990s–early 2000s is
consistent with a period of strong recruitment. The age composition data from East Northland indicate
the presence of a series of stronger 1993–1997 year classes that are not present in the age compositions
from the other fisheries. Nonetheless, the timing of the recruitment of these year classes to the individual
fisheries is consistent with the period of higher CPUE indices.
Trends in the range of CPUE indices derived from the TAR 1, TAR 2, and TAR 3 fisheries (Langley
2017) differ from the time-series of tarakihi biomass estimates from the Kaharoa inshore WCSI trawl
survey (MPI 2017) (Figure 7). Similarly, the CPUE trends from the TAR 1, TAR 2, and TAR 3 fisheries
are not consistent with the trends in the CPUE indices from the TAR 7 WCSI MIX trawl fishery
(Langley 2014). The WCSI CPUE indices are characterised by two periods of higher CPUE during
1994/95–1999/2000 and 2002/03–2007/08 and lower CPUE during the intervening period (Figure 7).
Tarakihi recruit to the TAR 7 trawl fishery at age 2–3 years and catches (in numbers of fish) are
dominated by 3–8 year old fish (Manning et al. 2008). Thus, the age composition of the catch can be
considered broadly comparable to the TAR 3 set net, TAR 2 trawl and the Bay of Plenty trawl fisheries.
The CPUE indices from these fisheries do not correspond with the CPUE indices from the TAR 7 WCSI
MIX trawl fishery, especially during 2000/01–2001/02 when CPUE from the latter fishery was
20 • Stock assessment of eastern tarakihi Ministry for Primary IndustriesYou can also read