Strategic Intelligence Assessment 2021 - Safer Oxfordshire Partnership - June 2021 - Oxfordshire Insight
←
→
Page content transcription
If your browser does not render page correctly, please read the page content below
Oxfordshire Strategic Intelligence Assessment 2021

Safer Oxfordshire Partnership

Strategic Intelligence
Assessment 2021

                                                 June 2021

                                                                                1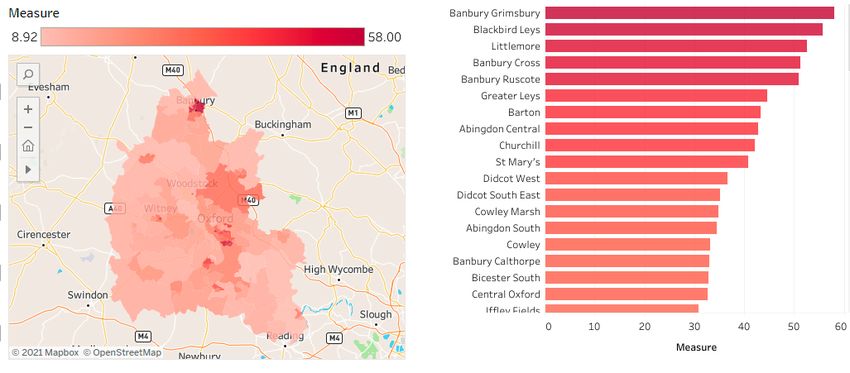
Oxfordshire Strategic Intelligence Assessment 2021
Introduction This report…
Summary NEW for this update
The Safer Oxfordshire Partnership works Interactive dashboard showing crime
Crime trends together to reduce crime and create safer data trends and maps for Oxfordshire
Comparisons with similar areas communities in Oxfordshire. Each year the built from Home Office crime open data
Partnership receives a summary of the latest tables and police.uk
Abuse and exploitation data on crime and community safety in a Use of hospital services related to knife
Hate crime Strategic Intelligence Assessment (SIA) for crime /assaults
Oxfordshire.
Knife crime With thanks to the SIA Steering Group and
Fraud and cyber-related crime This 2021 update of the SIA makes use of: to the analysts and service experts who
Crime data published by the Office for worked with us and provided advice and
Rural crime National Statistics in May 2021 (for year data extracts.
Road casualties ending December 2020) which allows for
SIA 2021 lead authors:
comparisons with national averages
Mental health Alick Bird, Insight Analyst, Cherwell
Locally sourced data on crimes, incidents District and Oxfordshire County
Alcohol and drugs and victims of crime from Thames Valley Council
Offending and re-offending Police, January to December 2020 Daisy Hickman, Insight Analyst and
Finding out more Doorstep Crime and Road traffic accident Intelligence Manager Trading
data from Oxfordshire County Council Standards, Oxfordshire County
Council
Public Health data on alcohol and drug Margaret Melling, Senior Research
use Officer, Cherwell District and
Offending and re-offending data from the Oxfordshire County Council
Ministry of Justice
Date of publication: last updated 24th June
2021
2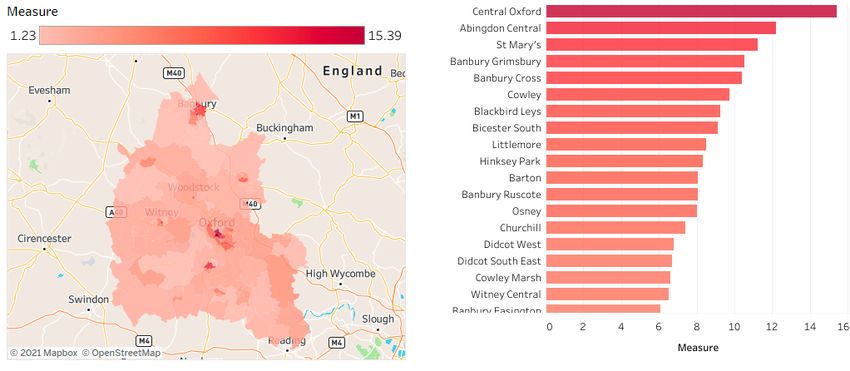
Oxfordshire Strategic Intelligence Assessment 2021

Summary

                                                          3
Oxfordshire Strategic Intelligence Assessment 2021
Introduction
Oxfordshire: total Oxfordshire total recorded crime by type1
Summary recorded crime1 42,889
Crime trends year ending Dec20
Comparisons with similar areas
Abuse and exploitation
Hate crime
Knife crime
Fraud and cyber-related crime
Rural crime
Road casualties
Mental health
Alcohol and drugs
Offending and re-offending
Finding out more Selected offences2 Road safety3
Alcohol-
1,817 317 Knife crimes 1,006 Road
related crime
casualties
Cyber-related 203 Killed or seriously
1,085 424 Rural crimes
offences injured
[1] ONS Police recorded crime to year ending Dec20 [2] Thames Valley Police Niche Jan-Dec 2020 [3] Oxfordshire County Council 2020
Icons designed by Freepik from Flaticon 4Oxfordshire Strategic Intelligence Assessment 2021
Introduction Summary – crime trends There have been significant increases in
Summary in cyber-related offences in Oxfordshire
Crime data to December 2020 for England and and in the number of scams reported by
Crime trends Wales, from both the national crime survey and Oxfordshire residents since the start of
national police recorded crime, shows a clear the COVID-19 pandemic.
Comparisons with similar areas impact of the first national COVID-19 lockdown
Abuse and exploitation in April/May 2020 with a fall in overall crime, Knife crime offences increased in
driven mainly by a decline in theft offences.
Hate crime Oxfordshire in year ending Dec20
Between year ending Dec 2019 and year ending (compared with the 3 year average for
Knife crime Dec 2020, police recorded crime in England 2017 to 2019) by +4%, the same change
Fraud and cyber-related crime and Wales decreased by 8%. In Oxfordshire as Thames Valley. Oxford City saw a
police recorded crime decreased from 44,200 15% decline in offences.
Rural crime to 42,889, a decline of 1,311 (-3%).
Road casualties There was a fall in the number of road
By district the change between 2019 and 2020 causalities and in alcohol-related road
Mental health was: Cherwell -2%; Oxford -11%; South
Oxfordshire -2%; Vale of White Horse +16% and traffic accidents in 2020
Alcohol and drugs West Oxfordshire -3%.
Police detentions under S136 of the
Offending and re-offending The increase in Vale of White Horse was mainly Mental Health Act increased
Finding out more due to an increase in violence against the significantly in 2020, particularly in
person offences. Vale of White Horse
Crime comparator data shows that Oxford had Adult and juvenile re-offending rates
the highest rate of overall crime of have continued to decline
Oxfordshire’s districts. Cherwell had above
average rates for several types of crime
(including drugs, shoplifting, and theft from Note: police recorded crime excludes offences that are
the person, as well as ‘other’ crime/theft). not reported to, or not recorded by, the police. Trends
can be influenced by changes in recording practices
making it difficult to make long-term comparisons.
5Oxfordshire Strategic Intelligence Assessment 2021
Introduction Summary – victims Oxfordshire: victims of crime
Summary year ending Dec20
Crime trends Comparing year ending Dec20 with the
average of the previous 3 years (2017 to 7,851 Victims of domestic abuse
Comparisons with similar areas 2019), shows increases in police recorded 3,608 Child victims of crime
Abuse and exploitation victims in Oxfordshire for most types of
abuse and exploitation. 996 Victims of hate crime
Hate crime
There were increases in the number of 555 Older victims of violence or sexual
Knife crime
victims of: offences (elder abuse)
Fraud and cyber-related crime Domestic abuse (+10%)
Rural crime Elder abuse (+55%) There has been a significant fall in the
Road casualties Rape (+7%) number of recorded child victims of crime
Mental health and a relatively large percentage increase
Modern slavery (+26%) in the number of older victims of crime
Alcohol and drugs Child Sexual Exploitation (+13%)
Offending and re-offending The number of knife crime victims fell
Hate crime (+24%) slightly in 2020. Knife crime victims were
Finding out more much more likely to be from a non-white
And decreases in the number of victims of: ethnic background than the population of
Honour-based violence Oxfordshire
Female Genital Mutilation
Doorstep crime / rogue traders
Knife crime
6Oxfordshire Strategic Intelligence Assessment 2021
Crime trends
7Oxfordshire Strategic Intelligence Assessment 2021
Introduction Sources of crime data
Summary There are two main sources of national crime data:
Crime trends 1. The Crime Survey for England and Wales (CSEW) – not available for Local Authority areas
Comparisons with similar areas As a result of the COVID-19 lockdowns, in 2020 the face-to-face CSEW was replaced
Abuse and exploitation with the Telephone-Operated Crime Survey (TCSEW).
Hate crime Estimates from the TCSEW are derived from telephone interviews conducted with
household residents in England and Wales aged 18 years and over between May and
Knife crime December 2020 inclusive.
Fraud and cyber-related crime TCSEW estimates are NOT directly comparable with estimates derived from the face-
to-face Crime Survey for England and Wales (CSEW).
Rural crime
2. Police recorded crime (PRC)
Road casualties
Police recorded crime data shows police activity only.
Mental health
Police data is useful for local crime pattern analysis and provide a good measure of
Alcohol and drugs well-reported crimes (for example, homicide, which is not covered by the Crime
Offending and re-offending Survey for England and Wales).
Finding out more PRC is considered to be “considerably affected” by changes in recording policy and
practice.
In this report we have used Office for National Statistics (ONS) reports on crime in England and
Wales in the 12 months to year ending December 2020 based on findings from the Telephone-
Operated Crime Survey for England and Wales (TCSEW) and police recorded crime. The majority
of this 12-month period was affected by the coronavirus (COVID-19) pandemic and related
lockdown restrictions.
ONS Crime in England and Wales - Office for National Statistics (ons.gov.uk) released 13 May 2021
Updated 8Oxfordshire Strategic Intelligence Assessment 2021
Introduction Telephone-Operated Crime Survey for England and Wales (TCSEW)
Summary
Data from the Telephone-Operated Crime Survey for England and Wales showed decreases in
Crime trends crime at the start of the pandemic, with rises seen over the summer months, specifically in
Comparisons with similar areas theft, following the easing of lockdown measures, with overall crime now similar to pre-
lockdown levels of January to March 2020.
Abuse and exploitation
Hate crime The significant fall in theft offences, Percentage of respondents aged 18+ to
reflects the increase in time people Telephone-Operated Crime Survey for
Knife crime spent at home during the lockdown England and Wales who were victims of all
Fraud and cyber-related crime period, a reduction in opportunities for crime and % victims of theft
Rural crime theft in public spaces and the closure of
the night-time economy. All crime (including fraud and computer misuse)
Road casualties
All theft offences
Mental health
Alcohol and drugs 8 6.9 6.8
5.6
Offending and re-offending 6
Finding out more %4
Crime in England and Wales - Office for National 2.6 2.5
Statistics (ons.gov.uk) 1.7
2
Coronavirus and crime in England and Wales - Office
for National Statistics (ons.gov.uk) 0
NOTE: TCSEW estimates are not directly comparable
with estimates derived from the face-to-face Crime January to April to June July to
Survey for England and Wales in previous years. March 2020 2020 September
As of May 2021, the TCSEW quarterly data for Oct- 2020
Dec 2020 was not yet available
Updated 9Oxfordshire Strategic Intelligence Assessment 2021
Introduction Police recorded crime – national (1)
Summary
Between year ending December 2019 and year ending December 2020:
Crime trends
Total police recorded crime in England and Wales decreased by 8%, driven mainly by the
Comparisons with similar areas COVID-19 lockdown in the period April to June 2020.
Abuse and exploitation Overall, theft offences fell by 26%.
Hate crime There were also falls in robbery offences (25% decrease), sexual offences (7%
Knife crime decrease) and criminal damage and arson (11% decrease)
Fraud and cyber-related crime There were rises in drug offences (15% increase) reflecting proactive police activity in
crime hotspots and a slight rise in violence against the person offences (2% increase)
Rural crime
Road casualties For lower volume crimes, police recorded crime data for the year ending December 2020
showed:
Mental health the number of homicides decreased by 12%; this fall was partly because of the single
Alcohol and drugs incident that took place in the previous year, October 2019, when the bodies of 39
migrants were found in a lorry in Grays, Essex; excluding this incident from the
Offending and re-offending
previous year’s homicide count (from 707 to 668 offences), the number of homicides
Finding out more shows a 6% decrease in the year ending December 2020 (625 offences)
a 9% decrease in the number of offences involving knives or sharp instruments
an 11% decrease in offences involving firearms
Crime in England and Wales - Office for
National Statistics (ons.gov.uk) Police Note: police recorded crime excludes offences that are not
recorded crime data, supplied by the Home reported to, or not recorded by, the police. Trends can be
Office, are not designated as National influenced by changes in recording practices making it difficult to
Statistics. make long-term comparisons.
Updated 10Oxfordshire Strategic Intelligence Assessment 2021
Introduction Police recorded crime – national (2)
Summary
The main crime types
Crime trends showing the impact of
Comparisons with similar areas the COVID-19 lockdown
period April to June 2020
Abuse and exploitation were Sexual offences,
Hate crime Robbery, Theft, Criminal
damage and Drug
Knife crime offences
Fraud and cyber-related crime
By December 2020, levels
Rural crime of most crime types were
Road casualties similar to the 2019
average. Theft and
Mental health Robbery each remained
Alcohol and drugs below average.
Offending and re-offending
Finding out more
Home Office – Police recorded crime
Police recorded crime data, supplied by
the Home Office, are not designated as
National Statistics.
New 11Oxfordshire Strategic Intelligence Assessment 2021
Introduction Crime trends - Oxfordshire
Summary
Between year ending Dec 2019 and year ending Dec 2020, police recorded crime in
Crime trends Oxfordshire decreased from 44,200 to 42,889, a decline of 1,311 (-3%)
Comparisons with similar areas By district the change between 2019 and 2020 was: Cherwell -2%; Oxford -11%; South
Abuse and exploitation Oxfordshire -2%; Vale of White Horse +16% and West Oxfordshire -3%
Hate crime
The increase in Vale of
Knife crime White Horse was mainly
due to an increase in Number of police recorded crime offences (excluding
Fraud and cyber-related crime fraud) by local authority (year ending December)
‘violence against the
Rural crime person’ offences
Road casualties
Mental health
Alcohol and drugs
Offending and re-offending
To explore this data please visit our
Finding out more interactive dashboard
Source ONS Crime in England and
Wales
Note: police recorded crime
excludes offences that are not
reported to, or not recorded by,
the police. Trends can be
influenced by changes in recording
practices making it difficult to
make long-term comparisons.
Updated 12Oxfordshire Strategic Intelligence Assessment 2021
Introduction Trend in crime and severity of crime in Oxfordshire (pre-pandemic)
Summary
Between 2018/19 and Crime Severity Score for total recorded crime
Crime trends
2019/20 (pre-pandemic) year ending March 2003 to year ending March 2020
Comparisons with similar areas the Crime Severity Score 18
Abuse and exploitation reduced nationally by 1%. 16
Across Thames Valley the
Crime Severity Score
14
Hate crime score increased by 6%. 12
Knife crime In Oxfordshire, the Crime
10
8
Fraud and cyber-related crime Severity Score increased in 6
Rural crime all districts, with South 4
Oxfordshire seeing the 2
Road casualties greatest increase of 13% 0
Mental health compared with the
previous year, however
Alcohol and drugs remaining below the England and Wales Thames Valley Cherwell
Offending and re-offending England and Wales
average. Oxford South Oxfordshire Vale of White Horse
Finding out more West Oxfordshire
The Crime Severity Score uses (the latest 5 years of) sentencing data – custodial sentences, community orders and fines -
from the Ministry of Justice as the primary source for calculating offence weights. Once the weights have been calculated
for each individual offence, these are multiplied by the number of incidents recorded by the police. For each year this is
then summed and divided by the mid-year population estimate, to give the Crime Severity Score.
Applying the Crime Severity Score upweights violence against the person, sexual offences and robbery and downweighs
theft, criminal damage & arson and other crimes against society.
ONS (released July 2020); Crime Severity Score
Updated 13Oxfordshire Strategic Intelligence Assessment 2021
Introduction Severity of crime by type and district
Crime Severity Score – Theft Offences (2019/20)
Summary In 2019/20, the Crime Severity Score
Crime trends for theft offences was greater in E&W average
Oxford (3.6) than England and Wales
Comparisons with similar areas
(3.5)
Abuse and exploitation
For sexual offences, the Crime
Hate crime Severity Score in Cherwell (4.3) and
Knife crime Oxford (6.1) were each greater than
that of England and Wales (4.2)
Fraud and cyber-related crime
Rural crime
Road casualties
Mental health Crime Severity Score – Sexual Offences (2019/20)
Alcohol and drugs
The Crime Severity Score uses (latest 5 years of)
Offending and re-offending sentencing data – custodial sentences, community orders
and fines - from the Ministry of Justice as the primary E&W average
Finding out more source for calculating offence weights. Once the weights
have been calculated for each individual offence, these
are multiplied by the number of incidents recorded by
the police. For each year this is then summed and
divided by the mid-year population estimate, to give the
Crime Severity Score.
Applying the Crime Severity Score upweights violence
against the person, sexual offences and robbery and
downweighs theft, criminal damage & arson and other
crimes against society. ONS (released July 2020); Crime Severity Score
Updated 14Oxfordshire Strategic Intelligence Assessment 2021
Introduction Change in police recorded crime by type - Oxfordshire
Summary
Crime trends Police recorded crime by
type shows the greatest Change in crime in Oxfordshire between (the average for)
Comparisons with similar areas percentage increases in the years 2017-2019 and year ending December 2020
Abuse and exploitation Oxfordshire between (an
average for) 2017-19 and
Hate crime year ending Dec20 for
Knife crime Stalking and Harassment
followed by Public order
Fraud and cyber-related crime offences.
Rural crime
Note that some of these
Road casualties increases/ decreases will
Mental health be due to changes in
recording. To explore this data
Alcohol and drugs
Population change will visit our interactive
Offending and re-offending dashboard
have only had a small
Finding out more effect. Between 2017
and 2019 the population
of Oxfordshire increased
by 1.4%
Source: Home Office Police Recorded Crime Statistics; ONS population estimates NOTES Small
counts for Homicide (5 in 2020) and Death or injury - unlawful driving (5 in 2020). In 2017, “Stalking
and Harassment” offences were moved out of the sub-category of “violence without injury” and into a
separate sub-category
Updated 15Oxfordshire Strategic Intelligence Assessment 2021
Introduction Stalking and Harassment – trend
Stalking and Jan-Dec Jan-Dec
Summary Harassment Offences 2019 2020
The latest quarterly data for police recorded
Crime trends Stalking and Harassment (Home Office CSP data) Cherwell 852 1,259
Comparisons with similar areas shows significant increases for all districts in Oxford City 730 1,160
Oxfordshire South Oxfordshire 501 766
Abuse and exploitation Between Jan-Dec 2019 and Jan-Dec 2020, the
Vale of White Horse 473 860
Hate crime number of Stalking and Harassment offences
increased by 58% across Oxfordshire West Oxfordshire 431 660
Knife crime Oxfordshire 2,987 4,705
Some of this change is likely to be a result of
Fraud and cyber-related crime changes in recording practice
Rural crime
Stalking and Harassment Offences by
Road casualties
district (count) by quarter to Dec 2020
Mental health
Alcohol and drugs
Offending and re-offending
Finding out more
Source: Home Office Police Recorded Crime Statistics; In 2017, “Stalking and Harassment” offences were
moved out of the sub-category of “violence without injury” and into a separate sub-category. To explore this
data visit our interactive dashboard
New 16Oxfordshire Strategic Intelligence Assessment 2021
Introduction Violence and Sexual offences - hotspots
Summary
The crime type of Violence and Sexual offences includes Stalking and Harassment.
Crime trends
The areas of Oxfordshire with the highest rates per population of police recorded Violence
Comparisons with similar areas and Sexual offences (Jan-Dec 2020) were the Middle Super Output Areas1 of Banbury
Abuse and exploitation Grimsbury, Blackbird Leys and Littlemore, Banbury Cross and Banbury Ruscote
Hate crime These parts of Banbury and Oxford also include areas ranked as relatively deprived2
Knife crime
Fraud and cyber-related crime Rate of police recorded Violence and Sexual offences per 1000 population for
Middle Layer Super Output Areas in Oxfordshire (Jan-Dec 2020)
Rural crime
Road casualties
Mental health Oxford
Alcohol and drugs From data.police.uk
Offending and re-offending To explore this data visit
our interactive
Finding out more dashboard
[1] There are 86 Middle
Layer Super Output
Areas in Oxfordshire
similar in size to wards,
see Oxfordshire Insight
guide to geography
[2] MHCLG IMD 2019
New 17Oxfordshire Strategic Intelligence Assessment 2021
Introduction Public Order offences – trend
Summary
The latest quarterly data for police recorded Public Order offences (Home Office CSP data)
Crime trends shows significant increases for all districts in Oxfordshire
Comparisons with similar areas The district with the highest rate per population was Oxford City which saw a dip in rates in
Abuse and exploitation Apr-June 2020, followed by increases in Jul-Sept 2020 and in Oct-Dec 2020
Hate crime
Knife crime Public Order Offences by district (rate per 1000 population) by quarter to Dec 2020
Fraud and cyber-related crime
Rural crime
Road casualties
Mental health
Alcohol and drugs
Offending and re-offending
Finding out more
Source: Home Office Police Recorded Crime Statistics To explore this data visit our interactive dashboard
New 18Oxfordshire Strategic Intelligence Assessment 2021
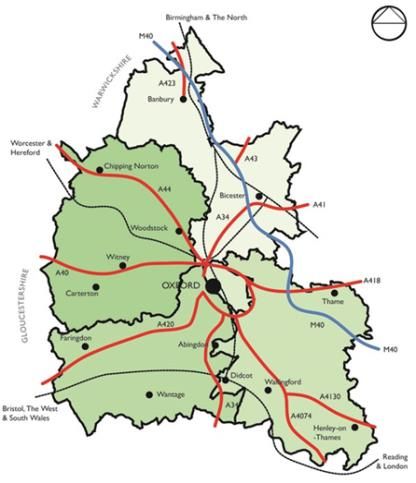
Introduction Public Order offences - hotspots
Summary
The areas of Oxfordshire with the highest rates of police recorded Public Order offences
Crime trends (Jan-Dec 2020) were mainly retail areas in Oxfordshire, including Central Oxford and
Comparisons with similar areas Abingdon Central Middle Layer Super Output Areas1
Abuse and exploitation
Rate of police recorded Public Order offences per 1000 population
Hate crime for Middle Layer Super Output Areas in Oxfordshire (Jan-Dec 2020)
Knife crime
Fraud and cyber-related crime
Oxford
Rural crime
Road casualties
Mental health
Alcohol and drugs
Offending and re-offending
Finding out more
From data.police.uk To explore this data visit our interactive dashboard [1] There are 86 Middle Layer Super
Output Areas in Oxfordshire similar in size to wards, see Oxfordshire Insight guide to geography
New 19Oxfordshire Strategic Intelligence Assessment 2021
Comparisons with similar
areas
20Oxfordshire Strategic Intelligence Assessment 2021
Introduction Comparison with similar areas: all crime
Summary
Police.uk publish statistics showing how crime rates for Community Safety Partnerships
Crime trends (equivalent to Oxfordshire’s districts) compare with similar Partnerships.
Comparisons with similar areas Based on these statistics for the year ending September 2020, out of all of Oxfordshire’s
Abuse and exploitation districts, Oxford had the highest absolute rate of crime. However, when each district is
compared to a group of districts with similar demographics and levels of deprivation, etc.,
Hate crime
Cherwell had a more unusually high rate of crime than the other Oxfordshire districts.
Knife crime
Rates of all crime per 1,000 population, for Oxfordshire Districts (Community Safety
Fraud and cyber-related crime
Partnerships) with similar area comparisons2
Rural crime
Road casualties
Mental health
Alcohol and drugs
Offending and re-offending
Finding out more
Note that this data is
no longer available
from HMICFRS and
Police.uk What’s happening in your area? (Data as of year ending September 2020) has been extracted
[1] How Most Similar Groups are formed [2] Calculating the red and green lines from police.uk
Updated 21Oxfordshire Strategic Intelligence Assessment 2021
Introduction Comparison with similar areas: types of crime
Summary
For individual types of crime, although Oxford generally has the highest rates, when
Crime trends compared to similar areas, Cherwell has higher rates for more types of crime (including
Comparisons with similar areas drugs, shoplifting, and theft from the person, as well as ‘other’ crime/theft).
Abuse and exploitation Rates of crime per 1,000 population, for Oxfordshire Districts
Hate crime (Community Safety Partnerships) with similar area comparisons1
Knife crime South Vale of White West
Fraud and cyber-related crime Cherwell Oxford Oxfordshire Horse Oxfordshire
Key All crime 70.66 99.31 49.95 47.2 44.88
Rural crime Bicycle theft 0.80 7.87 0.73 0.84 0.69
Road casualties - higher Burglary 3.08 4.92 3.77 2.52 2.91
Mental health rate than Criminal damage and arson 6.84 7.94 6.51 5.74 5.91
normal2 when Drugs 3.32 4.54 1.74 2.21 1.74
Alcohol and drugs compared to Other crime 2.14 1.85 1.02 1.08 0.82
Offending and re-offending similar areas Other theft 6.84 8.25 4.99 3.10 4.26
Possession of weapons 0.65 1.27 0.43 0.44 0.42
Finding out more – lower
Public order 4.19 7.67 3.22 3.90 3.45
rate than
normal2 when Robbery 0.39 0.91 0.33 0.15 0.28
compared to Shoplifting 6.72 10.78 2.55 2.33 2.20
similar areas Theft from the person 1.13 2.88 0.79 0.58 0.59
Vehicle crime 4.96 8.01 4.93 2.70 2.82
Violence and sexual offences 29.61 32.42 18.93 21.6 18.78
Police.uk What’s happening in your area? (Data as of year ending September 2020); [1] How Most Similar
Groups are formed [2] “Calculating the red and green lines” (at bottom of page)
Updated 22Oxfordshire Strategic Intelligence Assessment 2021
Abuse and exploitation
23Oxfordshire Strategic Intelligence Assessment 2021
Introduction Victims of abuse and exploitation - summary
Summary
Comparing year ending December 2020 with the average of the previous 3 years (2017 to
Crime trends 2019), shows an increase in the number of police recorded victims of domestic abuse, elder
Comparisons with similar areas abuse, rape, modern slavery and child sexual exploitation in Oxfordshire.
Abuse and exploitation There was a decrease in the number of recorded victims of honour-based violence and
female genital mutilation.
Hate crime
Knife crime
Fraud and cyber-related crime Number of police recorded victims1 of abuse and
exploitation in Oxfordshire 2018, 2019 and 2020 (Jan-Dec)
Rural crime
Change from average
Road casualties
Recorded victims of.. 2017 2018 2019 2020 of 2017-19 to 2020
Mental health
domestic abuse 6,986 7,163 7,285 7,851 +706 +10%
Alcohol and drugs
elder abuse 250 403 410 555 +198 +55%
Offending and re-offending
rape crimes 428 473 508 503 +33 +7%
Finding out more
modern slavery 99 124 132 149 +31 +26%
child sexual exploitation 83 106 60 94 +11 +13%
honour-based violence 47 33 34 24 -14 -37%
female genital mutilation 5 6 2 1 -3 -77%
Thames Valley Police Crime Recording System - Niche RMS; [1] count is of total recorded unique victims in the
12 month period, whether or not individuals have been a victim more than once
Updated 24Oxfordshire Strategic Intelligence Assessment 2021
Introduction Repeat victimisation
Summary
Over a quarter of victims of domestic abuse and almost one in five of victims of CSE were
Crime trends subject to repeat occurrences in Oxfordshire in 2020.
Comparisons with similar areas
29% of victims of domestic abuse in Oxfordshire were recorded at least twice in 2020 and
Abuse and exploitation 13% were a victim of an occurrence on three or more occasions.
Hate crime
Knife crime
Proportion of
Fraud and cyber-related crime victims1 by
Rural crime number of times
Road casualties recorded as a
victim Jan-Dec
Mental health 2020
Alcohol and drugs
Offending and re-offending
Finding out more
Thames Valley Police Crime
Recording System - Niche
RMS (extracted April 2021)
CSE = Child Sexual
Exploitation
[1] Proportion of total unique
victims
Updated 25Oxfordshire Strategic Intelligence Assessment 2021
Introduction Domestic Abuse and COVID-19 - national
Summary
ONS findings
Crime trends
Police recorded crime data show an increase in offences flagged as domestic abuse-related
Comparisons with similar areas during the coronavirus (COVID-19) pandemic, however, there has been a gradual increase in
Abuse and exploitation police recorded domestic abuse-related offences over recent years as police have improved
their recording of these offences; therefore it cannot be determined whether this increase
Hate crime
can be directly attributed to the coronavirus pandemic.
Knife crime
There has generally been an increase in demand for domestic abuse victim services during
Fraud and cyber-related crime the coronavirus pandemic, particularly affecting helplines as lockdown measures eased; this
Rural crime does not necessarily indicate an increase in the number of victims, but perhaps an increase
in the severity of abuse being experienced, and a lack of available coping mechanisms such
Road casualties
as the ability to leave the home to escape the abuse, or attend counselling.
Mental health
Alcohol and drugs
Offending and re-offending
Finding out more
Domestic abuse during the coronavirus (COVID-19) pandemic, England and Wales - Office for National Statistics
(ons.gov.uk)
New 26Oxfordshire Strategic Intelligence Assessment 2021
Introduction Victims of domestic abuse – Oxfordshire trend
Summary
In 2020 (Jan-Dec) Thames Valley Police recorded a total of 7,851 victims of domestic abuse
Crime trends in Oxfordshire
Comparisons with similar areas This was 10% above the 3 year average for the years 2017 to 2019, with the greatest
Abuse and exploitation increases in Vale of White Horse (+26%) and Cherwell (11%)
Hate crime
Count of police recorded victims1 of domestic abuse
Knife crime
(all occurrences)
Fraud and cyber-related crime
Rural crime
Road casualties
Mental health
Alcohol and drugs
Offending and re-offending
Finding out more
Thames Valley Police Crime Recording System - Niche RMS; [1] count is of total recorded unique victims in
the 12 month period, whether or not individuals have been a victim more than once
Updated 27Oxfordshire Strategic Intelligence Assessment 2021
Introduction Victims of domestic abuse – district comparison
Summary
The rate (per 1,000 population) of domestic abuse victims, for year ending December 2020,
Crime trends was highest in Cherwell (13.4 per 1,000 population)
Comparisons with similar areas Cherwell district’s rate per 1000 population in 2020 was above the Thames Valley rate
Abuse and exploitation (13.0), the Oxfordshire rate (11.4) and above Oxford (12.6), Vale of White Horse (10.8),
West Oxfordshire (9.7), and South Oxfordshire (9.7).
Hate crime
Knife crime
Fraud and cyber-related crime
Rural crime Police recorded
victims1 of domestic
Road casualties abuse (all
Mental health occurrences), rate
Alcohol and drugs per 1,000
population
Offending and re-offending
Finding out more
Thames Valley Police Crime Recording System - Niche RMS; ONS 2019 mid year population estimates (Note
that rates for 2019 and 2020 each use the 2019 pop estimate) [1] Total recorded unique victims in the 12
month period, whether or not individuals have been a victim more than once
Updated 28Oxfordshire Strategic Intelligence Assessment 2021
Introduction Victims and perpetrators of domestic abuse by gender
Summary
In year ending December 2020 in Oxfordshire, females remain more likely to be victims of
Crime trends domestic abuse and males more likely to be perpetrators, however, in each case, almost a
Comparisons with similar areas third were of a different gender:
29% of recorded domestic abuse victims in Oxfordshire were males
Abuse and exploitation
29% of recorded suspects/offenders were females
Hate crime
Knife crime Victims1 of domestic abuse Perpetrators1 (suspects and
Fraud and cyber-related crime in Oxfordshire, by gender offenders) of domestic abuse
(Jan-Dec 2020) in Oxfordshire, by gender
Rural crime
(Jan-Dec 2020)
Road casualties
Mental health
Alcohol and drugs
Offending and re-offending
Finding out more
Thames Valley Police Crime Recording System - Niche RMS; ONS 2019 mid year population estimates (Note that
rates for 2019 and 2020 each use the 2019 pop estimate) [1] Total recorded unique victims or perpetrators in the
12 month period, whether or not individuals have been a victim/perpetrator more than once
Updated 29Oxfordshire Strategic Intelligence Assessment 2021
Introduction Victims and perpetrators of domestic abuse by age
Summary In year ending December 2020 in Oxfordshire, the overall age profile of victims and
Crime trends perpetrators (as % of total) shows some differences, with perpetrators more likely to be in
the broad age range 25 to 44.
Comparisons with similar areas
Abuse and exploitation
Hate crime Domestic abuse perpetrators and victims by broad age
Oxfordshire (Jan-Dec 2020), as % of total
Knife crime
compared with the distribution of population by age
Fraud and cyber-related crime
Rural crime
Road casualties
Mental health
Alcohol and drugs
Offending and re-offending
Finding out more
Thames Valley Police Crime Recording System - Niche RMS; ONS mid-2019 population estimates from nomis
Total recorded unique victims or perpetrators in the 12 month period, whether or not individuals have
been a victim/perpetrator more than once
Updated 30Oxfordshire Strategic Intelligence Assessment 2021
Police recorded domestic crimes involving
Introduction Domestic abuse affecting children
children, by district per year
Summary There has been a consistent and significant 2018/ 2019/ 2018/19 to Per
Crime trends upward trend in the number of police 19 20 2019/20 pop
recorded domestic abuse crimes in
Comparisons with similar areas Oxfordshire involving children
Cherwell 726 884 158 22% 0.59%
Oxford 735 767 32 4% 0.50%
Abuse and exploitation
Reports from organisations such as the
Hate crime NSPCC indicate a rise in calls to helplines South Oxfordshire 470 574 104 22% 0.40%
Knife crime and highlight the increased risk to children Vale of White Horse 481 533 52 11% 0.39%
of abuse during the lockdown.
Fraud and cyber-related crime West Oxfordshire 447 480 33 7% 0.43%
Rural crime This may be a result of a genuine increase,
or changes in recording practice or both. Oxfordshire 2,859 3,238 379 13% 0.47%
Road casualties
The district with the highest rate per
Mental health population in 2019/20 was Cherwell Number of police recorded domestic abuse incidents
Alcohol and drugs and crimes involving children, Oxfordshire per quarter
Offending and re-offending Q3 Oct-Dec 2020 saw a
drop in both DA
Finding out more incidents and crimes
involving children
Thames Valley Police Crime
Recording System - Niche RMS
NSPCC Report
ONS mid-2019 population
estimates from nomis
From JSNA 31Oxfordshire Strategic Intelligence Assessment 2021
Introduction Victims of rape crimes
Summary
In 2020 (Jan-Dec) Thames Valley Police recorded a total of 503 victims of rape crimes in
Crime trends Oxfordshire. This was 7% above the 3 year average (for the years 2017 to 2019), with the
Comparisons with similar areas greatest increases in Vale of White Horse (+25%) and Cherwell (+10%)
Abuse and exploitation 91% of victims were female
Hate crime 54% of victims were aged under 25
Knife crime
Fraud and cyber-related crime
Rural crime Recorded victims1 of rape crimes
Road casualties
Mental health
Alcohol and drugs
Offending and re-offending
Thames Valley Police Crime
Finding out more Recording System - Niche
RMS. Year is Jan-Dec. NOTE:
that police recorded rape is
at the time of reporting
rather than time of offence.
[1] Total recorded unique
victims in the 12 month
period, whether or not
individuals have been a victim
more than once
Updated 32Oxfordshire Strategic Intelligence Assessment 2021
Introduction Female genital mutilation, forced marriage and honour based violence
Summary
In 2020 (Jan-Dec) Thames Valley Police recorded a total of:
Crime trends 1 victim of Female Genital Mutilation in Oxfordshire, down from 2 in 2019;
Comparisons with similar areas No victims of forced marriage in Oxfordshire (none in 2018 and 2019);
Abuse and exploitation 24 victims of honour-based violence in Oxfordshire, mainly in Cherwell and Oxford
Hate crime (see table below). This was well below the number in 2019 (34).
Knife crime
Fraud and cyber-related crime Recorded victims of Honour-based violence
Rural crime (Crime and non Crime)
Note: According to the Crown Prosecution
Road casualties Service guidance: 2016 2017 2018 2019 2020
2019 to
There is no specific offence of "honour- 2020
Mental health based crime". It is an umbrella term to Cherwell 13 7 10 18 10 -8
Alcohol and drugs encompass various offences covered by
existing legislation. Honour-based Oxford 28 33 19 11 13 2
Offending and re-offending violence (HBV) can be described as a
collection of practices, which are used to South Oxfordshire 1 3 0 2 0 -2
Finding out more control behaviour within families or other
social groups to protect perceived Vale Of White Horse 8 2 2 2 1 -1
cultural and religious beliefs and/or
honour. Such violence can occur when West Oxfordshire 0 2 2 1 0 -1
perpetrators perceive that a relative has
shamed the family and/or community by Oxfordshire 50 47 33 34 24 -10
breaking their honour code.
Thames Valley Police Crime Recording System - Niche RMS Note: The above HBV data is a count of unique
victims of offences where either the HBV Latest or HBV Finalisation qualifier has been used or the Occurrence
Type or Classification has been recorded as Honour Based Violence - Non Crime Occurrence.
Updated 33Oxfordshire Strategic Intelligence Assessment 2021
Introduction Modern Slavery
Summary
In 2020 (Jan-Dec) Thames Valley Police recorded a total of 149 victims of Modern Slavery in
Crime trends Oxfordshire.
Comparisons with similar areas This was 26% above the 3 year average (for the years 2017 to 2019), with the greatest
Abuse and exploitation increases in Oxford City (+57%) and Cherwell (+20%)
Hate crime
Recorded victims1 of Modern Slavery and Trafficking -
Knife crime All Occurrences (Crime and Non Crime)
Fraud and cyber-related crime
According to the Home Office Modern
Rural crime Slavery awareness booklet Modern Slavery
Road casualties is a serious and often hidden crime in
which people are exploited for criminal
Mental health gain. The impact can be devastating for
the victims.
Alcohol and drugs Modern slavery comprises slavery,
servitude, forced and compulsory labour
Offending and re-offending and human trafficking.
There were an estimated 40 million
Finding out more people in slavery globally in 2016 and
10,000 –13,000 potential victims in the UK,
however many victims are not identified
or reported.
Thames Valley Police Crime Recording System - Niche RMS. The above data is for a count of unique victims of
Modern Slavery and Trafficking offences. Modern Slavery offences have been identified where either the HO
Category Number is 106 or the Modern Slavery Finalisation Qualifier has been used. Trafficking offences have
been identified where either the classification or Occurrence Type has been recorded as trafficking for
exploitation or sexual exploitation, into, out of or within the UK. [1] Total recorded unique victims in the 12
month period, whether or not individuals have been a victim more than once
Updated 34Oxfordshire Strategic Intelligence Assessment 2021
Introduction Child Sexual Exploitation
Summary
In 2020 (Jan-Dec) Thames Valley Police recorded a total of 94 victims of Child Sexual
Crime trends Exploitation in Oxfordshire.
Comparisons with similar areas This was 13% above the 3 year average (for the years 2017 to 2019), with the greatest
Abuse and exploitation increases in West Oxfordshire (+112%), Cherwell (+57%) and Vale of White Horse (+50%)
Hate crime
Recorded victims1 of Child Sexual Exploitation All
Knife crime
Note: The definition of Child Sexual
Occurrences (Crime and Non Crime)
Fraud and cyber-related crime Exploitation from government guidance
is: Child sexual exploitation is a form of
Rural crime child sexual abuse. It occurs where an
individual or group takes advantage of
Road casualties an imbalance of power to coerce,
Mental health manipulate or deceive a child or young
person under the age of 18 into sexual
Alcohol and drugs activity (a) in exchange for something
the victim needs or wants, and/or (b)
Offending and re-offending for the financial advantage or increased
status of the perpetrator or facilitator.
Finding out more The victim may have been sexually
exploited even if the sexual activity
appears consensual. Child sexual
exploitation does not always involve
physical contact; it can also occur
through the use of technology.
Thames Valley Police Crime Recording System - Niche RMS. The above CSE data is for all victims of offences
where either the 'Child Sexual Exploitation' qualifier has been used or the Occurrence Type has been recorded as
'Suspected CSE - Non Crime Incident’ [1] Total recorded unique victims in the 12 month period, whether or not
individuals have been a victim more than once
Updated 35Oxfordshire Strategic Intelligence Assessment 2021
Introduction Child victims of crime
Summary
In 2020 (Jan-Dec) Thames Valley Police recorded a total of 3,608 child victims (aged 0-17) of
Crime trends all crimes in Oxfordshire
Comparisons with similar areas This was 13% below the 3 year average (for the years 2017 to 2019), with the greatest falls
Abuse and exploitation in Oxford City (-30%), Cherwell (-8%) and West Oxfordshire (-8%)
Hate crime
Knife crime Number of children (aged 0-17) recorded by Thames
Fraud and cyber-related crime Valley Police as victims1 of crime in Oxfordshire
Rural crime
Road casualties
Mental health
Alcohol and drugs
Offending and re-offending
Finding out more
Thames Valley Police Crime Recording System - Niche RMS. [1] Total recorded unique victims in the 12 month
period, whether or not individuals have been a victim more than once
Updated 36Oxfordshire Strategic Intelligence Assessment 2021
Introduction Older Victims of Abuse
Summary In 2020 (Jan-Dec) Thames Valley Police recorded a total of 555 older victims (aged 65 and over) of
Crime trends crimes of violence or sexual offences in Oxfordshire.
Comparisons with similar areas This was 57% above the 3 year average (for the years 2017 to 2019), above the increase across
Thames Valley (+45%) and with the greatest increases in Cherwell (+81%), South Oxfordshire (+57%)
Abuse and exploitation and Oxford City (+56%)
Hate crime The increase is above the growth in the older population in Oxfordshire.
Knife crime The rate of older victims of abuse per 1,000 population aged 65+ was highest in Oxford City (6.9
Fraud and cyber-related crime compared with 4.3 in Oxfordshire and 4.8 across Thames Valley)
Rural crime
Road casualties Recorded victims1
Mental health aged 65 or over of
violence against the
Alcohol and drugs person or sexual
Offending and re-offending offences (crimes)
Finding out more
Thames Valley Police Crime Recording System - Niche RMS. [1] Total recorded unique victims in the 12 month
period, whether or not individuals have been a victim more than once
Updated 37Oxfordshire Strategic Intelligence Assessment 2021
Introduction Victims of doorstep crime Top 5 Goods Service Areas used by
rogue traders in Oxfordshire 2019-20
Summary In 2019-20 there were 212 victims of doorstep Product
Crime trends crime or rogue traders in Oxfordshire, down from Selling
12%
277 in the previous year, a fall of 23% (-65). Garden and
Comparisons with similar areas Landscaping Roofing
34%
Abuse and exploitation The most likely reason for a decrease in victims is (including
tree care)
a reduction in resource to the doorstep crime 15%
Hate crime team in 2016.
Knife crime
The majority of victims continue to be elderly Building
Fraud and cyber-related crime residents. 15%
Driveways
Rural crime Count of victims of doorstep crime and rogue
and Patios
24%
Road casualties traders in Oxfordshire
140 *The category ‘product selling’
Mental health refers mostly to ‘Nottingham
120 knockers’ who target mostly elderly/
Alcohol and drugs vulnerable residents to sell cleaning
100 or kitchen products. This is often
Offending and re-offending linked to burglaries.
80
Finding out more 60
40
20
0
2012-13 2013-14 2014-15 2015-16 2016-17 2017-18 2018-19 2019-20
Cherwell Oxford City South Oxfordshire
Vale of White Horse West Oxfordshire Oxfordshire County Council Trading Standards
Updated 38Oxfordshire Strategic Intelligence Assessment 2021
Introduction Profiling victims of doorstep crime in
Business practice used by offender
Summary Oxfordshire
High pressure sales 41
Crime trends 12 months of data (01/04/2020 –
01/04/2021) from Trading Standards
Comparisons with similar areas highlights the tactics used by
Failure to observe cancellation
33
rights
Abuse and exploitation doorstep criminals.
Failure to provide written
Hate crime 191 intelligence reports were 31
quotation
Knife crime analysed for this period where the
primary area was ‘Doorstep Crime’. Charging more than is
Fraud and cyber-related crime reasonable
23
Rural crime High pressure selling was the most
commonly used tactic (28% n.41) by False statements or misleading
19
Road casualties doorstep criminals. High pressure omissions
Mental health selling is where the salesperson
exerts relentless and persistent Approach method used by offender
Alcohol and drugs pressure upon the customer, using
Offending and re-offending inducements and psychological Unsolicited doorstep 54
pressure to gain a fast sale.
Finding out more Solicited following leaflet drop 18
Unsolicited doorstep was the most
commonly used approach method Solicited following a phone call 8
(61% n.54). Unsolicited doorstep
means that the doorstep approach Solicited following
5
advertisement
was not asked for.
Unsolicited telephone 4
Note: business practice may have multiple
values per offence Trading Standards – Community Safety IDB (Intelligence Database)
New 39Oxfordshire Strategic Intelligence Assessment 2021
Introduction Doorstep victims in Oxfordshire
Summary
Crime trends 27% (53) of intelligence reports in Victim description as % of those recorded (2020/21)
Comparisons with similar areas 2020/21 had information relating
to the victim. Vulnerable Other
Abuse and exploitation Vulnerable
Sole
Hate crime Unfortunately, due to lack of Occupier Person(s)
recording or insufficient Vulnerable
Person - 2% 9%
Knife crime information there are 138 Repeat
intelligence reports that had no Physical
Fraud and cyber-related crime Disability Victimisation
victim details. 2%
Rural crime 4%
Road casualties Most of the victims of doorstep Tenant
crime recorded (43) were a 2%
Mental health ‘vulnerable older person’.
Alcohol and drugs
Offending and re-offending
Finding out more
Vulnerable
Older
Person
81%
Trading Standards – Community Safety IDB (Intelligence Database)
Updated 40Oxfordshire Strategic Intelligence Assessment 2021
Hate crime
41Oxfordshire Strategic Intelligence Assessment 2021
Introduction Hate crime - national
Summary Hate crime is defined as ‘any criminal offence which is perceived, by the victim or any other person, to be
motivated by hostility or prejudice towards someone based on a personal characteristic.’
Crime trends
This common definition was agreed in 2007 by the police, Crown Prosecution Service, Prison Service (now
Comparisons with similar areas the National Offender Management Service) and other agencies that make up the criminal justice system.
Abuse and exploitation There are five centrally monitored strands of hate crime:
Hate crime race or ethnicity sexual orientation
religion or beliefs disability
Knife crime
transgender identity
Fraud and cyber-related crime
Rural crime The Home Office October 2020 hate crime statistical bulletin reports that..
Increases in police recorded hate crime in recent years have been driven by
Road casualties improvements in crime recording and a better identification of what constitutes a
Mental health hate crime
In contrast, the Crime Survey for England & Wales, which is not affected by changes
Alcohol and drugs in crime recording, shows a long-term decline in hate crime, with a 38% fall in these
Offending and re-offending incidents between the combined year ending March 2008 and year ending March 2009
and the combined year ending March 2018, year ending March 2019 and year ending
Finding out more March 2020 surveys.
From the CSEW it is estimated that 47% of hate crime incidents came to the attention
of the police, a higher proportion than for all CSEW crime (38%).
Victims of hate crime were more likely to report being affected by the incident, 36%
of hate crime victims said they were “very much” affected emotionally following the
incident compared with 15% for all CSEW crime.
Hate crime, England and Wales, 2019 to 2020 - GOV.UK (www.gov.uk)
Updated 42Oxfordshire Strategic Intelligence Assessment 2021
Introduction Victims of hate crime – Oxfordshire by type
Summary
In year ending December 2020, Thames Valley Police recorded a total of 996 victims of hate
Crime trends crime (crime and non-crime occurrences) in Oxfordshire.
Comparisons with similar areas This was a 24% increase in 2020 compared with the average of the previous 3 years (2017-
Abuse and exploitation 19), likely to have been affected by improvements in recording. Across Thames Valley the
increase was +19%.
Hate crime
Knife crime
Recorded victims of
Fraud and cyber-related crime hate crime offences in
Rural crime Oxfordshire (all
Road casualties occurrences)
Mental health
Alcohol and drugs
Offending and re-offending
Finding out more
Thames Valley Police Crime Recording System - Niche RMS extracted 23/4/21 Notes: The data counts people
who have been victims of hate crime on multiple occasions as one individual. However someone may be a
victim of an offence where multiple hate crime qualifiers have been applied, i.e. someone could be a victim of
an occurrence where both the Race and Faith qualifiers have been applied to the occurrence, therefore this will
reflect in the figures for both qualifiers. “Victim” of a hate crime may be an organisation i.e. racist graffiti on
council property will not have a person listed as a victim.
Updated 43Oxfordshire Strategic Intelligence Assessment 2021
Introduction Victims of hate crime – trend by district
Summary
All districts in Oxfordshire saw an increase in recorded victims of hate crime
Crime trends occurrences (Dec20 compared with 3 year average 2017-19), with the greatest increases
Comparisons with similar areas in West Oxfordshire (+53%), South Oxfordshire (+47%) and Vale of White Horse (+47%),
compared with +24% for Oxfordshire overall
Abuse and exploitation
Hate crime
Recorded victims of
Knife crime
hate crime offences by
Fraud and cyber-related crime district (all
Rural crime occurrences)
Road casualties
Mental health
Alcohol and drugs
Offending and re-offending
Finding out more
Thames Valley Police Crime Recording System - Niche RMS extracted 23/4/21 Notes: The data counts people
who have been victims of hate crime on multiple occasions as one individual. However someone may be a
victim of an offence where multiple hate crime qualifiers have been applied, i.e. someone could be a victim of
an occurrence where both the Race and Faith qualifiers have been applied to the occurrence, therefore this will
reflect in the figures for both qualifiers. “Victim” of a hate crime may be an organisation i.e. racist graffiti on
council property will not have a person listed as a victim.
Updated 44Oxfordshire Strategic Intelligence Assessment 2021
Introduction Victims of hate crime
Summary
In year ending Dec 2020, demographic details of recorded victims of all types of hate crime
Crime trends (all occurrences) in Oxfordshire shows…
Comparisons with similar areas By gender
Abuse and exploitation 53% of hate crime victims were males and 39% were females (8% not recorded).
Hate crime
By age
Knife crime 69% of hate crime victims were aged 18 to 64
Fraud and cyber-related crime 6% were children and young people aged 0-17 and a further 12% were aged 18-24
Rural crime 3% were older people aged 65 and over
Road casualties
By ethnic background
Mental health
It is not possible to present data by ethnic background as three quarters of victims
Alcohol and drugs (76%) did not have an ethnic group recorded
Offending and re-offending
Finding out more
Thames Valley Police Crime Recording System - Niche RMS extracted 23/4/21 Notes: The data counts people
who have been victims of hate crime on multiple occasions as one individual. However someone may be a
victim of an offence where multiple hate crime qualifiers have been applied, i.e. someone could be a victim of
an occurrence where both the Race and Faith qualifiers have been applied to the occurrence, therefore this will
reflect in the figures for both qualifiers. “Victim” of a hate crime may be an organisation i.e. racist graffiti on
council property will not have a person listed as a victim.
Updated 45Oxfordshire Strategic Intelligence Assessment 2021
Knife crime
46Oxfordshire Strategic Intelligence Assessment 2021
Introduction Knife Crime Offences
Summary
In year ending December 2020, there were 317 violent, sexual and robbery offences
Crime trends recorded in Oxfordshire where a sharp or bladed implement was linked to the offence as a
Comparisons with similar areas weapon. Compared with the 3 year average for 2017 to 2019, this was a 4% increase, the
same as the change across Thames Valley.
Abuse and exploitation
Oxford City saw a 15% decline in offences. The greatest % increases were in South
Hate crime
Oxfordshire and Vale of White Horse districts.
Knife crime
Fraud and cyber-related crime Violent, sexual and robbery offences recorded in Oxfordshire where a sharp or bladed
implement was linked to the offence as a weapon (Jan-Dec)
Rural crime
Change from
Road casualties 2016 2017 2018 2019 2020 average of 2017-19
to 2020
Mental health
Cherwell 45 77 79 71 84 +8 +11%
Alcohol and drugs
Oxford 91 114 131 159 114 -21 -15%
Offending and re-offending South Oxfordshire 25 32 31 34 59 +27 +82%
Finding out more Vale of White Horse 23 24 37 36 40 +8 +24%
West Oxfordshire 18 20 34 35 20 -10 -33%
Oxfordshire 202 267 312 335 317 +12 +4%
Thames Valley 971 1,240 1,477 1,560 1,487 +61 +4%
Source: Thames Valley Police Crime Recording System - Niche RMS extracted January 2021. Note: the above
information is for knife crime offence that meet the Home Office definition. These are certain violent
offences, sexual offences and robbery offences where a sharp, pointed or bladed instrument has been used to
pierce the skin or used as a threat.
Updated 47Oxfordshire Strategic Intelligence Assessment 2021
Introduction Victims of knife crime – trend by district
Summary
In 2020/21 (Apr-Mar) Thames Valley Police recorded a total of 294 victims of knife crime
Crime trends offences in Oxfordshire.
Comparisons with similar areas This was 3% below the previous 3 year average (for the years 2017/18 to 2019/20).
Abuse and exploitation
Oxford City saw a fall of 14%.
Hate crime
Knife crime
Fraud and cyber-related crime
Rural crime Victims1 of violent, sexual and robbery offences recorded in
Source: Thames Valley Police Oxfordshire where a sharp or bladed implement was linked
Road casualties Crime Recording System -
Niche RMS extracted April to the offence as a weapon (financial year)
Mental health 2021. Note: the information
is for knife crime offence
Alcohol and drugs that meet the Home Office
Offending and re-offending definition. These are certain
violent offences, sexual
Finding out more offences and robbery
offences where a sharp,
pointed or bladed instrument
has been used to pierce the
skin or used as a threat.
[1] Total recorded unique
victims in the 12 month
period, whether or not
individuals have been a
victim more than once
New 48Oxfordshire Strategic Intelligence Assessment 2021
Introduction Knife crimes – victims and perpetrators by gender and age
Summary In year ending March 2021, demographic details of recorded victims and perpetrators of knife
Crime trends crime in Oxfordshire shows…
Comparisons with similar areas By gender
Abuse and exploitation 68% of knife crime VICTIMS were males and 30% were females (2% not recorded).
Hate crime
83% of knife crime PERPETRATORS were males and 17% were females
Knife crime
VICTIMS by age
Fraud and cyber-related crime
Rural crime 77% of knife crime victims were aged 18 to 64
Road casualties 18% were children and young people aged 0-17 and a further 21% were aged 18-24
Mental health 2% were older people aged 65 and over
Alcohol and drugs PERPETRATORS by age
Offending and re-offending 77% of knife crime perpetrators were aged 18 to 64
Finding out more
20% were children and young people aged 0-17 and a further 26% were aged 18-24
1% were older people aged 65 and over
Source: Thames Valley Police Crime Recording System - Niche RMS extracted April 2021. Note: the above
information is for knife crime offence that meet the Home Office definition. These are certain violent
offences, sexual offences and robbery offences where a sharp, pointed or bladed instrument has been used to
pierce the skin or used as a threat. Total recorded unique victims in the 12 month period, whether or not
individuals have been a victim more than once. ONS Census 2011 table KS201 from nomis
New 49You can also read