Strong net sales growth and solid profitability in a challenging market - Results 2021
←
→
Page content transcription
If your browser does not render page correctly, please read the page content below
Strong net sales growth
and solid profitability in
a challenging market

 Results 2021

 Thomas Geust
 Deputy CEO
Our operating environment
Delivering on our transformation, in 2021’s
challenging environment

    • Strong growth – driven by positive impact of acquisitions, pricing
      actions and recovery of food service

    • Challenging environment - caused by supply chain disruption leading
      to extraordinary inflation

    • Innovation pipeline- launched breakthrough innovations

    • Two acquisitions completed – extending our capabilities and footprint
      in emerging markets
                                                                                  Updated photo
    • Sustainability remains key focus - SBT’s validated, Global Sustainability
      Index launched and improved ratings in 3 key ESG Ratings: EcoVadis,
      CDP and S&P’s CSA

            Interim Q1 operating structure put in place to cover leave
                        of absence of Charles Héaulmé
3     February 10, 2022   Results 2021
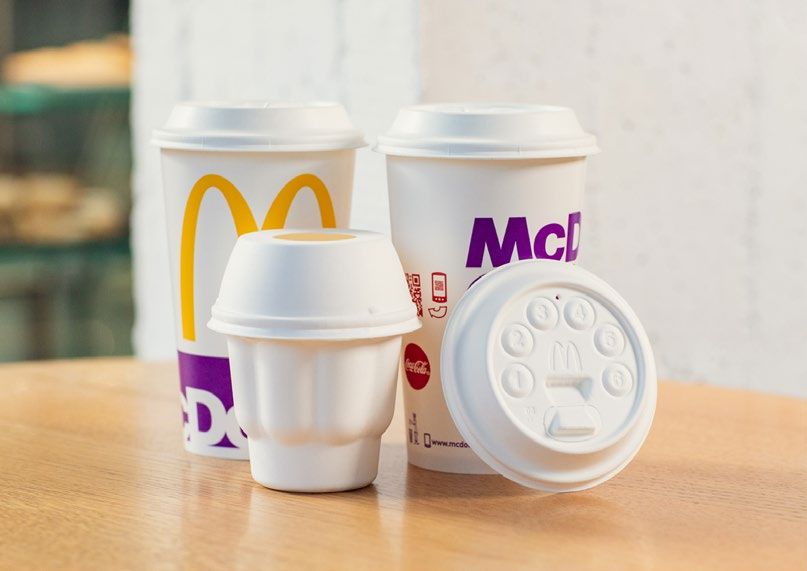
In 2021, our strong innovation pipeline delivered sustainable
packaging solutions for our customers
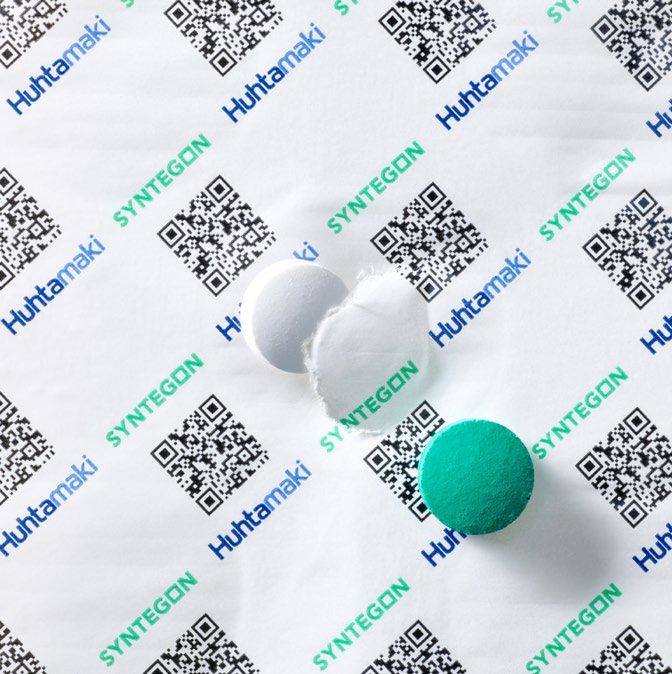
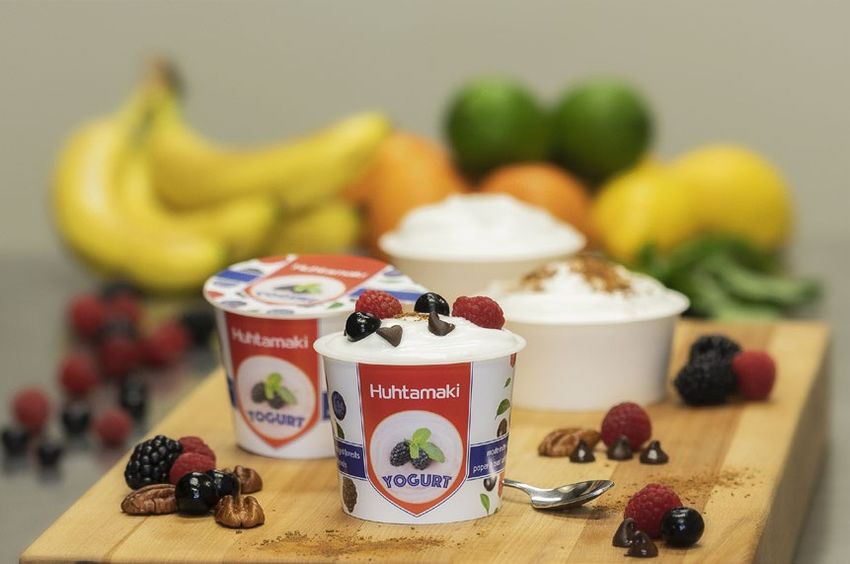
McDonald's Sundae cup and cold cup lid Paperboard yogurt cup Push Tab® paper
Fiber Foodservice EAO North America Flexible Packaging
Next Generation ElifNatty & ElifProLite
Home Delivery Range Smilepack egg carton Savaday® molded fiber Sustainably Sourced
Tube Laminates
cafeteria trays Material for Danone
Futuro egg carton Food safe recycled plastic wet
Huhtamaki Sipp Straw
petfood packaging with Mars &
4 February 10, 2022 Results 2021
SABIC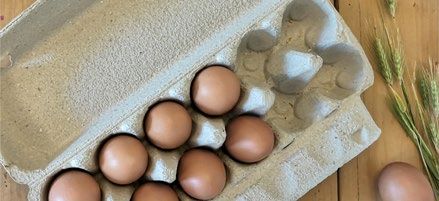
Business performance

Q4 2021: Strong comparable net sales growth

        Development of net sales in Q4 2021                                                                                          Net sales increased 23% in Q4 2021
        (EUR million)
                                                                                                                                     • Comparable net sales growth 12%
                                                                                    24                                                 (19% in emerging markets)
                                                              65
                                                                                                                                     • 8% from acquisitions – including Elif
                                          98
                                                                                                                                       and Hihio-Art acquisitions
                                                                                                         999
                                                                                                                                     • 3% positive currency impact
                  813

               Q4 2020                  Organic         Acquisitions            Currency              Q4 2021

     Comparable net sales growth is growth excluding foreign currency changes, acquisitions, divestments and ancillary businesses.
     Acquisitions calculated for 12 first months from closing. The acquisition of Elif closed at the end of Q3 2021.

6   February 10, 2022    Results 2021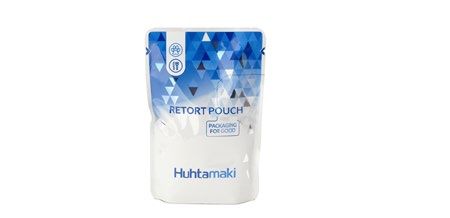
FY 2021: Strong comparable net sales growth

        Development of net sales in 2021                                                                                             Net sales increased 8% in 2021
        (EUR million)
                                                                                                                                     • Comparable net sales growth 7%
                                                                                                                                       (13% in emerging markets)
                                                              77                   -54
                                        250
                                                                                                                                     • 2% from acquisitions – including Elif
                                                                                                                                       and Hihio-Art acquisitions
                                                                                                       3,575
                 3,302                                                                                                               • -2% negative currency impact

                 2020               Organic            Acquisitions            Currency                 2021
     Comparable net sales growth is growth excluding foreign currency changes, acquisitions, divestments and ancillary businesses.
     Acquisitions calculated for 12 first months from closing. The acquisition of Elif closed at the end of Q3 2021.

7   February 10, 2022    Results 2021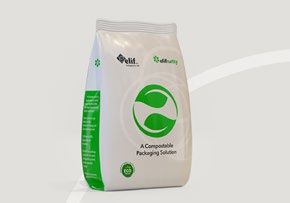
Growth driven by continued in-home consumption supported by
    recovery in foodservice categories

                                                                                                                                                     Long-term
                    Comparable growth                Q4 20            Q1 21             Q2 21            Q3 21             Q4 21       2020   2021
                                                                                                                                                     ambitions
                 Foodservice E-A-O                     -7%              -2%              40%                2%              12%        -10%   11%      5-7%

                        North America                  -2%              -2%               9%                5%              11%        1%     6%       3-5%

                  Flexible Packaging                   -0%               0%               6%                7%              12%        1%     7%       6-8%

                        Fiber Packaging                8%                4%               1%                2%               2%        9%     2%       3-5%

                                   Group              -2%               -0%              14%               4%               12%        -2%    7%       5+%

         •   Demand in foodservice packaging improved gradually, as restrictions lifted, and remained resilient
         •   Demand for retail tableware remained strong, and ice cream market relatively stable
         •   Good demand for Flexible Packaging throughout the year, with variation between product categories and markets
         •   Continued increased demand for on-the-go products, while demand for egg packaging softened
       Comparable net sales growth is growth excluding foreign currency changes, acquisitions, divestments and ancillary businesses.

8   February 10, 2022     Results 2021
Growth in Q4 accelerated - boosted by acquisitions and pricing to
offset cost inflation
MEUR Q4 21 Q4 20 Change 2021 2020 Change
Net sales 999.5 812.8 23% 3,574.9 3,301.8 8%
Adjusted EBIT1 82.2 72.8 13% 315.3 302.1 4%
Margin 8.2% 9.0% 8.8% 9.1%
Adjusted EPS, EUR2 0.54 0.48 13% 2.07 1.95 6%
Capital expenditure 112.2 103.2 9% 259.4 223.5 16%
• Strong net sales growth, both reported and comparable
• Adjusted EBIT improved, margin impacted by pricing activities and higher input costs
• Adjusted EPS increased 6% in 2021
• Investment activities continued to enable business expansion, portfolio transformation and improved productivity
1) Excluding IAC of EUR 2.3 million in Q4 2021 (EUR -24.9 million) and EUR -19.3 million in 21 (EUR -36.8 million).
2) Excluding IAC of EUR 1.1 million in Q4 2021 (EUR -19.3 million) and EUR -17.1 million in 21 (EUR -26.2 million).
9 February 10, 2022 Results 2021Embedding sustainability in everything we do – 2021 Highlights
2021 Full Year performance Other highlights
• Good performance on
ESG ratings;
improvement on S&P
Global CSA, Ecovadis,
CDP’s water, climate
and forest
assessments
• First European VPPA
signed with 200GWh
of new renewable
electricity annually
(80% of EU
consumption)
• Sustainability, as part
of standard incentive
structure, for the
Global Executive Team
rolled-out
Reporting aligned with SASB standards, TCFD and EU taxonomy
10 February 10, 2022 Results 2021Business segment review
Foodservice EAO: Continued recovery throughout the year

        Key figures, MEUR                      Q4 21                Q4 20              Change               Net sales and comparable growth (EUR million & %)
        Net sales                              254.0                 213.5                 19%
            Comparable growth                     12%                  -7%

        Adjusted EBIT1                           19.5                 15.5                 25%
            Margin                               7.7%                 7.3%
                                                                                                                                                                                   Comp.
        Capital expenditure                      40.5                 31.6                 28%                                                                                     growth
        Operating cash flow1                    -31.0                 11.7
North America: Strong performance despite increasingly
inflationary environment
Key figures, MEUR Q4 21 Q4 20 Change Net sales and comparable growth (EUR million & %)
Net sales 314.7 274.0 15%
Comparable growth 11% -2%
Adjusted EBIT1 33.9 32.2 5%
Margin 10.8% 11.8%
Comp.
Capital expenditure 36.2 35.9 1% growth
Operating cash flow1 24.4 22.1 10%
Key figures, MEUR 2021 2020 Change • Demand improved following easing of restrictions, particularly related to
Net sales 1,160.3 1,138.9 2% schools, offices and stadiums. While good demand continued in other key
categories
Comparable growth 6% 1%
Adjusted EBIT1 139.1 136.6 2% • Raw material and freight availability leading to price challenges continued to
Margin 12.0% 12.0% accelerate in Q4
Adjusted RONA 17.5% 16.8% • Full year adjusted EBIT margin remained at previous year’s level, supported
Capital expenditure 70.6 71.7 -2% by pricing actions and offset by higher raw material prices and distribution
Operating cash flow1 117.0 150.1 -22% costs
1) Excluding IAC of EUR -1.1 million in Q4 2021 (EUR 0.1 million) and EUR -1.9 million in 2021 (EUR -6.5 million).
13 February 10, 2022 Results 2021Flexible Packaging: Strong growth, supported by Elif acquisition –
slight improvement in cost mitigation in Q4
Key figures, MEUR Q4 21 Q4 20 Change Net sales and comparable growth (EUR million & %)
Net sales 344.8 250.8 38%
Comparable growth 12% -0%
Adjusted EBIT1 24.5 17.9 36%
Margin 7.1% 7.2%
Comp.
Capital expenditure 12.7 12.9 -2% growth
Operating cash flow1 38.3 45.4 -16%
Key figures, MEUR 2021 2020 Change
• Overall good demand remained, with variation between product categories
Net sales 1,166.4 1,050.8 11%
and markets. Emerging market recovery was impacted by continued
Comparable growth 7% 1%
restrictions and lockdowns
Adjusted EBIT1 79.8 80.7 -1%
• Net sales increased throughout key markets, partly against weak
Margin 6.8% 7.7% comparisons. Acquisition of Elif contributed positively to Q4
Adjusted RONA 8.0% 10.1%
• Profitability continued to be impacted by cost inflation and limited pass-
Capital expenditure 46.0 35.9 28% through of higher cost
Operating cash flow1 54.9 83.8 -34%
1) Excluding IAC of EUR -3.1 million in Q4 2021 (EUR -0.5 million) and EUR -16.1 million in 2021 (EUR -6.2 million).
14 February 10, 2022 Results 2021Fiber Packaging: Growth impacted by softened demand in egg
packaging
Key figures, MEUR Q4 21 Q4 20 Change Net sales and comparable growth (EUR million & %)
Net sales 91.5 85.4 7%
Comparable growth 2% 8%
Adjusted EBIT1 10.7 12.7 -15%
Margin 11.7% 14.8%
Comp.
Capital expenditure 22.2 22.5 -1% growth
Operating cash flow1 -9.4 8.5Financial review
Solid adjusted EBIT margin
         MEUR                                              Q4 21                  Q4 20               Change                      2021                     2020               Change

         Net sales                                         999.5                   812.8                   23%                  3,574.9                3,301.8                       8%              • Sales growth supported by all
         Adjusted EBITDA1                                  130.3                   116.8                   12%                   488.4                    473.1                      3%                segments in Q4, Elif acquisition
                                                                                                                                                                                                       contributed positively
            Margin 1                                      13.0%                  14.4%                                          13.7%                    14.3%

         Adjusted EBIT2                                       82.2                   72.8                  13%                   315.3                    302.1                      4%              • Input costs continued to impact
                                                                                                                                                                                                       earnings negatively throughout
            Margin 2                                        8.2%                   9.0%                                           8.8%                     9.1%
                                                                                                                                                                                                       the year, successful mitigation
         EBIT                                                 84.5                   47.9                  76%                   296.0                    265.3                    12%                 actions secured profitability
         Adjusted net financial
         items
                                                              -8.4                    -6.5                -30%                    -30.1                    -31.2                     4%              • Lower adjusted net financial
                                                                                                                                                                                                       items due to lower interest rates
         Adjusted profit
                                                              73.8                   66.4                  11%                   285.2                    270.9                      5%
         before taxes                                                                                                                                                                                • Compared to prior year, flat
         Adjusted income tax                                                                                                                                                                           effective tax rate of 23%
                                                            -15.9                   -14.9                   -7%                   -65.4                    -60.9                    -7%
         expense3
         Adjusted profit for                                                                                                                                                                         • Adjusted EPS up 6% compared
                                                              57.9                   51.4                  13%                   219.8                    209.9                      5%                to prior year
         the period4
         Adjusted EPS, EUR4                                   0.54                   0.48                  13%                     2.07                      1.95                    6%

        1) Excluding IAC of EUR 2.2 million in Q4 2021 (EUR -15.4 million) and EUR -18.7 million in 2021 (EUR -8.6 million).      3) Excluding IAC of EUR -0.5 million in Q4 2021 (EUR 5.6 million) and EUR 5.1 million in 2021 (EUR 7.6 million).
        2) Excluding IAC of EUR 2.3 million in Q4 2021 (EUR -24.9 million) and EUR -19.3 million in 2021 (EUR -36.8 million).     4) Excluding IAC of EUR 1.1 million in Q4 2021 (EUR -19.3 million) and EUR -17.1 million in 2021 (EUR -26.2 million).

17   February 10, 2022         Results 2021
Currency impact remained positive in Q4 2021
Average Average Change in Change in
Closing rates
rate rate average closing
2020 2021 rate Q4 20 Q1 21 Q2 21 Q3 21 Q4 21 rate (YoY)
USD 1.14 1.18 -4% 1.23 1.17 1.19 1.17 1.13 8%
Foreign currency
INR 84.54 87.50 -4% 89.88 86.25 88.31 86.47 84.26 6% translation impact
GBP 0.89 0.86 3% 0.90 0.85 0.86 0.86 0.84 7%
Q4 2021
CNY 7.87 7.64 3% 8.01 7.72 7.68 7.53 7.22 10% (EUR million)
AUD 1.66 1.57 5% 1.60 1.54 1.58 1.61 1.56 3% Net sales EBIT
THB 35.68 37.82 -6% 36.77 36.71 38.17 39.49 37.87 -3% +24 +2
RUB 82.56 87.26 -6% 91.89 89.16 86.47 84.68 84.89 8%
2021
(EUR million)
BRL 5.88 6.38 -9% 6.36 6.77 5.88 6.32 6.37 -0%
Net sales EBIT
NZD 1.76 1.67 5% 1.71 1.68 1.70 1.68 1.65 3%
ZAR 18.76 17.48 7% 18.01 17.54 17.05 17.52 18.02 -0%
-54 -6
TRY 8.03 10.45 -30% 9.03 9.78 10.36 10.32 14.72 -63%
18 February 10, 2022 Results 2021 Please note: Income statement is valued on average rate, balance sheet on closing rate.Net debt to adjusted EBITDA increased following acquisition
Net debt, net debt/adj. EBITDA and gearing • Acquisition of Elif impacting
Covenant level 3.75 balance sheet:
3.0
3.1 • Net debt/Adj. EBITDA increased
1,520 to 3.1 at year-end
1,404 Ambition • Gearing 0.95
2.1
2.0
1.9 1.9 1.9
2–3 • Ratios presented excluding pro-
1.8 forma impact
980
908 896 898 933 Net debt, M€
867 • At the end of 2021:
0.96 0.95
0.68
• Cash and cash equivalents
0.62 0.65 0.64 0.62 0.66 Net debt/Adj.
EBITDA EUR 179 million
• Net debt EUR 1,520 million and
Gearing
lease liabilities EUR 176 million
Q1 20 Q2 20 Q3 20 Q4 20 Q1 21 Q2 21 Q3 21 Q4 21
19 February 10, 2022 Results 2021Loan maturities
Debt maturity structure December 31, 2021
(EUR million)
• MEUR 400 syndicated revolving
700 credit facility extended in Dec.
600 2021 for an additional year
500 • To support the financing of Elif
400 Huhtamaki signed, in August
300 2021, a bridge financing facility of
MUSD 500
200
• Committed credit facilities at the
100
end of Q4 2021 (including the
0 bridge financing facility)
2022 2023 2024 2025 2026 Later • Average maturity 2.6 years
(2.7 at the end of Q4 2020)
Drawn committed credit facilities Available unused committed facilities • Unused MEUR 382 (MEUR
Bonds and other loans Uncommitted loans from financial institutions 310 at end of Q4 2020)
Commercial paper program Contingent considerations
Lease liabilities Bridge loan drawn
Bridge loan availableFree cash flow impacted by working capital and higher cash taxes
Free cash flow bridge Cash flow impacted by:
(EUR million)
• Adjusted EBITDA at previous
year’s level
470 465 • In comparison period, Laminor gain
of ~20 MEUR is recognized as non-
cash in ‘Other’
207
• Large change in working capital
40
11 2 0
mainly following increase in
trade receivables and inventory
-26 -21 -10 -26
-45
-83
-139 • Higher cash taxes in 2021
-223
-259
Reported Change in Net financial Taxes Capital Proceeds Other Free cash • Higher capex in 2021
EBITDA working items expenditure from selling flow
capital assets
2021 2020
21 February 10, 2022 Results 2021Stable financial position, also post Elif acquistion
MEUR Dec 2021 Dec 2020 • Acquisition of Elif mainly impacting
balance sheet at Dec 31, 2021
Total assets 4,542 3,596
Operating working capital 684 514
• Assets increased
Net debt 1,520 867 • Net debt and gearing increased
Equity & non-controlling interest 1,597 1,364 • Equity including positive translation
impact
Gearing 0.95 0.64
1
11.3% 11.7%
• Stable financial position remains
Adjusted ROI
Adjusted ROE1 15.1% 14.8%
1) Excluding IAC.
22 February 10, 2022 Results 2021The Board of Directors aims for predictable and growing dividends
Dividend per share (EUR) and payout ratio (% of adjusted EPS) 2021* 2020 Change
65% Adjusted EPS 2.07 1.95 6%
Dividend per share 0.94 0.92 2%
53%
50% 50%
47% 47% 47% 47% 47% Long-term ambition: Payout ratio 45% 47%
45% Payout ratio
42% 42% 40-50%
40% 40%
Share price on Dec 31 38.89 42.26 -8%
Dividend yield 2.4% 2.2%
0,89 0,92 0,94
0,80 0,84
0,73
0,60 0,66
0,56 0,57
0,38 0,44 0,46 • 13th consecutive year of growing
0,34
dividends*
2008 2009 2010 2011 2012 2013 2014 2015 2016 2017 2018 2019 2020 2021* • Dividend has increased 176% since 2008*
Dividend per share Payout ratio • CAGR +8% since 2008*
* Dividend for 2021 is a proposal made by the Board of Directors.
23 February 10, 2022 Results 2021Progress towards long-term financial ambitions
Long-term
2014 2015 2016 2017 2018 2019 2020 2021
ambition
Organic growth 6% 4% 4% 3% 5% 6% -2% 7% 5+%
Adjusted EBIT margin 7.8% 8.7% 9.4% 9.0% 8.1% 8.6% 9.1% 8.8% 10+%
Net debt/Adj. EBITDA 1.0 1.6 1.8 1.8 2.3 2.0 1.8 3.1 2-3
Dividend payout ratio 47% 40% 40% 42% 50% 47% 47% 45% 40-50%
Long-term ambitions were updated at the Strategy Update on March 23, 2020
FY 2018 figures restated for IFRS 16 impact.
24 February 10, 2022 Results 2021Looking forward
Outlook 2022

     The Group’s trading conditions are expected to improve compared to 2021, however with
     continued volatility in the operating environment. Huhtamaki's diversified product
     portfolio provides resilience and the Group’s good financial position enables addressing
     profitable growth opportunities.

26   February 10, 2022   Results 2021
Short-term risks and uncertainties
The COVID-19 pandemic may create further disturbances in the Group’s trading
conditions and its operating environment, as well as in demand for the Group’s products.
Availability and cost of raw material, distribution and energy as well as movements in
currency rates are considered to be relevant short-term business risks and uncertainties in
the Group's operations. General political, economic and financial market conditions can
also have an adverse effect on the implementation of the Group's strategy and on its
business performance and earnings. Further, natural disasters and social unrest may have
negative effects on the Group’s operating environment.
27 February 10, 2022 Results 2021Financial calendar 2022
Week commencing
April 27, 2022
February 28, 2022
Q1 2022 Interim Report,
Annual Report 2021 Annual General Meeting
July 21, 2022 October 21, 2022
Half-yearly Report 2022 Q3 2022 Interim Report
28 February 10, 2022 Results 2021Disclaimer
Information presented herein contains, or may be deemed to contain, forward-looking statements. These statements
relate to future events or Huhtamäki Oyj’s or its affiliates’ (“Huhtamaki”) future financial performance, including, but
not limited to, strategic plans, potential growth, expected capital expenditure, ability to generate cash flows, liquidity
and cost savings that involve known and unknown risks, uncertainties and other factors that may cause Huhtamaki’s
actual results, performance or achievements to be materially different from those expressed or implied by any forward-
looking statements. By their nature, forward-looking statements involve risks and uncertainties because they relate to
events and depend on circumstances that may or may not occur in the future. Such risks and uncertainties include, but
are not limited to: (1) general economic conditions such as movements in currency rates, volatile raw material and
energy prices and political uncertainties; (2) industry conditions such as demand for Huhtamaki’s products, pricing
pressures and competitive situation; and (3) Huhtamaki’s own operating and other conditions such as the success of
manufacturing activities and the achievement of efficiencies therein as well as the success of pending and future
acquisitions and restructurings and product innovations. Future results may vary from the results expressed in, or
implied by, forward-looking statements, possibly to a material degree. All forward-looking statements made in this
presentation are based on information currently available to the management and Huhtamaki assumes no obligation to
update or revise any forward-looking statements. Nothing in this presentation constitutes investment advice and this
presentation shall not constitute an offer to sell or the solicitation of an offer to buy any securities or otherwise to
engage in any investment activity.
29 February 10, 2022 Results 2021For further information,
please contact us:
ir@huhtamaki.com
www.huhtamaki.com/investors
February
Results
30 2021
10, 2022You can also read