Subprime Mortgage Crisis Detection in U.S. Foreign Exchange Rate Market by Multifractal Analysis
←
→
Page content transcription
If your browser does not render page correctly, please read the page content below
The 9th International Conference for Young Computer Scientists

       Subprime Mortgage Crisis Detection in U.S. Foreign Exchange Rate Market
                              by Multifractal Analysis
                            Junjun Tang1, Jing Wang2, Cheng Huang3, Guolun Wang2, Xiong Wang2
          1
           Department of Computer Science & Engineering, Shanghai Jiao Tong University, Shanghai, 200240, China
                               2
                                Department of Mathematics, Shanghai Jiao Tong University
                           3
                            Department of Electronic Engineering, Shanghai Jiao Tong University

                                                                       E-mail:jjun.tang@gmail.com

                                       Abstract                                                  then, many studies have found that there are some
                                                                                                 nonlinear properties in the time series of financial
         We apply multifractal methods to analyze the                                            markets [3, 4]. Among all the models, the multifractal
      impact of American subprime mortgage crisis on                                             model is regarded as the most comprehensive one to
      American foreign exchange market. By analyzing the                                         describe the feature of the complexity in economic
      local Hölder exponent α and the multifractal spectrum                                      systems. It can describe the financial series with
      of Japanese Yen to U.S. Dollar (USD/JPY) exchange                                          multifractal spectrum and can be used to analyze and
      rate and Euro to U.S. Dollar (EUR/USD) exchange                                            predict the market’s performance. Many studies have
      rate ticked every hour from late 2006 to early 2008, we                                    applied multifractal method to financial time series.
      find that the periods where critical events took place                                     For example, H.Katsuragi[5] analyzed the Japanese
      are characterized by sudden increase in α, which                                           stock market and found the evidence of multi-affinity.
      passes above 1, followed by very small values for long                                     F.Feng[6] used the multifractal analysis on stock
      period of time. To observe the effect and future trend of                                  market returns in China. Additionally, Ding-sun Ho [7]
      the subprime mortgage crisis, we compare the                                               and X sun [8,9,10] conducted multifractal analysis on
      multifractal spectrum before, and during the crisis.                                       Taiwan Stock index and Hang Seng index, and
      The width of f(α) during subprime mortgage crisis is                                       confirmed the existence of multifractal characteristics.
      much bigger than the one before the crisis. These                                          However, these studies mainly focused on verifying
      results provide solid and important values for further                                     the fatal weakness of EMH method and the existence
      study on the dynamic mechanism of exchange market                                          of multifractal properties in finance market. There
      price fluctuation.                                                                         has been little research about how to build up dynamic
                                                                                                 multifractal models and how to make full use of the
      Keywords: Subprime mortgage crisis; foreign                                                information from these models to analyze and predict
      exchange market; local Hölder exponent; multifractal                                       the real financial market.
      spectrum                                                                                      The subprime mortgage crisis, which began to
                                                                                                 manifest itself in early 2007 since the bursting of the
      1. Introduction                                                                            housing bubbles and the high defaults rate on the
                                                                                                 subprime mortgages, has triggered a financial crisis
          In the past, the efficient market hypothesis (EMH)                                     worldwide in 2007 and 2008. It is still uncertain that
      was used to analyze the capital market. However,                                           how long the crisis will last and when it will come to
      recent researches have shown that the capital market is                                    the end. Since multifractal concept is a well known
      not “informationally" efficient and the changes are not                                    feature of complex system such as financial system, in
      strictly random. Instead, the capital market can be                                        this paper, we apply multifractal model to analyze the
      regarded as an extreme complex system which is                                             impact of the subprime mortgage crisis on American
      characterized by multifractal properties.                                                  foreign exchange market. By calculating the local
          Fractal theory, which was created by Mandelbrot                                        Hölder exponent and its spectrum, we can have a deep
      [1], is one of the greatest achievements in the 20th                                       insight into the relation between the crisis and the
      century. Edgar E.Peters[2] first used the concept of                                       fluctuation of the foreign exchange rate.
      Fractal market to describe the economic systems. Since

978-0-7695-3398-8/08 $25.00 © 2008 IEEE                                                   2999
DOI 10.1109/ICYCS.2008.454

              Authorized licensed use limited to: UR Futurs. Downloaded on April 26, 2009 at 08:46 from IEEE Xplore. Restrictions apply.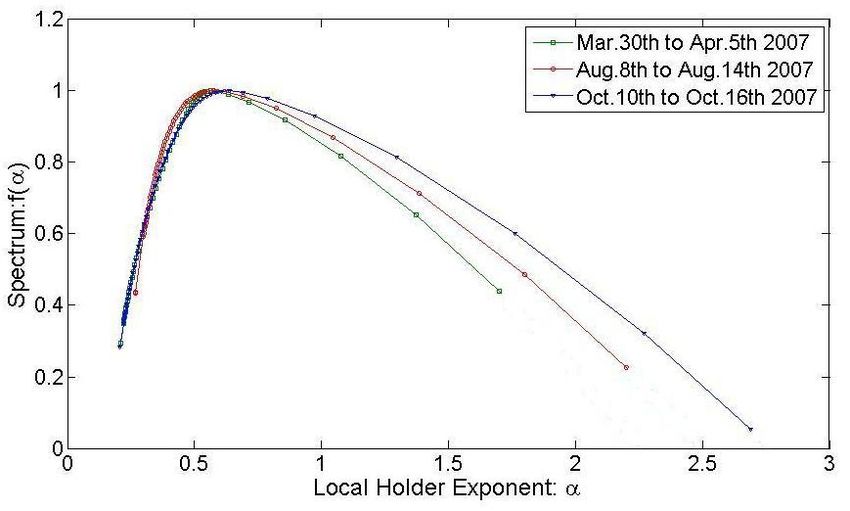
2. Methodologies where q is a real number ranging from − ∞ to
+ ∞ and Z q (T , Δt ) is called partition function. For
2.1 Local Hölder Exponent
multifractally distributed measures, Z q (T , Δt ) varies
Define the local Hölder exponent α(t) as with the time resolution as:
α (t ) = sup{β ≥ 0 | f (t + Δt ) − f (t ) = O(| Δt | β ), Δt → 0} Z q (T , Δt ) ∝ Δtτ ( q ) (5)
where f(t) is the function in a neighborhood of t.
The local Hölder exponent has a direct explanation, where τ (q) is called scaling function .It can be
that is obtained by plotting log Z q (T , Δt ) ~log Δt .If
f (t + Δt ) − f (t ) ∝ C t | Δt |α ( t ) (1) there’s a strong linear relationship between
where Ct is the pre-coefficient. The value of α(t) log Z q (T , Δt ) and log Δt ,the data set is
describes the singularity of the function or the financial
considered as multifractal .The slope of the curve is
time series at t. If α(t) becomes larger, the function or
the time series becomes more regular. So the local τ (q) .The multifractal spectrum f(α) can be obtained
Hölder exponent is the most essential characteristic of through q and τ (q) as:
the multifractal analysis.
dτ ( q )
One method can be used to estimate α(t) of the α=
stock index series, exchange rate series, future price dq (6)
series and so on. First, the financial price time series pi
τ (q) = qα (q) − f (α )
is normalized to probability Pri , by
From the plot of α ~ f (α ) , we can easily obtain
Pri = pi / ∑ pi .The normalized series is then the width of the multifractal spectrum,
divided into N parts with equal length ε (ε < 1) . Δα , (Δα = α max − α min ) . It can describe the
Suppose the growing probability of different growing difference of maximum and minimum probability
interface areas is Pri (ε ) . According to the fractal subsets.
physics, different areas have different growing
probabilities, indicated by the local Hölder exponent α, 3. Data and parameters
α
Pri (ε ) ∝ ε , i = 1,2,3,..., N (2) 3.1 Data
If α are the same in all areas, it is monofractal.
Otherwise it is multifractal. Let Nα (ε ) be the number In order to analyze the impact of subprime
mortgage crisis on foreign exchange rate which
of areas with same α, thus
emerged since early 2007 and widely spread till 2008,
Nα (ε ) ∝ ε − f (α ) (ε → 0) (3) we choose the closing prices of USD/JPE exchange
where f(α) is called scale exponent or fractal dimension rate and EUR/USD exchange rate both ticked every
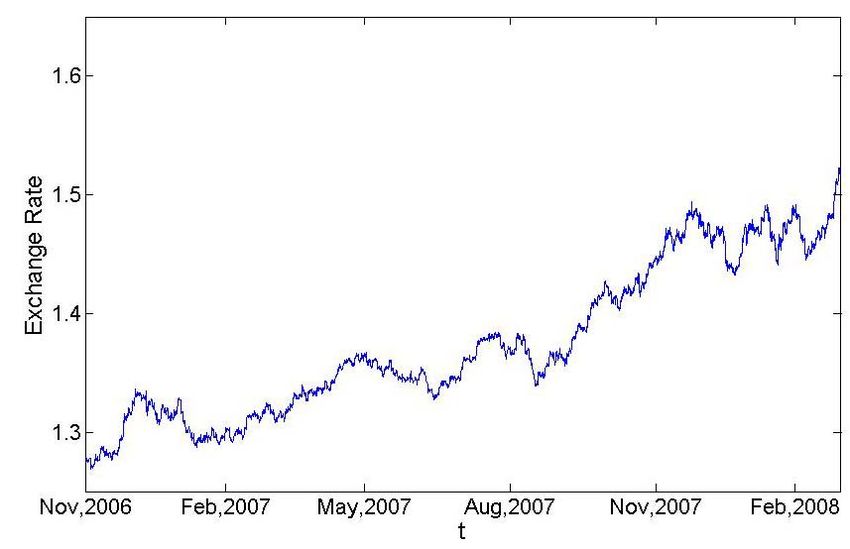
or singular spectrum . hour at the same period, that is, from November 2006
to February 2008, being a total of 13353 samples, are
2.2 Multifractal Analysis used in our study. See Figure 1, 2.
The main task of the multifractal analysis is about
the distribution of the character of the spectrum
function and then to understand the interior subtle
structure and information of the system. Let P(t) be the
asset price.
Let X (Δt ) = log P (Δt ) − log P (0) ,
and X (iΔt , Δt ) = X ((i + 1)Δt ) − X (iΔt ) .
Divide [0, T] into N intervals of length Δt and define Figure 1. USD/JPY Exchange Rate
sample sum:
N −1
Z q (T , Δt ) = ∑ | X (iΔt , Δt ) |q (4)
i =0
3000
Authorized licensed use limited to: UR Futurs. Downloaded on April 26, 2009 at 08:46 from IEEE Xplore. Restrictions apply.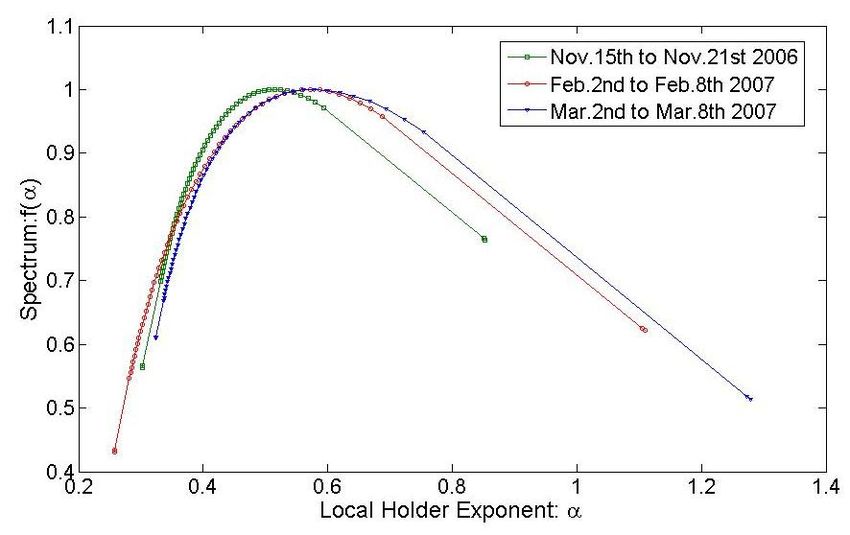
February - March 2007: Subprime industry
collapse; more than 25 subprime lenders declaring
bankruptcy, announcing significant losses or putting
themselves up for sale.
July - August 2007: Worldwide "credit crunch" as
subprime mortgage backed securities are discovered in
portfolios of banks and hedge funds around the world,
from BNP Paribas to Bank of China. Many lenders
Figure 2. EUR/USD Exchange Rate stop offering home equity loans and "stated income"
loans. Federal Reserve injects about $100B into the
3.2 Parameters money supply for banks to borrow at a low rate.
Late October - Early November 2007: Federal
To calculate the local Hölder exponent α(t), we Reserve injects $41B into the money supply for banks
directly followed the definition in formula (1). For time to borrow at a low rate. It had been the largest single
t, we measure how the fluctuation of the signal behaves expansion by the Fed since $50.35B on September 19,
with response to the different sizes of the 2001.
neighborhood. Nine values of 1, 4, 8, 12, 16, 20, 24, 28 Late December 2007: President Bush announced a
and 32 are used as the size of neighborhood. plan to voluntarily and temporarily freeze the
For Legendre spectrum f(α), we use the box method mortgages of a limited number of mortgage debtors
with the parameter q, just as mentioned in 2.2, holding adjustable rate mortgages.
changing from -10 to 10 by increment of 0.1.
And these methods are applied by Fraclab toolbox 4.2 USD/JPY Exchange Rate
in Matlab.
4.2.1 α(t) and logarithm return
4. Result
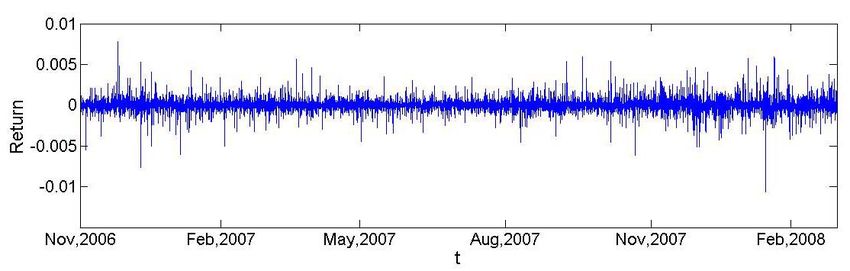
In Figure 3 we can see a picture with logarithm
return of USD/JPY exchange rate from November
4.1 Review of economic events 2006 to February 2008. Meanwhile, as shown in Figure
4, we calculated the values of the local Hölder
Let us remind the most significant events related to
exponents α(t). Both time series are at the same
the subprime mortgage crisis in U.S. from November
time-scale. Hence, their values correspond with each
2006 to February 2008. All of them had different
other.
effects on the U.S. economy and brought great impacts
to the foreign exchange market.
Figure 3. Return of USD/JPY Exchange Rate
3001
Authorized licensed use limited to: UR Futurs. Downloaded on April 26, 2009 at 08:46 from IEEE Xplore. Restrictions apply.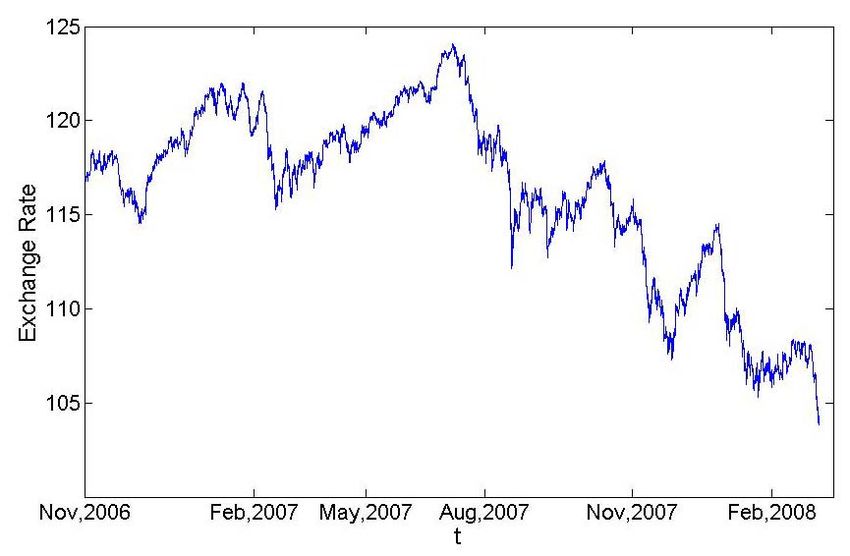
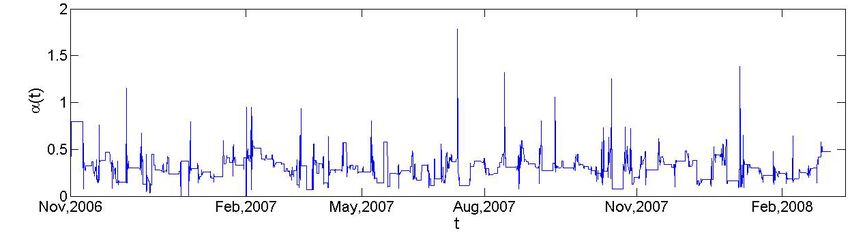
Figure 4. α (t)-t of USD/JPY Exchange Rate

   Extreme cases of Local Hölder exponents are
known as follows. As α=1, it coincide with class of
differentiable functions. As α=0, it coincide with class
of function with irremovable discontinuity. As α is
between 0 and 1, it means that the function is
continuous but not differentiable at the considered
point. Thus, the Hölder exponent is the measure of
function irregularity.
   In Figure 4 there are more high values of local
Hölder exponent from June 2007 than before. This
demonstrates that the USD/JPY exchange rate                                                   Figure 5. f(α)- α of USD/JPY Exchange Rate
fluctuated significantly. Correspondingly in Figure 3, it                                            From Nov.2006 to March 2007
appears that the logarithm return deviates largely from                                    Figure 5 shows the multifractal spectrum based on
0 at the same period, that is, from June 2007. This can                                 three different periods: Nov. 15th – 21st, 2006, February
be a strong support to the great fluctuation of the                                     2nd – 8th and March 2nd – 8th, 2007. Though all of them
USD/JPY exchange rate since that time.                                                  analyzed the data in seven days, they have
   The important events related to the subprime                                         different Δα . We can see the multifractal spectrum
mortgage crisis in U.S. have a specific signature in                                    become wider and wider from late 2006 to early 2007.
values of the local Hölder exponent. We can see that α                                  That means the effect of subprime mortgage crisis
reached its highest value at the end of July and also                                   become more and more significant on international
significantly in August, October of 2007 and at the                                     current market. USD/JPY exchange rate is one specific
beginning of 2008. Comparing to the events listed in                                    reflection, which shows us the great influence.
4.1-Review of economic events, the results really fit                                      In Figure 6, another three weeks’ multifractal
very well with reality. This indicates that the periods                                 spectrums are shown separately. It is obvious that the
where critical events took place are characterized by                                    Δα value based on August 8nd – August 14th data is
sudden increase of the local Hölder exponent in                                         larger than that based on March 30th – April 5th data in
regularity, which passes above 1 and followed by very                                   2007, while the spectrum is even wider in October. So
small values of α for long period of time.                                              it will be reasonable to say that the impact brought by
                                                                                        subprime mortgage crisis still continues.
4.2.2 Multifractal Spectrum Analysis                                                       According to the definition of f(α), the f(αmax) and
                                                                                        f(αmin) reflect the number of the boxes with maximum
   Just as defined in section 2.2-Multifractal Analysis,                                probability and minimum probability, respectively. So
the width of the multifractal spectrum Δα can
                                                                                        a positive Δ f represents that the chance of the index at
describe the difference between maximum and                                             the highest site is larger than that at the lowest site and
minimum probability subsets. Hence, it indicates the
                                                                                        vice versa. Both in figure 5 and 6, we can see that Δ f
unevenness of probability distribution and the strength
                                                                                        decreases from a positive value to a negative one,
of multifractal. The larger the value of Δα ,the stronger
                                                                                        which is consistent with the tendency that the exchange
the strength of multifractal. It reflects the range of the
                                                                                        rate of USD/JPY falls, see figure 1.
variation.
                                                                                           The USD/JPY exchange rate witnessed the fallout

                                                                                 3002

     Authorized licensed use limited to: UR Futurs. Downloaded on April 26, 2009 at 08:46 from IEEE Xplore. Restrictions apply.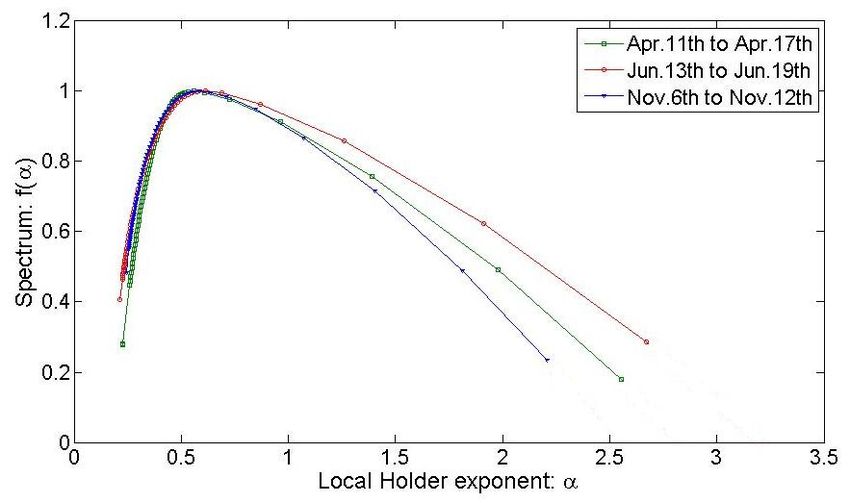
from the contraction of the subprime mortgage lending
market in the United States. 4.3 EUR/USD Exchange Rate
Correspondingly, we analyze the performance of the
EUR/USD exchange rate from November 2006 to
February 2008.
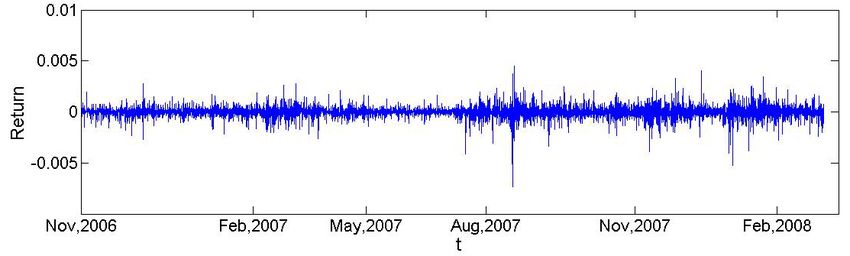
4.3.1 α(t) and logarithm return
As shown in Figure 7, we can see a picture with
logarithm return of EUR/USD exchange rate.
Meanwhile, in Figure 8, we calculated the values of the
local Hölder exponents α(t) at the same time-scale.
Hence, their values correspond with each other.
Figure 6. f(α)- α of USD/JPY Exchange Rate
From May to Oct. 2007
Figure 7. Return of EUR/USD Exchange Rate
Figure 8. α(t)-t of EUR/USD Exchange Rate
We can see obviously in Figure8 that some values characterized by sudden increase of the local Hölder
of the local Hölder exponent are extrusive. The one in exponent in regularity.
July 2007 should be mentioned. Worldwide "credit
crunch" as subprime mortgage backed securities are 4.3.2 Multifractal Spectrum Analysis
discovered in portfolios of banks and hedge funds
around the world. The subprime mortgage crisis was Figure 9 shows the multifractal spectrum based on
taken on board formally. Also the great singularity three different time periods: January 10th – 16th,
should not be ignored in early 2008. This is the February 14th – 20th and March 21st – 27th. Though all
reflection to President Bush’s announcement of a plan of them analyzed the data in seven days, the
to voluntarily and temporarily freeze the mortgages of multifractal spectrums become wider and wider from
a limited number of mortgage debtors holding January to March in 2007. That means the effect of
adjustable rate mortgages. This again demonstrates that subprime mortgage crisis becomes more and more
periods where critical events took place are significant on international current market.
3003
Authorized licensed use limited to: UR Futurs. Downloaded on April 26, 2009 at 08:46 from IEEE Xplore. Restrictions apply.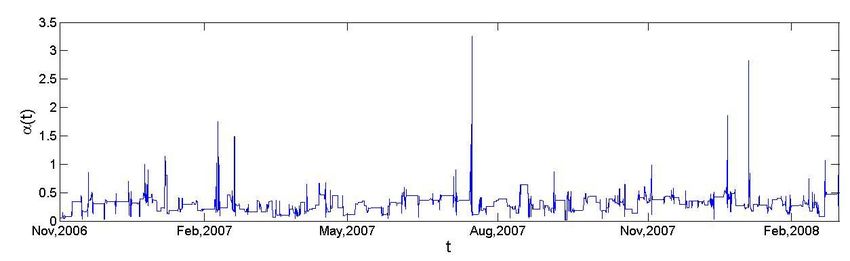
(2) From the comparison of logarithm return and local
                                                                                          Hölder exponent α in Figure3 versus Figure 4 and
                                                                                          Figure 7 versus Figure 8, we find that the periods
                                                                                          where critical events took place are characterized
                                                                                          by sudden increase in α, which passes above 1,
                                                                                          followed by very small values for a long period of
                                                                                          time.
                                                                                      (3) The width of f(α) after subprime mortgage crisis is
                                                                                          much bigger than the one before the crisis. And Δ f
                                                                                          can help us to have a better understanding of the
                                                                                          tendency of the exchange market.
                                                                                      (4) The impact brought by subprime mortgage crisis
                                                                                          still continues.

      Figure 9. f(α)- α of EUR/USD Exchange Rate                                         Acknowledgement
                 From Jan. to March 2007
                                                                                             Thank Ron for providing us useful materials and
     Besides Japanese Yen, EUR/USD exchange rate is                                      encouragement despite his busy schedule.
 another specific reflection, which shows us the great                                       Thank IWCFTA committee.
 influence.                                                                                  Thank all the members in our team for
                                                                                         brainstorming,      teamwork,      highly-motivation,
                                                                                         determination and hardworking.

                                                                                         References
                                                                                         [1] B.B. Mandelbrot, "The variation of certain speculative
                                                                                         prices", J. Bus. 36, 394-419, 1963

                                                                                         [2] E.E Peters, Fractal Market Analysis - Applying Chaos
                                                                                         Theory to Investment and Economics, Economic Science
                                                                                         Press, July, 2002

                                                                                         [3] J.F.Muzy et al, Eur. Phys. J.B. 17, 537(2000); Z.Eisler et
                                                                                         al, Physica A 343, 603(2004); L.Calvet et al., J. of
     Figure 10. f(α)- α of EUR/USD Exchange Rate                                         Econometrics 105, 27(2001).
                From April to Nov. 2007
                                                                                         [4] J.Kwapien et al., Physica A 350, 466(2005).

     In Figure 10, it is really obvious that the Δα value                                [5] H.Katsuragi, “Evidence of multi-affinity in the Japanese
 based on November 6th – 12th data is much larger than                                   stock market”, Physica A 278(2000), 275-281
 that in April and June. So it will be a good support of
 our conclusion made in the analysis of USD/JPY                                          [6] F.Feng, “The multifractal analysis on stock market returns
 exchange rate, that is, the impact brought by subprime                                  in China”, J.Syst Eng.Theory Practice 6(2004), 50-55
 mortgage crisis still continues this year.
                                                                                         [7] Ding-Shun Ho, Chung-Kung Lee, "Scaling characteristics
     From figure 2, we can see that the exchange rate of                                 in the Taiwan stock market", Physica A 332(2004), 448-460
 EUR/USD goes much more smoothly than USD/JPY.
 This is why Δ f changes little in figure 10.                                            [8] X.Sun, H.Chen, Z.Wu, Y.Yuan, "Multifractal analysis of
                                                                                         Hang Seng index in Hong Kong stock market", Physica A,
 5. Conclusion                                                                           291(2001), 553-562

                                                                                         [9] X.Sun, H.Chen, Z.Wu, Y.Yuan, "Predictability of
(1) Since f(α) versus α in Figure 5, Figure 6, Figure 9,                                 multifractal analysis of Hang Seng stock index in
    Figure 10 contains multiple points rather than a                                     HongKong", Physica A, 301(2001), 473-482
    single point, it confirms the existence of
    multifractal properties in U.S. foreign exchange                                     [10] Xuefeng Song, Liexun Yang, Qingren Cao, Management
    market.                                                                              Science Series, Science Press, 305-320, 2004

                                                                                  3004

      Authorized licensed use limited to: UR Futurs. Downloaded on April 26, 2009 at 08:46 from IEEE Xplore. Restrictions apply.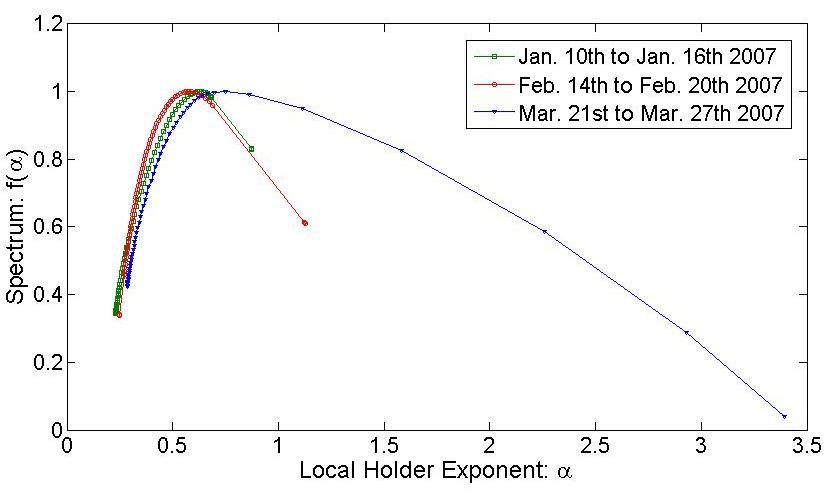
You can also read