Survey of ionospheric F2 region variability from the lower atmosphere - Phil Erickson, W1PJE Atmospheric and Geospace Sciences Group / MIT ...
←
→
Page content transcription
If your browser does not render page correctly, please read the page content below

Survey of ionospheric F2
  region variability from the
  lower atmosphere

Phil Erickson, W1PJE (Atmospheric and Geospace
Sciences Group / MIT Haystack Observatory)
Carl Luetzelschwab, K9LA (ARRL)
                                  2021 Workshop
Purpose of this Presentation
Highlight the time scales of the variations of the
F2 region of the ionosphere (Part 1)
Review F2 region variations due to events at
ground level and in the lower atmosphere (Part 2)
Collins, K., D. Kazdan, and N. A. Frissell (2021), Ham radio forms a planet-sized space
weather sensor network, Eos, 102, https://doi.org/10.1029/2021EO154389. Published on
09 February 2021.
       “Although we have a good understanding of ionospheric climate—diurnal and
       seasonal variations are well known, as are the rhythms of the sunspot cycle—
       there are new and vital areas of research to be explored. For example, it is known
       that the ionosphere—and near-Earth space—experiences variability (e.g., radio
       signals can fade in and out over periods of seconds, minutes, or hours due to
       changes in ionospheric electron densities along signal propagation paths), but
       this variability has not been sampled or studied adequately on regional and
       global scales.”

                                                2                  2021 Workshop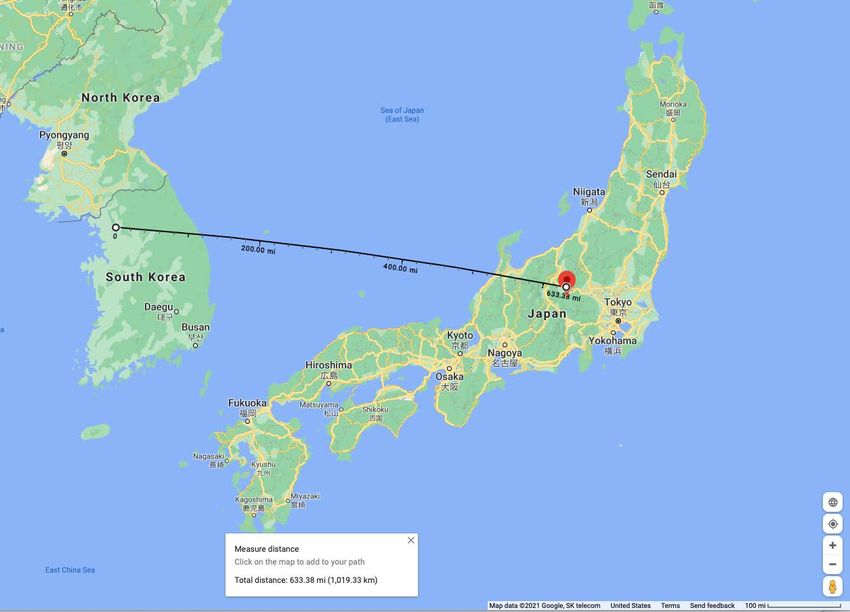
Agenda
 • Part 1 by Carl K9LA
  • Time scales of F2 region variation
  • Factors causing the variation
  • Preliminary look at the Tohoku earthquake of 2011

 • Part 2 by Phil W1PJE
  • Types of physical processes driving F2 layer
    ionospheric variations “from below”
  • Numerical estimates of the various forcing terms
  • More detailed look at the Tohoku earthquake
  • Confirming results with other events

                            3          2021 Workshop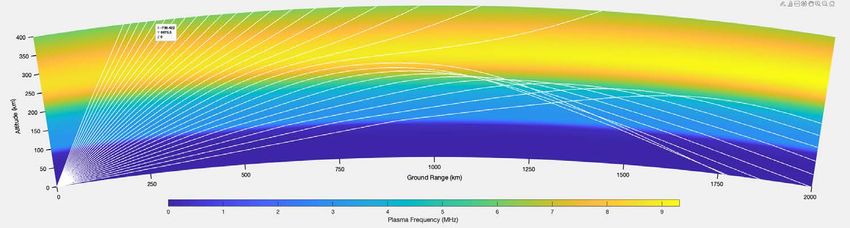
Part 1
Carl K9LA

   4        2021 Workshop
Time Scales of F2 Variations
  • Over an (approximate) 11-year solar cycle

                              high
                 low        electron            low
               electron     densities         electron
               densities                      densities

        The maximum F2 electron density and the height of
        the maximum F2 electron density are correlated to
        the F2 region MUF (maximum useable frequency)

                                  5            2021 Workshop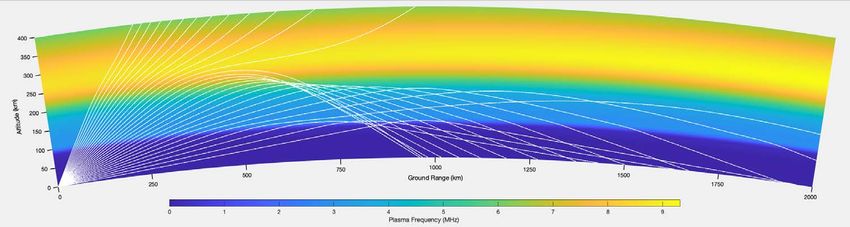
Time Scales of F2 Variations
  • Monthly
  • Composition of the atmosphere changes on a
   seasonal basis
                                     § O/N2 ratio
                                       highest in fall
                                       and winter in
                                       northern
                                       hemisphere
                                     § O important for
                                       electron
                                       production
                                     § N2 important for
                                       electron loss

                        6        2021 Workshop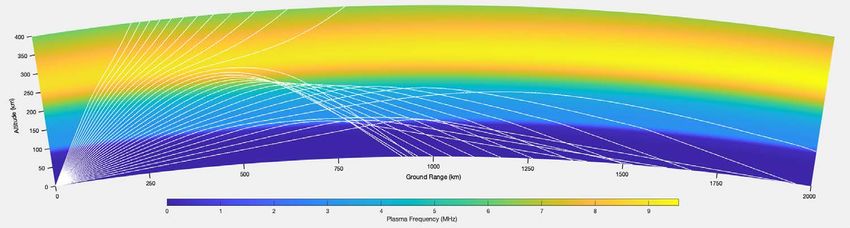
Time Scales of F2 Variations
  • Diurnal (daily)
  • Biggest difference is night and day
                                                § These results
                                                  are monthly
                                                  median
                                                  MUFs

                                                § Why do we
                                                  have monthly
                                                  median
                                                  MUFs?
          median implies a 50% probability

                                 7           2021 Workshop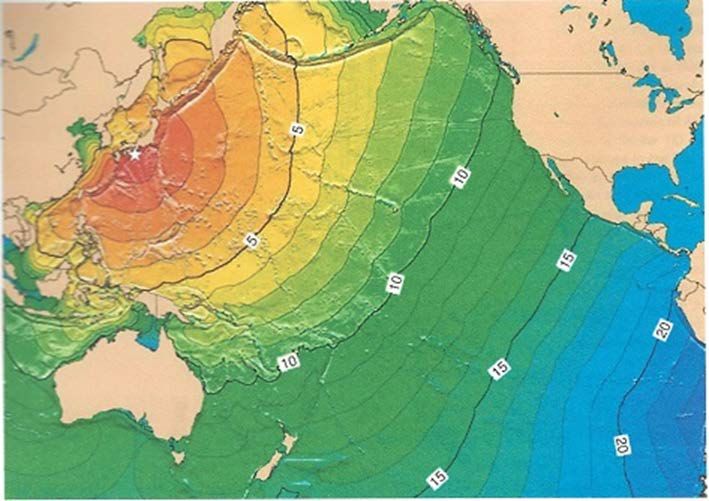
Time Scales of F2 Variations
  • Each day is not the same
  • The day-to-day variation of the F2 region can be
   significant
                                                        § This is why VOACAP,
                                                          W6ELProp, IRI, et al, don’t
                       Note the spikes – always be        give daily propagation
         Feb 8, 2021
         0920z
                       suspicious of these and check
                       the raw ionogram as the auto-
                                                          predictions – we don’t
                       scaling software can be fooled     have a full understanding
                                                          (yet) of these day-to-day
                                                          variations
                                                        § We’ll now review the
                                                          factors that cause this day-
                                                          to-day variation, which
                                                          also tie into even shorter
                                                          F2 variations

                                            8               2021 Workshop
Factors Causing F2 Region Variation
  • H. Rishbeth and M. Mendillo, Patterns of F2-
   layer variability, Journal of Atmospheric and Solar-
   Terrestrial Physics 63 (2001) 1661–1680
  • Used data from 13 worldwide ionosondes over 34
   years (1957–1990)
  • They focused on the daily variation of the F2
   region
  • To reiterate, this study ties into very short
   variations of the F2 region

                              9          2021 Workshop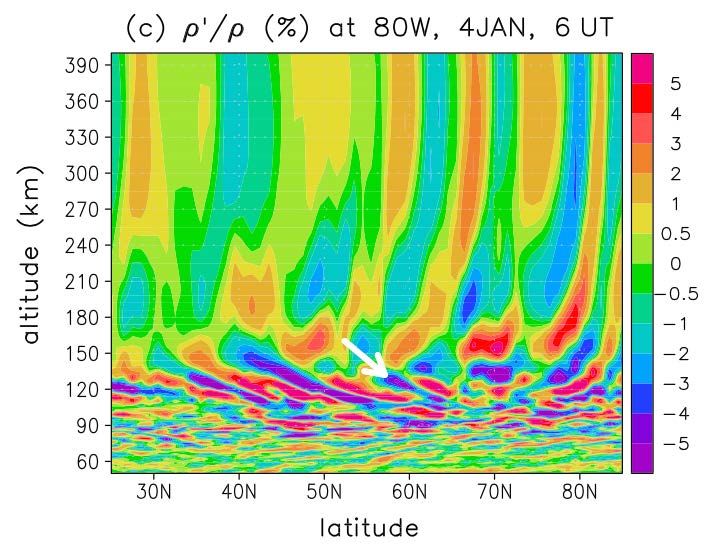
The Factors

     • Authors reduced all of these into three
     broad categories
      • solar radiation (#1 above)
      • geomagnetic activity (#2 above)
      • meteorological (#3 and #4 above)

                               10          2021 Workshop
Daytime Daily Variation
• They determined that the NmF2 std dev / NmF2 mean
was, on average, 20% during the day (33% by night)
• They then determined how much each of the three
factors contributed to this 20% total
• solar radiation (std dev / mean)2 = 3%
as a check,
• geomagnetic activity (std dev / mean)2 = 13% 0.202 = 0.032 + 0.132 + 0.152
• meteorological (std dev / mean)2 = 15% ü
• The factor that we know the most about (solar
radiation) contributes the least to the daily variation
• The STORM model addresses F2 variation vs
geomagnetic field activity – is it good enough?
• Lots of research on-going in the meteorology arena
11 2021 WorkshopOn-the-Air Example of Short Variations
• A group of us operated from YK9A in
Damascus (Syria) in February 2001 (back row -
N4CFL, VE7CC, YK1AH, N7RO, YK1AO, VA7MI, W4PRO
(SK), front row - K7AR, K9LA, AE9YL, W4DR)
• I was on 10m SSB in the late afternoon
working NA – here’s a graph from the log
• Several minutes of many QSOs, several minutes YK9A – Feb 2001
of few (or zero) QSOs, and this would repeat
§ Was this due to a
TID (travelling
ionospheric
disturbance)?
§ The MUF
appeared to vary
in a cyclic nature
12 2021 WorkshopI Tried to “See” a TID in Ionosonde Data
• Rome - 5 min, gaps in data, night • Goose Bay - no data
• Juliusruh (Germany) - 15 min, night • Narsarsuaq (southern Greenland) - no data
• Chilton (England) - 30 min • Fairford (England) – no data
Feb 7, 2001
short path
Millstone Hill YK9A
Millstone Hill is south of
the short path shown, so
its MUF will be higher
than on the actual path
map from W6ELProp § There’s a hint of a TID during the day
§ Would be nice to have data every 5 min
13 2021 WorkshopThe Tohoku Earthquake of 2011
Azeem, I., S. L. Vadas, G. Crowley, and J. J. Makela (2017),
Traveling ionospheric disturbances over the United States induced
by gravity waves from the 2011 Tohoku tsunami and comparison
with gravity wave dissipative theory, J. Geophys. Res. Space
Physics, 122, 3430–3447, doi:10.1002/2016JA023659.
§ March 11, 2011 Tohoku
epicenter (Japan) earthquake (mag
0546 UTC 11 hrs later
X 1646 UTC 9.0) at 0546 UTC
§ Generated a tsunami
§ Tsunami traveled across
the Pacific Ocean and
arrived at the US West
Figure 2 from above paper - NOAA National Geophysical Data Center’s Coast about 11 hours later
map of tsunami travel times in hours (http://www.ngdc.noaa.gov/hazard/
11mar2011.html)
tsunami travel times
14 2021 WorkshopTsunami – Effect on the Ionosphere
Detrended TEC • TEC perturbations
far away from
epicenter
• Pattern of TEC
perturbations is
similar to the pattern
of the tsunami “wave
front”
Now it’s time for Phil
Figure 4 from same paper - Two-dimensional maps of TEC perturbations at 16:45 UT.
This map show planar TID wave fronts over the West Coast of the United States. with Part 2
15 2021 WorkshopPart 2
Phil W1PJE
16 2021 WorkshopSources of Ionospheric Density Modulation
• Storm-time heating in the auroral
zone, elsewhere:
• Launches large amplitude acoustic
gravity waves (AGWs)
• Propagation in the form of traveling
atmospheric disturbances (TADs)
• Ionosphere-neutral atmosphere
coupling leads to
traveling ionospheric disturbances
(TIDs)
• F region electron density variations – primarily
relevant to this talk
• Other parameters also vary (velocity, plasma
temperature)
Figure from Prölss, G.W. Density Perturbations in the Upper Atmosphere Caused by the Dissipation of Solar
Wind Energy. Surv Geophys 32, 101–195 (2011). https://doi.org/10.1007/s10712-010-9104-0
17 2021 WorkshopSources of Ionospheric Density Modulation
• Lower atmosphere origin AGWs
also couple into TADs and TIDs
during non-storm conditions
• Affected by tides, planetary waves,
seasonal variations, etc.
• Driven by normal energy transitions
from free oscillations in the
atmosphere – atmosphere normal
modes
• Forms an important part of quiet
time ionospheric variability
• We do not fully understand the
coupling dynamics, but from
observations we understand well
the amplitude of TIDs
http://www.sws.bom.gov.au/Educational/1/2/5
18 2021 WorkshopGravity Wave Propagation:
Lower Atmosphere to Thermosphere
• Primary internal gravity waves
in the troposphere
• Flows over mountains, Neutral
water density
variations
• Secondary gravity waves in
mesosphere and stratosphere
• Dissipation of primary
waves
• Tertiary gravity waves in the
thermosphere
• From breaking of
secondary waves
• These drive TADs and therefore
TIDs in the ionosphere
• ”Waves all the way up”
Periods of 1 to 2 hr Becker, E., & Vadas, S. L. (2020). Explicit global simulation
of gravity waves in the thermosphere. Journal of
Several hundred km wavelength Geophysical Research: Space Physics, 125,
1 to several % amplitude e2020JA028034. https://doi.org/ 10.1029/2020JA028034
19 2021 WorkshopLarge Scale TIDs at Mid-Latitudes
Amplitude of density
fluctuations > 50% of
background
• Period of 2-3 hours
• Arecibo IS radar
• Downward phase
progression (not
shown) identifies
source as
acoustic gravity
waves from lower
atmosphere
• Confirmed by TEC
maps
Nicolls, M. J., Kelley, M. C., Coster, A. J., González, S. A., and Makela, J. J. (2004), Imaging the structure of
a large-scale TID using ISR and TEC data, Geophys. Res. Lett., 31, L09812, doi:10.1029/2004GL019797.
20 2021 WorkshopMedium Scale TIDs at Mid-Latitudes
• Mid-latitude stations
• Very geomagnetically [e-] [e-]
quiet: no high latitude
heating or other effects
• Lower atmosphere forced:
tides, weather, etc.
• Time periods 40-80
minutes
• Amplitudes up to 20% [Detrended] [Detrended]
of background density
Panasenko, S. V., Goncharenko, L.
P., Erickson, P. J., Aksonova, K. D.,
& Domnin, I. F. (2018). Traveling
ionospheric disturbances observed
by Kharkiv and Millstone Hill
incoherent scatter radars near vernal
equinox and summer solstice.
Journal of Atmospheric and Solar-
Terrestrial Physics, 172, 10-23.
doi:10.1016/j.jastp.2018.03.001
21 2021 WorkshopThought Experiment
Let’s work the extreme natural forcing event: Tohoku
(M9.1 undersea megathrust earthquake).
• How big is the ionospheric perturbation?
• What effects might this have on HF propagation
compared to other sources?
There’s always enough random success to justify almost anything to
someone who wants to believe.
--- John Allen Paulos, Innumeracy: Mathematical Illiteracy and its
Consequences (1988; ISBN 0-679-72601-2)
22 2021 WorkshopTohoku Induced Tsunami and TIDs
• Detrended TEC observations
(background subtracted)
• Usuda, Japan station; 400
km from Tohoku epicenter
• Tsunami and TID signatures
triggered by earthquake = +/-
1 to 1.5 TECu
• Plenty large to be detected
Typical TEC relative by sensitive TEC receivers
uncertainty in the
10-2 range at L band frequencies (**)
Komjathy, A., Galvan, D.A., Stephens, P. et al. Detecting
ionospheric TEC perturbations caused by natural hazards
using a global network of GPS receivers: The Tohoku case
study. Earth Planet Sp 64, 24 (2012).
https://doi.org/10.5047/eps.2012.08.003
23 2021 WorkshopTohoku Induced Tsunami and TIDs
Usuda, Usuda,
Japan Japan
GIM (data driven model) GAIM (first principles physics model)
Note: still 1 to 2 TEC unit perturbations..
Komjathy, A., Galvan, D.A., Stephens, P. et al. Detecting ionospheric TEC perturbations caused by natural hazards using a global
network of GPS receivers: The Tohoku case study. Earth Planet Sp 64, 24 (2012). https://doi.org/10.5047/eps.2012.08.003
24 2021 WorkshopBackground TEC Pre-Earthquake
NB: 1 TECu = 1016 [e-]/m2; dominated by ionosphere
25 2021 WorkshopRelative Ionospheric Perturbation
Before quake:
Average TEC over Japan
~ 29 TECu
Recall perturbations seen
from tsunami and
subsequent TIDs were
~1.5 TECu worst case
Assume TEC change
reflects overall ionospheric
electron density
(reasonable)
Relative ionospheric
density perturbation
therefore is ~5.2%
26 2021 WorkshopOther Examples
Heki, K. (2006), Explosion energy of the 2004 eruption of the Asama
Afraimovich, Edward L., Volcano, central Japan, inferred from ionospheric disturbances,
Natalia P. Perevalova, Geophys. Res. Lett., 33, L14303, doi:10.1029/2006GL026249.
A. V. Plotnikov, and A.
M. Uralov. "The shock-
acoustic waves
generated by
earthquakes." In
Annales Geophysicae,
vol. 19, no. 4, pp. 395-
409. Copernicus GmbH,
2001.Comparison of Mid-lat TID Strength
Tohoku M9.1 Quake ~5.2% Amplitude Thankfully uncommon
Storm-time TIDs Up to 50% Amplitude ~10x/ year, unevenly
distributed (more at solar
max)
Quiet time TIDs 5-15% Amplitude Every day
Conclusion: one of the largest earthquakes ever recorded does not have
an observed electron density perturbation amplitude larger than natural
every-day ionospheric variability.
But these extreme events are EASILY distinguishable with sensitive,
calibrated techniques (e.g. GNSS at L band frequencies).
What are the implications for HF signal propagation?
28 2021 WorkshopLocalized HF Effects: TIDs
Rays are focused near local
electron density minima associated
with wave passing through region
Concave electron density contours;
causes local increase in HF
amplitude
VERY localized
fading/enhancement as wave
passes by; not a wide scale effect
Subject of upcoming HamSCI
investigations using amateur radio
networks (following e.g. Frissell et
al. 2014;
doi:10.1002/2014JA019870.)
29 2021 WorkshopHypothetical HF Contact Path
• Path shown is to
control point (midpoint)
of HF path originating
in Seoul, SK
• Somewhere within
largest perturbation
zone of Tohoku event
• What alterations
might happen to HF
propagation on this
path?
30 2021 Workshop14 MHz Propagation Created with PhARLAP
Ray tracing engine
Pre-Tohoku
2011-03-11T05:30 UTC
Az = 100 deg
~Japan
Plasma frequency
(proportional to sqrt([e-]))
Seoul,
SK
Very small wide-scale HF propagation effects
Tohoku +5.2% [e-] increase
2011-03-11T05:30 UTC
Az = 100 deg
~Japan
Seoul,
SK
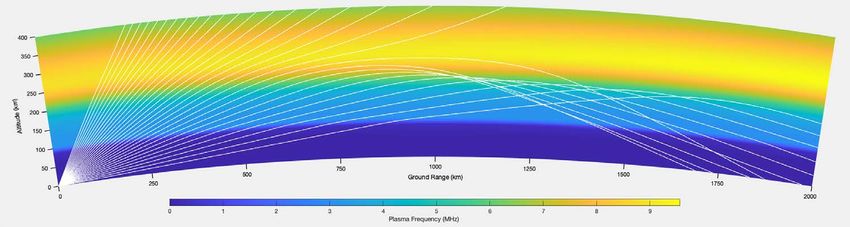
31 2021 Workshop21 MHz Propagation Created with PhARLAP
Ray tracing engine
Pre-Tohoku
2011-03-11T05:30 UTC
Az = 100 deg
~Japan
Plasma frequency
(proportional to sqrt([e-]))
Seoul,
SK
Very small wide-scale HF propagation effects
Tohoku +5.2% [e-] increase
2011-03-11T05:30 UTC
Az = 100 deg
~Japan
Seoul,
SK
Minor refraction changes
32 2021 WorkshopSummary • Space weather ionospheric [e-] variability affects HF propagation • AGW forcing / TIDs – storm time, quiet time • Natural transients – e.g. earthquakes • HF propagation variability includes contributions from all these sources • Amplitude of [e-] disturbance from largest earthquakes recorded is
Acknowledgment
 • HF ray-tracing results in this talk were obtained using the HF
  propagation toolbox, PHaRLAP, created by Dr Manuel Cervera,
  Defence Science and Technology Group, Australia
  (manuel.cervera@dsto.defence.gov.au). This toolbox is available by
  request from its author.
 • Electron density model provided by the International Reference
  Ionosphere (2016 version). See D. Bilitza, IRI the International
  Standard for the Ionosphere, Adv. Radio Sci., 16, 1-11,
  https://doi.org/10.5194/ars-16-1-2018, 2018.
 • The International Telecommunications Union Recommendation ITU-R
  P.372-10 (10/2009) for radio noise is used in PHaRLAP. See
  https://www.itu.int/dms_pubrec/itu-r/rec/p/R-REC-P.372-14-201908-
  I!!PDF-E.pdf.

                                   34            2021 Workshop
You can also read