Sustainability-Linked Bond Investor Presentation - April 2022
←
→
Page content transcription
If your browser does not render page correctly, please read the page content below
Sustainability-Linked Bond
Investor Presentation

April 2022
Disclaimer (1/3)
This presentation (the “Presentation”) has been prepared by Wallenius Wilhelmsen ASA (“Wallenius Wilhelmsen ASA” or the “Company”, and together with its subsidiaries the “Group”) with the
assistance of Danske Bank, Norwegian Branch; DNB Markets, a part of DNB Bank ASA; Nordea Bank Abp, filial i Norge; Skandinaviska Enskilda Banken AB (publ); and Swedbank Norge, Branch of Swedbank
AB (publ) (the “Managers”) solely for use in connection with the offering of unsecured sustainability linked bonds (the “Bonds”) by the Company (the “Offering”). By attending a meeting where this
Presentation is made, or by reading the Presentation slides, you agree to be bound by the following terms, conditions and limitations. Any failure to comply with the restrictions set out herein may
constitute a violation of applicable securities laws or may result in civil, administrative or criminal liabilities.

Neither this Presentation nor the Bonds have been reviewed, approved or disapproved by or registered with any public or regulatory authority or stock exchange and this Presentation does not
constitute a prospectus or an offering memorandum. Any representation to the contrary is a criminal offence. This Presentation does not constitute an offer to sell or a solicitation of an offer to buy any
securities in any jurisdiction to any person to whom it is unlawful to make such an offer or solicitation in such jurisdiction.

The Managers have not independently verified any of the information contained herein through due diligence procedures or other investigations. None of the Company, the Managers or any of their
respective parent, subsidiary or affiliate undertakings or any such person’s officers or employees, makes any representation or warranty of any sort as to the accuracy or completeness of the information
contained in this Presentation or the reasonableness of the assumptions on which any such information is based. No person shall have any right of action against the Company or the Managers, or any of
their respective shareholders, affiliates, directors, officers, employees or any other person in relation to the accuracy or completeness of any such information. By attending or receiving this Presentation,
you acknowledge that you will be solely responsible for your own assessment of the market and the market position of the Company and that you will conduct your own investigations and analysis and be
solely responsible for forming your own view of the future performance of the Company’s business and its current and future financial situation. The information contained in this Presentation is subject
to amendment and/or completion without notice and such amendments may be material.

The contents of the Presentation are not to be construed as financial, legal, business, investment, tax or other professional advice. Each recipient should consult with its own professional advisors for any
such matter and advice.

This Presentation contains information obtained from third parties. As far as the Company is aware and able to ascertain from the information published by that third party, such information has been
accurately reproduced and no facts have been omitted that would render the reproduced information inaccurate or misleading. Only the Company and the Managers are entitled to provide information
in respect of matters described in this Presentation. Information obtained from other sources is not relevant to the content of this Presentation or the terms of the Offering and should not be relied
upon.

The information included in this Presentation may contain certain forward-looking statements relating to the business, financial performance and results of the Group and/or the industry in which it
operates. Forward-looking statements concern future circumstances and results and other statements that are not historical facts, sometimes identified by the words “believes”, “expects”, “predicts”,
“intends”, “projects”, “plans”, “estimates”, “aims”, “foresees”, “anticipates”, “targets”, and similar expressions. The forward-looking statements contained in this Presentation, including assumptions,
opinions and views of the Company or cited from third party sources are solely views and forecasts which are subject to risks, uncertainties and other factors that may cause actual events to differ
materially from any anticipated development. None of the Company or any other company in the Group, or any of its advisors or any of their parent or subsidiary undertakings or any such person’s
affiliates, officers or employees provides any assurance that the assumptions underlying such forward-looking statements are free from errors nor does any of them accept any responsibility for the
future accuracy of the opinions expressed in this Presentation or the actual occurrence of the forecasted developments. The Company assumes no obligation to update any forward-looking statements or
to conform these forward-looking statements to the Group’s actual results. Investors are advised, however, to inform themselves about any further public disclosures made by the Company, such as
filings made with Oslo Børs or press releases.

                                                                                                                                                                                                                  2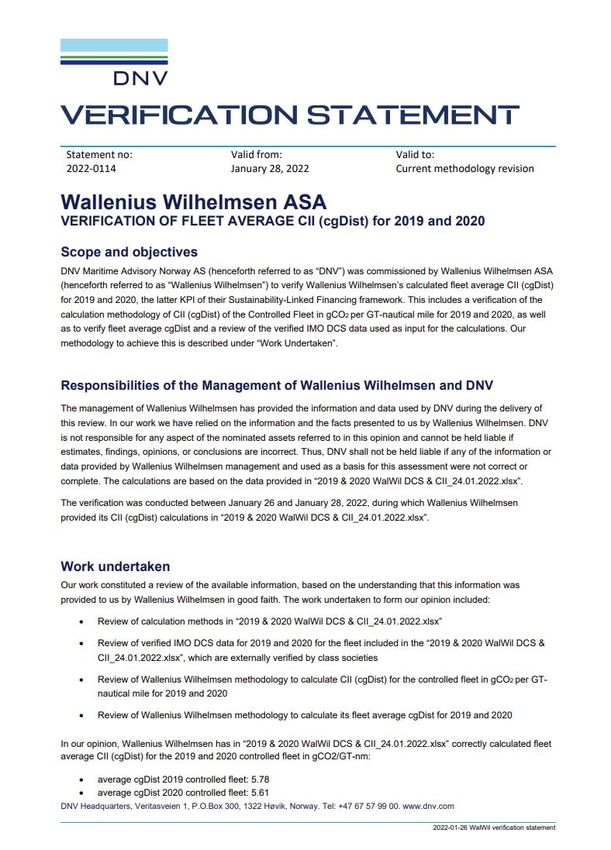
Disclaimer (2/3)
The merits or suitability of investing in any securities previously issued or issued in the future by the Company for any investor’s particular situation must be independently determined by such investor.
Any such determination should involve, inter alia, an assessment of the legal, tax, accounting, regulatory, financial, credit, foreign exchange and other related aspects of the transaction in question.

AN INVESTMENT IN THE BONDS INVOLVES INHERENT RISKS, AND IS SUITABLE ONLY FOR INVESTORS WHO UNDERSTAND THE RISKS ASSOCIATED WITH THIS TYPE OF INVESTMENT AND WHO CAN AFFORD
A LOSS OF ALL OR PART OF THE INVESTMENT. SEVERAL FACTORS COULD CAUSE THE ACTUAL RESULTS, PERFORMANCE OR ACHIEVEMENTS OF THE COMPANY TO BE MATERIALLY DIFFERENT FROM ANY
FUTURE RESULTS, PERFORMANCE OR ACHIEVEMENTS THAT MAY BE EXPRESSED OR IMPLIED BY STATEMENTS AND INFORMATION IN THIS PRESENTATION. THERE MAY ALSO BE A LIMITED SECONDARY
MARKET FOR THE BONDS WHICH MAY RESULT IN A SUBSTANTIAL LIQUIDITY RISK. PLEASE REFER TO SLIDE 5 FOR A SUMMARY OF RISK FACTORS AND SLIDES 48-54 FOR A DETAILED BUT NON-EXHAUSTIVE
DESCRIPTION OF CERTAIN RISK FACTORS ASSOCIATED WITH THE COMPANY AND THE BONDS.

THIS DOCUMENT DOES NOT DISCLOSE ALL THE RISKS AND OTHER SIGNIFICANT ISSUES RELATED TO AN INVESTMENT IN THE BONDS AND/OR THE OFFERING. PRIOR TO TRANSACTING, POTENTIAL
INVESTORS SHOULD ENSURE THAT THEY FULLY UNDERSTAND THE TERMS OF THE BONDS AND/OR THE OFFERING AND ANY APPLICABLE RISKS.

Neither this Presentation nor any copy of it nor the information contained herein is being issued, and nor may this Presentation nor any copy of it nor the information contained herein be distributed
directly or indirectly to or into Australia, Hong Kong, Japan or the United States of America, absent applicable exemptions from relevant registration requirements, or any other jurisdiction in which such
distribution would be unlawful. These materials are not intended for distribution to, or use by any person or entity in any jurisdiction or country where such distribution or use would be contrary to local
law or regulation or which would require any registration or licensing within such jurisdiction.

Neither the Group nor the Managers have taken any actions to allow the distribution of this Presentation in any jurisdiction where action would be required for such purposes. The distribution of this
Presentation and any purchase of or application/subscription for Bonds may be restricted by law in certain jurisdictions, and persons into whose possession this Presentation comes should inform
themselves about, and observe, any such restriction. Any failure to comply with such restrictions may constitute a violation of the applicable securities laws of any such jurisdiction. None of the Group or
the Managers shall have any liability (in negligence or otherwise) for any loss howsoever arising from any use of this Presentation or its contents or otherwise arising in connection with the Presentation.
Neither the Group nor the Managers have authorised any offer to the public of securities, or has undertaken or plans to undertake any action to make an offer of securities to the public requiring the
publication of an offering prospectus, in any member state of the European Economic Area which has implemented Regulation (EU) 2017/1129, as amended (the “Prospectus Regulation”).

In relation to each Member State of the European Economic Area (each, a “Relevant State”), no offer of Bond will be made to the public in that Relevant State other than: (a) to any legal entity which is a
qualified investor as defined in the Prospectus Regulation; (b) to fewer than 150 natural or legal persons (other than qualified investors as defined in the Prospectus Regulation); or (c) in any other
circumstances falling within Article 1(4) of the Prospectus Regulation, provided that no such offer of Bonds shall require the Company or any Manager to publish a prospectus pursuant to Article 3 of the
Prospectus Regulation. For the purposes of this provision, the expression an “offer of Bonds to the public” in relation to any Bonds in any Relevant State means the communication in any form and by any
means of sufficient information on the terms of the offer and the Bonds to be offered so as to enable an investor to decide to purchase or subscribe for the Bonds.

                                                                                                                                                                                                                3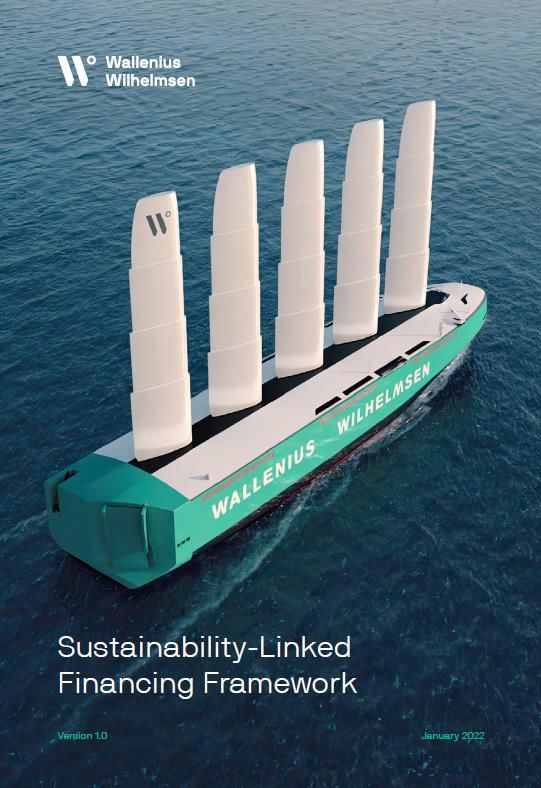
Disclaimer (3/3)
The Bonds may be offered to and directed at specific addressees who, if in the United Kingdom, are “qualified investors” within the meaning of Article 2(e) of Regulation (EU) 2017/1129 as it forms part
of UK law by virtue of the European Union (Withdrawal) Act and who are: (i) persons having professional experience in matters relating to investments who fall within the definition of “investment
professionals” in Article 19(5) of the Financial Services and Markets Act 2000 (Financial Promotion) Order 2005 (the “Order”); or (ii) high net worth entities falling within Article 49(2)(a) to (d) of the
Order; or (iii) are other persons to whom it may otherwise lawfully be communicated (all such persons referred to in (i), (ii) and (iii) together being “Relevant Persons”), and only in circumstances where,
in accordance with section 86(1)(c) and (d) of the Financial and Services Markets Act 2000, as amended (“FSMA”), the requirement to provide an approved prospectus in accordance with the requirement
under section 85 of the FSMA does not apply as the minimum denomination of and subscription for the Bonds exceeds EUR 100,000 or an equivalent amount. The Bonds may not be offered to or
directed at specific addressees who in the United Kingdom, are not Relevant Persons.

The Bonds have not been and will not be registered under the U.S. Securities Act of 1933, as amended (the “Securities Act”) or any state securities laws and may not be offered or sold within the United
States, absent registration under the Securities Act or under an exemption from, or in a transaction not subject to, the registration requirements of the Securities Act. Accordingly, any offer or sale of
Bonds will only be offered or sold (i) within the United States or to U.S. Persons, only to qualified institutional buyers as defined under Rule 144A under the Securities Act (“QIBs”) and (ii) outside the
United States in reliance on Regulation S under the Securities Act. Prospective purchasers that are QIBs are hereby notified that the Company and the Manager may rely on the exemption from the
provision of Section 5 of the Securities Act provided by Rule 144A. Any purchaser of Bonds in the United States, or to or for the account of U.S. Persons, will be deemed to have made certain
representations, acknowledgements and agreements, including without limitation that the purchaser is a QIB.

The Bonds will be subject to restrictions on resale and transfer and may not be transferred or resold except as permitted under applicable securities laws (including the Securities Act) pursuant to
registration or exemption therefrom. Please see the application form for further applicable selling and transfer restrictions.

This Presentation speaks as of the date set out on the front page, and there may have been changes in matters which affect the Group subsequent to the date of this Presentation. Neither the issue nor
delivery of this Presentation shall under any circumstance create any implication that the information contained herein is correct as of any time subsequent to the date hereof or that the affairs of the
Group have not since changed, and the Company does not intend, and does not assume any obligation, to update or correct any information included in this Presentation.

The Managers and/or their employees may hold shares, bonds, options or other securities of the Company and may, as principal or agent, buy or sell such securities. The Managers may have other
financial interests in transactions involving the Company or such securities.

This Presentation is subject to Norwegian law, and any dispute arising in respect of this Presentation is subject to the exclusive jurisdiction of Norwegian courts with Asker and Bærum District Court as
exclusive venue.

                                                                                                                                                                                                                4
Summary of risk factors
The following is a summary of key risks. Please see pages 48-54 for a full description of the risk factors.

Risks related to the Group and the market in which it operates                                   Risks related to the Bonds and the Bond Issue

  ▪ Risks related to change in production patterns                                                 ▪ The Bonds may not be a suitable investment for all investors
  ▪ Risks relating to the industry                                                                 ▪ Interest-rate risk
  ▪ Risks related to competition                                                                   ▪ The regulation and reform of “benchmarks” may adversely affect the value of securities
                                                                                                     linked to or referencing such “benchmarks”
  ▪ Geopolitical risk and sanctions
                                                                                                   ▪ Risk of being unable to repay the Bonds
  ▪ Risks related to piracy, armed robbery, hijackings and kidnapping
                                                                                                   ▪ The Bonds are effectively subordinated to the secured debt of the Company
  ▪ Environmental risk
                                                                                                   ▪ The Bonds will be unsecured obligations and structurally subordinated to the liabilities of
  ▪ Incidents involving significant damage, loss or environmental contamination
                                                                                                     any of the Company’s subsidiaries
  ▪ Risks related to customer contracts
                                                                                                   ▪ The trading price of the Bonds may be volatile
  ▪ Risks related to disputes and litigation and anti-trust
                                                                                                   ▪ Risks related to the market for the Bonds

Financial risks related to the group
  ▪ Currency risk
  ▪ Interest rate risk
  ▪ Restrictive covenants in the Company’s secured loan facilities and the bond terms,
    financial and other restrictions
  ▪ Liquidity risk
  ▪ Credit risk
  ▪ Fuel price risk

                                                                                                                                                                                                   5
Investment highlights

        Global market leader in vehicle logistic segment

        Long-term customer base and diversified business model

        Strong history of free cash flow

        Solid market fundamentals and results

        Ambitious carbon target and commitment to sustainability
Agenda

         1. WAWI in brief
         2. Sustainability
         3. Market update
         4. Financial update
         5. Investment highlights
A logistics provider built on a strong history

                                                             ~8,200             131
                                                             Employees    Vessels in operation
          • 2017 merger of companies with >150-year           across 29         (Q4-21)
            history                                           countries

          • Listed on Oslo Stock Exchange (ticker: WAWI)
            with a market cap of USD 3.1bn*

          • Wilh. Wilhelmsen Holding ASA and Wallenius
            Lines AB largest shareholders with 37.82% each

          • Strong balance sheet with USD 7.8bn assets**        8               66+
                                                             Terminals        Processing
                                                                               centers

*Share price as of 31/03/2022, USD/NOK 8.74
                                                                                                 8
** As per Q4 2021
A history of innovation and adaptation

   Wilhelmsen Group                 American Roll-on Roll-off Carrier     EUKOR                                         o Merger creating Wallenius Wilhelmsen Logistics
   o Founded in Tønsberg,           (ARC)                                 o Formed as Wilhelmsen Group and                ASA as a listed company incorporating EUKOR,
     Norway by Morten W.            o Founded by Wilhelmsen Group           Wallenius Shipping acquired the car           WWL, ARC, and Wilhelmsen and Wallenius vessels
     Wilhelmsen                        and Wallenius Shipping               carrier unit of Hyundai Merchant Marine

      1861                                    1990                                    2002                                       2017                           2018

                            1934                                   1999                                    2006                                   o New branding to reflect changed
                                                                                                                                                    structure and strategy
                                                                                                                                                  o The group is named Wallenius
                                                                                                                                                    Wilhelmsen

                Wallenius Lines                   o JV between the operational units in      o Wallenius Wilhelmsen changes name
                o Founded in Stockholm,             Wilhelmsen group and Wallenius             from Lines to Logistics, signalling
                  Sweden by Olaf Wallenius          Shipping to form Wallenius                 shift towards fully integrated logistics
                                                    Wilhelmsen Lines                           services from factory to dealer

                                                                                                                                                                                      9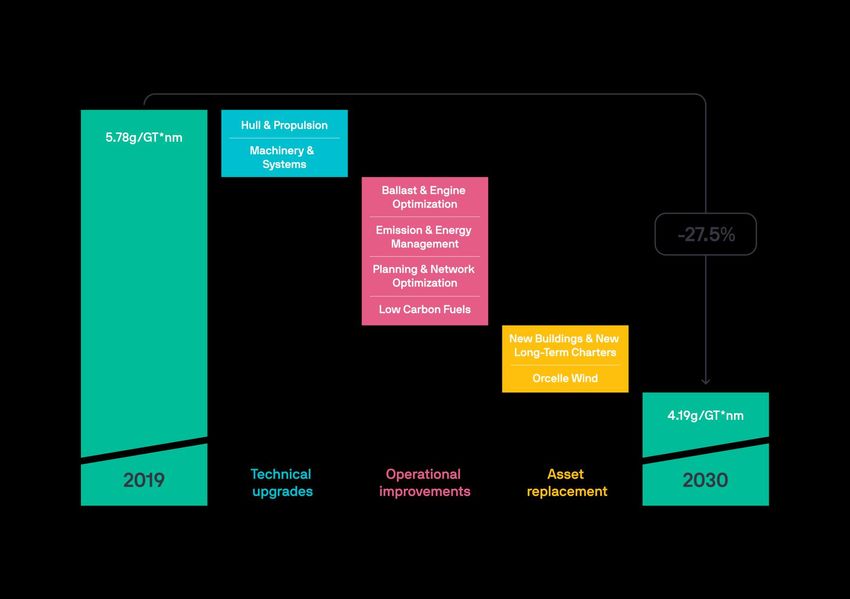
Limited direct impact on our business from Russian invasion of Ukraine
The invasion of Ukraine is a tragedy. Our deepest sympathy goes out to the people of Ukraine, and our thoughts are with the
millions of innocent people affected. WAWI has suspended operations in Russia and Belarus until further notice.

o   WAWI has limited direct exposure in the region and no material operations on the ground
      • Russia accounting for USD 28m revenue in 2021 (0.7% of total revenue)
      • 9 sales representatives based in Russia
o   Significant uncertainty relating to the duration and extent of disruption from the invasion, as well as its impact on the global economy
o   Main concern is the safety and well-being of our employees and partners in the region
o   WAWI continues to adhere to prevailing sanctions and other restrictions, and the situation is continuously monitored by management
o   WAWI has together with the Norwegian Shipowners’ Association provided financial support to the Red Cross

o   WAWI has established a waiver until 22 May 2022 for ongoing business with GEFCO, the French logistics company 75% owned by Russian
    Railways (RZD)
      • Our business with GEFCO is not related to Russia or sanctioned, but considered a sanction issue under certain loan agreements with banks
        due to GEFCO being owned by RZD
      • This business represents less than 1% of the Group revenue in 2021
o   On 1 April 2022 GEFCO announced they are in the process of buying out Russian Railways as a shareholder with a target to conclude by 11 April
    2022
      • According to media, CMA-CGM is a frontrunner to acquire the stake thereafter
o   If GEFCO is not able to solve its ownership shortly, we have made an executive decision to remove the sanction issue by exiting the relationship
                                                                                                                                                       10
Prospects from 2021 Annual Report
Released 23 March 2022
○ In the absence of further volatility and disruptions to supply-
chains, we expect to further improve financial flexibility and help
drive shareholder value creation based on:
○ Shipping supply-demand balance expected to remain
favourable mid-term due to the overall global fleet situation
○ Logistics volumes will benefit from gradual improvement of
chip supplies during latter part of 2022
○ Potential risks include further parts and labor shortages, increased
geopolitical tension and further escalation of the conflict related
to the Russian invasion of Ukraine, significant disruptions to the
global supply chains, and operational impact from virus outbreaksPremium end-to-end supply management Premium end-to-end supply management
Our business segments

   Shipping services                                                Logistics services                                Government services

Share of EBITDA*               Highlights:                    Share of EBITDA*         Highlights:                Share of EBITDA*          Highlights:
                     • Worldwide deep-sea                                        • 8 terminals                                       • RoRo shipping cargo,
                       transportation network                                    • Inland distribution networks       5%
                                                                                                                                       breakbulk, vehicles
     82 %                                                         13 %
                     • Main customers include                                    • 66+ vehicle and equipment                         • Logistics services incl.
                       manufacturers of auto,                                      processing centers                                  stevedoring
                       high&heavy, breakbulk                                                                                         • Primary customer US
   USD 670m                                                      USD 108m        • Same customers as Shipping       USD 40m
                     • Brands: WW Ocean, EUKOR,                                                                                        government
                       Armacup                                                   • Brands: WW Solutions, VSA,
                                                                                   Keen, Syngin, ALS                                 • Brand: ARC
                     • Fleet around 120 vessels                                                                                      • Fleet of 9 US flag vessels

    *Approximate share of group EBITDA L12M (Q1’21 – Q4’21)                                                                                                         13
Shipping benefits from a diversified customer portfolio with long-term contracts
AUTO HIGH & HEAVY AND BREAKBULK
▪ Majority of volumes from auto
▪ High & heavy (“H&H”) and
breakbulk maximize cubic
utilization
▪ Unique handling capabilities for
high & heavy and breakbulk
▪ Main customers include all major
original equipment
manufacturers (“OEMs”) globally
Share of CBM* Main customers Share of CBM* Main customers ▪ Contract duration is typically 1-3
HIGH & HEAVY
years for auto / 3-5 years for H&H
▪ Strong customer relationships
~70% ~30% with long history with many key
customers
BREAKBULK
*Average share of total cubic meters (“CBM”) volume last two years 14We are the market leader and the #1 operator globally within Shipping services
Four decades of leading the High & Heavy space
CURRENT FLEET BY OPERATOR GROUP FLEET CHARACTERISTICS
Average max ramp capacity, tons
300
862
250 WW Ocean
Capacity, kCEU*
200
GRIMALDI
150
HAUTO
K LINE EUKOR
100
MOL
50 GLOVIS
NYK
0
WAWI NYK MOL K-Line Glovis Hoegh Grimaldi Others 1 2 3 4 5
Average # of hoistable decks
* Car equivalent units, a standardized capacity measurement unit 15Logistics services portfolio enable us to provide end-to-end services
VEHICLE PROCESSING HIGH & HEAVY SERVICES TERMINAL SERVICES INLAND / SUPPLY CHAIN
Vehicle Processing
Vehicles Processed* Equip Processing Centre Machines Processed* Marine Terminals Units Handled* Inbound Distribution Units Moved*
Centre
39 Sites 5M 27 Sites 150k 8 Sites 5.3M 11 Networks 211k
SERVICES KEY DRIVERS SERVICES KEY DRIVERS
SERVICES KEY DRIVERS • Stevedoring • Vessel • Trucking/Rail • In-House vs
• Pre-Delivery Inspection • Port vs Plant • Custom Clearance Schedule • Brokerage Transport 3rd party
• Receipt & Dispatch • Vessel Schedule • Receive & Delivery • Cargo Mix • Supply Chain • Capacity
• Vehicle Preparation • Cargo Mix • Cargo Handling • Congestion Management • Labor
• Storage Management • Congestion • Port Distribution • Labor • Inventory Limitations
• Repairs & Rectifications • Labor Efficiencies • Storage Efficiencies Management • Capital
• Accessory Fitting • Storage Demand • Fumigation • Storage • Online Marketplace Resources
• Value Added Services Demand Distribution
Performed in reporting sub-segment: Performed in reporting sub-segment: Performed in reporting sub-segment: Performed in reporting sub-segment:
• SOLUTIONS AMERICA (AUTO) • SOLUTIONS AMERICA (H&H) • TERMINALS • SOLUTIONS AMERICA (AUTO)
• EMEA / APAC • EMEA / APAC • SOLUTIONS AMERICA (H&H)
• EMEA / APAC
*All volumes are for full year 2020 16Our strategy to strengthen our competitive advantage
End-to-end supply chain Expand to full lifecycle Drive operational Lead the journey to zero
orchestration effectiveness emissions
Digitalization Supreme customer Efficiency Zero emission
experience
17Agenda
1. WAWI in brief
2. Sustainability
3. Market update
4. Financial update
5. Investment highlightsOur commitment to change is not limited to climate action
Principles of Governance People Planet Prosperity
Transparent, with strong Safe & inclusive workplace Decarbonize and reduce Solving the biggest
ethical business conduct where human rights are our environmental impact challenges while creating new
respected opportunities
19We target to reduce carbon intensity by more than 50% from 2008 to 2030
We have been in the forefront of responsible recycling, maritime anti-corruption and promoting the sulphur cap
We are committed to
We reduced fleet CO2
reduce fleet CO2
intensity* from 2008 to
intensity from 2019
2019 by:
to 2030 by:
33.6% 27.5%**
Carbon intensity target
2000 2010 2019 2030
Sustainability
milestones
2004 2023 2050
GHG emissions from shipping All new equipment at terminals All our energy will be
disclosed for the first time and yards to be zero-emission from sustainable
2011 sources
2025
2009 Founding member of All owned vessels
1999 Maritime Anti-
First sustainability report 2019 equipped for zero-
Responsible ship published Corruption Network emission at berth
Identification of Climate
recycling (MACN)
Related risks and
opportunities
* CO2e intensity = grams CO2/tonne-km.
20
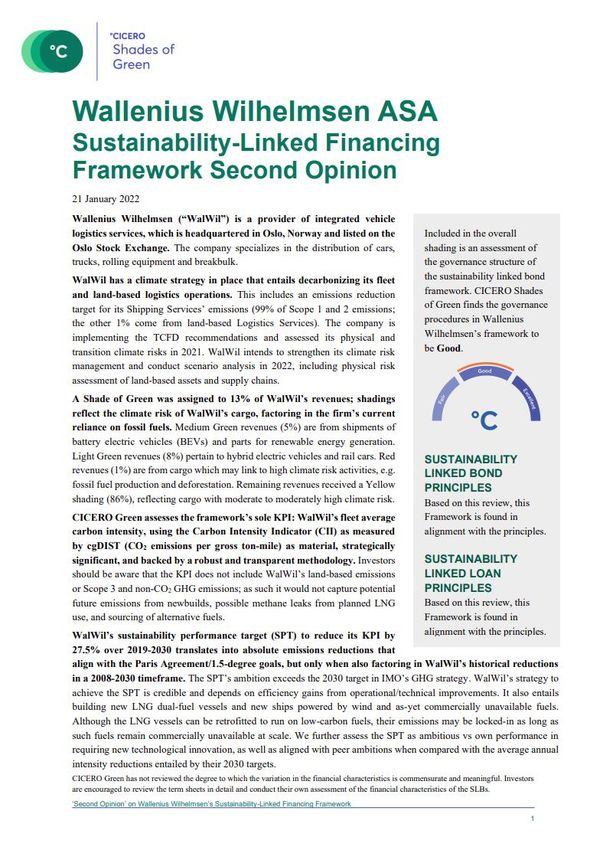
** Carbon intensity target approved by the Board of Directors in 2021We are launching a Sustainability-Linked Financing Framework
The Framework is published
on our website together with:
• A Second Party Opinion from
CICERO Shades of Green
• A Verification Statement
from DNV
21The Framework will be used to link new financings with sustainability objectives
KPI • CO2 intensity measured by CII* as reported to IMO DCS each year,
calculated on the Controlled fleet
Fleet weighted average • Controlled fleet includes 125 (per Q4-21) owned and long-term
carbon intensity charter vessels**
SPT • Reduce CO2 intensity by 27.5% from 2019 to 2030, defined by KPI
Reduce KPI 27.5% • Strategy to reach Sustainability Performance Target details relevant
Technical, Operational and Asset replacement initiatives
2019-2030
Trajectory • Annual KPI targets 2019 to 2030, based on Strategy to reach SPT
Annual targets • Each annual target could be designated as Interim SPTs in the
security documentation of a financial instrument
2019-2030
*There are two units for measuring CII (Carbon Intensity Indicator); AER and cgDIST. For vehicle carriers, cgDIST is the correct unit. CII is calculated for the individual vessels for the days it is part of the Controlled
fleet during a year, from which a weighted average of all relevant vessels is calculated. The weighted average is based on gross tonnage and distance travelled, in other words transport work.
** Total number of vessels per Q4-21 amounts to 132 of which 125 are included in the Controlled fleet 22Our target to reduce CO2 intensity by 27.5% from 2019-2030 is ambitious
For the Framework, we focus on intensity rather than absolute emissions to avoid problems of comparability over the years
Choice of KPI
• The Shipping segment represent 99% of the group’s
total CO2 emissions*
• CO2 intensity allows us to measure and monitor
performance over time
• For data collection purposes, the focus is on CO2
(vs CO2 e), Tank-to-wake (vs Well-to-wake) and
Controlled fleet (vs all vessels)
Calibration of SPT
• Beyond “business as usual”
• Set to guide efforts in line with current climate
science and Paris Agreement
Our target implies a 52% reduction in our CO2 intensity from • CO2 intensity reduced 33.6% from 2008-2019
2008-2030, exceeding our IMO 2030 obligation for a 40% • Implied 52% reduction target within the IMO 2030
reduction across international shipping horizon
* 2020 Scope 1 and Scope 2 CO2 emissions 23Our journey towards zero takes place every day
Day-to-day Long-term
Digitalization
of fleet
Advanced Bio-fouling
weather management Future fuels Future vessels Future tech
routing techniques solutions
“Energy efficiency is the unsung
hero of the energy transition”
Remi Eriksen, CEO DNV
24Select overview of initiatives to reach the SPT – energy efficiency is the key
Technical upgrades
• Energy saving solutions: hull cleaning, biofouling
• Energy efficiency upgrades & retrofits, including
shore power capacity
Operational improvements
• Optimize each port pair of the voyage
• Collaboration with Customers
• Change management and digitalization, learn
between vessels including advanced weather routing
Asset replacement*
• 80-90% of fleet to consist of owned and long-term
charter vessels
• Initial orders likely to include LNG multifuel vessels
(with flexibility for conversion to low carbon fuels)
• From 2027 we will strive for alternative energy
sources and technology
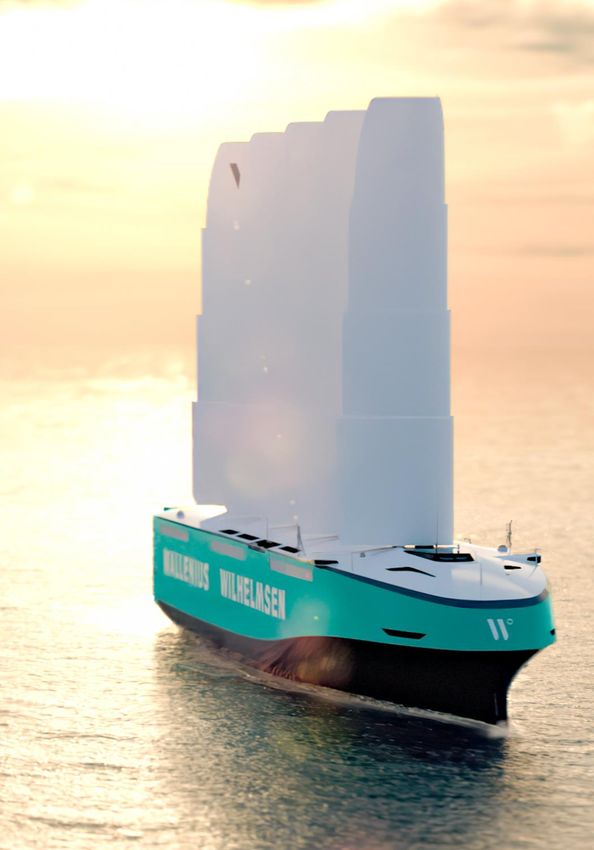
• Orcelle Wind viability studies ongoing
* Per early 2022, we are working to define our fleet renewal strategy and we will disclose the concrete plans when they are finalized
25
Note: The boxes do not represent share or magnitude of impact on CO2 intensity reductionKey Sustainability-Linked Bond characteristics based on Framework
CO2
KPI & Applicable Interim SPT
KPI: Average CO2 intensity, measured by weighted CII on the Controlled Fleet
SPT: The Company’s commitment of 27.5% reduction by 2030 from 2019 baseline
Applicable Interim SPT: A minimum 10.1% reduction in carbon intensity by the
Target Observation Date of 31 December 2025, calculated from base year 2019
Sustainability Structuring Advisor: SEB has advised in establishing the Framework
Bond characteristics Verification
o The KPI performance relative to the applicable interim SPT will be reflected in the
redemption price of the bond
o Redemption price will increase by 150bps if Wallenius Wilhelmsen fails to meet
the Applicable Interim SPT at the Target Observation Date, or fails on any
reporting and verification requirements
o In the event of the Applicable Interim SPT being met, and all reporting and
verification requirements are fulfilled, the redemption price will remain
unchanged
26Reporting and verification under the Framework
Reporting
o WalWil will provide annual Sustainability-Linked Finance Progress Reports with
information including KPI performance, any recalculations if applicable, and any
updates on the emission reduction strategy
o Sustainability-Linked Finance Progress Reports to be provided within 120
calendar days after the end of each year
Verification
Second opinion of the Framework;
Second opinion obtained from CICERO Shades of Green confirming alignment of
the Framework with the principles set out by ICMA
Verification of performance by a qualified third-party verifier
A third-party verifier will provide an annual review of company’s progress in terms
of the controlled fleet’s actual carbon intensity and its performance compared to
the targets in the trajectory
• DNV has verified the 2019 and 2020 KPI calculations
27Second Party Opinion by CICERO Shades of Green
Alignment with the Sustainability Linked Loan / Bond Principles
“Based on this review, this Framework is found in alignment with the principles.”
KPI
“The framework’s sole KPI is WalWil’s fleet average carbon intensity, using the Carbon Intensity Indicator (CII) as
measured by cgDIST (CO2 emissions per gross tonne-nm). We assess this KPI as material, strategically significant, and
backed by a robust and transparent methodology.”
SPT
“WalWil’s sustainability performance target (SPT) to reduce its KPI by 27.5% over 2019-2030 translates into
absolute emissions reductions that align with the Paris Agreement/1.5-degree goals, but only when also factoring
in WalWil’s historical reductions in a 2008-2030 timeframe.
The SPT’s ambition exceeds the 2030 target in IMO’s GHG strategy. WalWil’s strategy to achieve the SPT is credible
and depends on efficiency gains from operational/technical improvements. It also entails building new LNG dual-fuel
vessels and new ships powered by wind and as-yet commercially unavailable fuels. Although the LNG vessels can be
retrofitted to run on low-carbon fuels, their emissions may be locked-in as long as such fuels remain commercially
unavailable at scale.
We further assess the SPT as ambitious vs own performance in requiring new technological innovation, as well as
aligned with peer ambitions when compared with the average annual intensity reductions entailed by their 2030
targets.”
Note: The full second party opinion by Cicero can be found on our Investor website 28Agenda
1. WAWI in brief
2. Sustainability
3. Market update
4. Financial update
5. Investment highlightsHigh underlying demand from consumers not reflected in sales figure in Q1, for
2022FY we still expect increased sales figures despite the unrest in Eastern Europe
LV SALES LV DEEPSEA LIGHT VEHICLE SALES OUTLOOK
+8%
+3% +2%
YoY Q1-22*
(unit growth) -5.4% -5.9%
o We still expect increased sales figures o Semiconductor shortage due to: -14%
despite the unrest in Eastern Europe, o Vehicles more advanced over the 2020 2021 2022 2023
however inflation might reduced past 5-10 years
consumer confidence o Increased competition from
o Global LV sales do not reflect the high consumer electronics
underlying demand from consumers o Long lead-time to ramp up capacity
o Supply chain constraints prevent
increased production
Source: IHS Markit / Market Insight Wallenius Wilhelmsen. *Preliminary figures. Arrows indicate YoY growth compared to last quarter. 30Manufacturers struggling to meet strongest H&H demand since 2012 due to supply issues
Limited direct impact on addressable machinery cargo from Russian invasion but further disruptions to supply chains
CONSTRUCTION MINING AGRICULTURE OEM SALES OUTLOOK3
+25%
+14%
YoY Q4-211,2
(unit growth) +28% +65% +4% +7%
o Strengthening construction o Disrupted metal supply (RUS/ o Disrupted food supply (RUS/UKR)
activity UKR) o Food prices at all-time high yield
-13%
o Builder sentiment back to pre- o Metal prices around all-time strong farm income
pandemic levels highs o Moderating farmer sentiment on 2020 2021 2022 2023
o Strong machinery demand o Miner earnings at 2-3x decade accelerating cost inflation
o Depleted inventories and robust average o Strong but moderating equipment
backlogs o Upward revisions of miner demand
o Signs of easing supply capex estimates o Depleted inventories and strong
bottlenecks pre Russian invasion o Strong machinery demand still order backlogs
well below decade-old peak
Source: 1IHS Markit | World construction & agriculture equipment exports (avg. equipment value >20 kUSD ) (Units last 3 months, YoY) per December 2021. Data is limited to countries having reported customs data as per March 3rd, 2022.
2Parker Bay | Large Mining Equipment Deliveries (Units last quarter YoY). Arrows indicate YoY growth compared to last quarter. 3Factset Data and Analytics (April 3rd, 2022) | OEM revenue consensus estimates per calendar year (USD).
31
Constituents: Volvo, Caterpillar, CNH, Hitachi, Deere, Terex, Doosan, Sandvik, Epiroc and AGCO. Estimates include sales of constr./mining/agri. equipment onlyTight tonnage situation - limited recycling and orderbook relatively low
New orders have a lead time of 3-4 years. Easing of current supply chain inefficiencies will add capacity
GLOBAL FLEET*
End Q1
(end Q4)
#43 (43) #47 (39) 95% (96%)
vessels built between fleet utilization rate in
vessels in orderbook
1983 and 1997 2022
Source: Clarksons Platou, *for vessels above 4000 CEU, Utilization rate calculated on the basis of total global fleet (supply) and vessel capacity (demand)
32Agenda
1. WAWI in brief
2. Sustainability
3. Market update
4. Financial update
5. Investment highlightsFinancial highlights – Q4 2021
RESULTS (USDm) KEY FINANCIAL METRICS
Total revenue Adjusted EBITDA ROCE* (%)
Q3-21 Q4-21
990 1 078 306 +7.6
10.2
Group
822 223
150 +3.8
Net profit 65 98
862 279
787
593 195
Adj. EBITDA
Shipping
112 22.5% 28.4% Equity ratio (%)
margin
+1.7
205
184 199 28 36.0 +0.3
24
21
Logistics
Cash 587 710
67 15 ND/Adj. EBITDA (x)
61 60
11
3 403 3 418
Gov’t
7
Net debt
-2.4
4.0 -0.8
Q4’20 Q3’21 Q4’21 Q4’20 Q3’21 Q4’21
* Annualized quarterly ROCELeverage below pre-pandemic levels on higher EBITDA and lower net debt
Total revenue, USDm Adjusted EBITDA, USDm
4 063 3 909 3 884 837 865
706
3 027 2 958 606
536
2017 2018 2019 2020 2021 2017 2018 2019* 2020 2021
Net Debt, USDm NIBD/ Adj. EBITDA
3 646 3 427 3 418
2 968 3 100 6.4
5.1
4.2 4.4 4.0
2017 2018 2019* 2020 2021 2017 2018 2019 2020 2021
* The implementation of IFRS16 led to an increase for EBITDA and Net debt from 2018 to 2019 35Solid balance sheet and strong cash position
COMMENTS BALANCE SHEET 31.12.2021 Liquidity position 31.12.2021
USD billion USD million
• Equity ratio at 36.0%
Assets Equity & Liabilities
• Solid cash position of USD 710m
7.8 7.8
• Net debt at USD 3.4bn 1 059
349
• No material capex commitments 2.8
• 2022 bond, lease and bank maturities
710
planned refinanced during the next 12
6.3
months
3.6
• Bond maturities amount to USD
133m
• Bank and lease maturities to USD
1.5 1.4
160m
Cash Undrawn Total
Equity facilities
Non-current assets
Current liabilities
Current assets
Non-current liabilities
36Resilient free cash flow has largely been applied towards reducing net debt
Free cash flow* Net debt repayment (debt uptake less debt repayment)
USD million USD million
178 178
180 40
28 30
160 20
1
0
140
118 -20 -11 -15
120
104 -40
100 96
86 -60
80 71 76
-80
-79 -74
60
-83
-100
47
40 33 37 -120 -109
24 -119
20 -140 -134
-160 -150
0
Q1’19 Q2’19 Q3’19 Q4’19 Q1’20 Q2’20 Q3’20 Q4’20 Q1’21 Q2’21 Q3’21 Q4’21 Q1’19 Q2’19 Q3’19 Q4’19 Q1’20 Q2’20 Q3’20 Q4’20 Q1’21 Q2’21 Q3’21 Q4’21
* Free cash flow defined as Net cash flow from operating activities less Investments in vessels, other tangible and intangible assets, less Interest paid including interest derivatives. 37Agenda
1. WAWI in brief
2. Sustainability
3. Market update
4. Financial update
5. Investment highlightsInvestment highlights
Global market leader in vehicle logistic segment
Long-term customer base and diversified business model
Strong history of free cash flow
Solid market fundamentals and results
Ambitious carbon target and commitment to sustainabilityAPPENDIX
Financing and covenants primarily on business unit level

   Unit / segment                             Wallenius Wilhelmsen ASA

   Typical covenants within the segment      Limitation on ability to pledge assets

      Shipping, Government                                           Logistics

      Minimum liquidity                                              Minimum liquidity

      Current assets / current liabilities                           Net debt / EBITDA

      Loan to value clauses                                          Equity ratio

      Fixed charge / interest coverage
Investors demand transparency on issuers’ sustainability issues and targets
Certain high yield investors have developed a list of 21 questions which we answer in the next slides
ESG questionnaire: General industry
Please list the industry’s three biggest sustainability (ESG) related challenges and • Tackling the climate crisis and reducing GHG emissions in line with the Paris Agreement is the defining challenge and
briefly describe the process for identifying these challenges opportunity of the shipping industry.
• Responsible vessel construction and end of life dismantling. The former includes the use of materials with a lower
environmental impact while the latter necessitates responsible processing where human rights are respected and high
standards of safety and employee welfare are maintained.
• Transition to renewable energy and full scale adoption of zero emission vehicles for our logistics services, i.e. distribution and
handling of rolling cargo. This will eliminate climate gasses and local criteria emissions.
• The identification of these priority industry challenges stem from our materiality analysis. The challenges listed are those of
greatest importance to the company and its stakeholders.
Does the company have a Science Based Target, report to the CDP or engage in any In 2021 we committed to setting a science-based target.
similar sustainability initiatives?
We reported to CDP for the first time in 2021 and received a C grade. Link.
In 2021 we signed the UN Global Compact.
Have you conducted any preliminary assessments of your company in relation to the We have assessed our eligibility of CAPEX, OPEX and Revenue as required for 2021 reporting. We will assess alignment with the
EU Taxonomy? If so, what was the outcome? EU taxonomy during 2022 and report on the outcome in annual report for 2022 at the latest.
Source: Investors demanding transparency on bond issuers’ sustainability issues and targets (initially a demand by Carnegie Fonder & Spiltan Fonder) 4221 ESG questions: Environment (1/2)
ESG questionnaire: Environment
Please list the firm's three primary risks related to climate change and if any, the firm's Risks
climate related opportunities • Transitioning to low emitting propulsion technologies with uncertain long-term viability.
• Lock-in emitting fuels that become less competitive during ships’ lifetime.
• Increased costs to ensure compliance with emerging regional and international climate regulations.
Opportunities
• A progressive approach to decarbonization will strengthen our position as an employer of choice and facilitate attracting and
retaining talent.
• Decarbonization will strengthen our competitive position amongst existing and new customers.
Does the firm anticipate any climate related investments, and if so to what extent? • Yes, we anticipate climate related investments for both our ocean fleet and land-based assets:
For the ocean fleet, this involves operational improvements and technical upgrades of existing vessels and particularly acquisition
of new vessels with lower carbon emissions.
For our land-based assets, we have committed to all new equipment being zero-emissions from 2023 and we are continuously
working on sourcing electricity from renewable/sustainable sources.
Circular Economy: how are purchases and waste managed? If the firm rely on any scarce • All of our waste is delivered to and managed by reputable waste management services. Our vessel unloads waste in the harbours
resources, please describe what efforts are made to mitigate the risk of those resources where it will be responsible managed. As stated in our environmental policy, we strive to keep waste to a minimum through
becoming scarcer in the future, e.g. recycling, reusing substitutes or improved resource continuous focus on the management of resources and responsible recycling.
efficiency?
• We recycle our vessels in line with our Responsible Vessel Recycling policy and we are a founding members of the Ship Recycling
Transparency Initiative.
Please disclose your Scope 1, 2 & 3 GHG emissions. If not available, do you have a time 2021 - GHG emmissions
plan for when to start reporting? Scope 1 – 4 591 612 tonnes
Scope 2 – 7 236 tonnes (does not include offices)
Scope 3 – ~2 000 000 tonnes is estimated following SBTi’s generic industry guidance.
A comprehensive Scope 3 assessment is underway
For more information refer to the Sustainability section in our Annual report
Have you set a target to become carbon neutral? If so, how have you defined carbon We have not yet set a target to become carbon neutral. However, we have committed to reduce our CO 2e intensity* by 27.5%’** by
neutrality? 2030 (base-year 2019) and to source all energy from sustainable sources by 2050.
*gCO e/t*km
2
**Please note that our corporate CO2e intensity target should not be confused with the KPI and SPT as described in WaWi’s Sustainability Linked
Framework on page 13. Our corporate intensity target is wider in scope and as such includes CO2-equivalent emissions on a Well-to-wake basis,
including
Source: Investors demanding sustainability and transparency of all HY bond issuers (initially a demand by Carnegie Fonder & Spiltan Short-term Time Chartered vessels. The CO2e intensity is calculated per tonne * km.
Fonder) 4321 ESG questions: Environment (2/2)
ESG questionnaire: Environment
Transition related risks (for example changed customer preferences or legislation): Do you In addition to the identified climate risks listed on the previous page, we anticipate increased focus from investors, lenders, and
anticipate any risks or opportunities due to the transition to a carbon neutral society? Is insurance companies regarding our climate impact. This may result in increased cost of capital and insurance. On the other hand,
there any risk of the firm’s offer being negatively affected? If yes, how has the firm we may experience increased access to capital and better rates following continuous high focus on reducing GHG emissions and
positioned itself to handle that risk? sustainable business conduct.
Also, changes in consumer awareness and preferences may incentivize production closer to end markets to reduce emissions or
value chain complexity, thus reducing the need for deep sea shipping and related work.
99% of our CO2e emissions and our financially material climate risks are related to shipping. To address this risk, we have set an
ambitious carbon intensity reduction target (gCO2e/t*km) of 27.5% by 2030, compared to 2019. We are also currently assessing
our fleet strategy to ensure a competitive and future proof fleet.
Please list the firm’s (1-2) primary means of making a positive environmental impact or • GHG emissions – UN SDG 13 Climate change:
minimising negative environmental impact . Please list the corresponding most relevant • Introduce technical upgrades (hull & propulsion, machinery & systems, asset replacement)
UN Sustainable Development Goals. What proportion of sales can be directly linked to • Operational improvements ( Low carbon fuels, emissions energy management, planning and network optimization)
selected UN SDGs? • Asset replacement (future proof new-buildings and new long-term charters)
• Biodiversity – UN SDG 15 Life below water:
• Biofouling management (Hull cleaning, propeller polishing, underwater inspections dry-docking)
• Invasive species –(Ballast water management systems, including treatment)
• Cetacean preservation
Source: Investors demanding sustainability and transparency of all HY bond issuers (initially a demand by Carnegie Fonder & Spiltan Fonder) 4421 ESG questions: Social
ESG questionnaire: Social
Does the firm have a history of accidents? If so, how have these been managed? Are • Wallenius Wilhelmsen track all incidents, including first aid, medical treatment, lost time injuries and quality incidents. Any fatalities,
there any preventive measures, such as policies? lost time injuries and frequency are reported in our annual report.
Our approach to health and safety are stated in our separate policies for Shipping and Logistics.
• In 2021 we unfortunately experienced 1 work-related fatality(contractors) due to a driving accident.
• Our Lost Time Incident Frequency (LTIF), per million man-hours:
• Logistics – 14.96 in 2021, up from 13.94 in 2020,
• Shipping - 0.88 in 2021, down from 0.99 in 2020.
If applicable, please state your targets for gender and cultural equality and indicate the Diversity & inclusion – 2021
relative split of men/women at every level of the firm, particularly the Board of Directors • Gender balance total: 75% male, 25% female
and management team • Gender balance production workers: 82% male, 18% female
• Gender balance office workers: 61% male, 39% female
• Board of directors: The board of directors has 6 members of which 50% are women.
• Top Executive Team: Has 4 members, 100% male
• Gender balance office workers in senior roles (male:female) 79% : 21%
• We target to change gender diversity of office workers in senior roles (M:F) to 65% : 35% by 2030.
Does the company conduct any other community engagement activities aside from those We encourage our employees and local offices to be a positive force in their local communities. As such Wallenius Wilhelmsen and our
directly connected to the business? employees are involved in numerous activities and charitable events world-wide. Some examples below:
• Financial contribution to the humanitarian and recovery efforts following the typhoon Rai, Philippines in 2021
• Local offices and production sites participates in annual local beach and river clean-up events in relation to World Ocean Day, Global
• Donation of food and other necessities due to tropical storms Amanda and Cristobal, El Salvador
• Food drives for local food pantries, USA
• Rutherford Works – Formalize work-based learning programs for High School juniors and seniors, USA
• Financial donation to help St Martin Diocesan Home for children pay for general repairs of the building and refurbishment of furniture,
South Africa
How often does the firm conduct audits of its suppliers, and how often do you discover In 2021 we published our Sustainability Supplier Code.
incidents not compliant with your code of conduct? The Code is applicable to all suppliers, subcontractors, agents, and other business partners of Wallenius Wilhelmsen. The supplier Code
includes, but is not limited to, human and labor rights, equal opportunity and diversity in employment, harassment, health, safety and
environment, compensation and anti-corruption. We are currently developing our supplier management approach. In 2021 we issued the
supplier Code to 25 key suppliers and received 96% acknowledgment.
Wallenius Wilhelmsen has yet to establish a supplier audit program but will conduct a risk assessment of our supply chain in 2022. As per
our procurement policy we are committed to prioritize suppliers who have sustainable and ethical practices within their respective
Source: organizations
Investors demanding sustainability and transparency of all HY bond issuers (initially a demand by Carnegie Fonder and who drive such practices throughout their own supply chain.
& Spiltan Fonder) 4521 ESG questions: Governance (1/2)
ESG questionnaire: Governance
Do all staff members receive continuing education on anti-corruption? Is there an external • At Wallenius Wilhelmsen we strive to work in an atmosphere of openness and responsible and ethical business conduct.
whistle-blower function? Are there any ongoing or historical incidents involving corruption, • Our Code of Conduct is available publicly and is part of our onboarding procedures, training program and confirmed annually.
cartels or any other unethical business conduct? Have any preventive measures been During 2021, our annual code of conduct training involved e-learning for our IT-enabled employees and extensive workshops were
taken? conducted for employees without PC. Senior management, BoD and other relevant staff receive regular training on business
ethics and anti-corruption
• We want to hear any concerns about how we operate and do business. The Alert line is a confidential service that can be
accessed from any location and is hosted by an independent third-party. Concerns may be made anonymously and can include
Health, Environment and Safety breaches to fraud, corrupt activities, conflicts of interest, working environment issues, bullying
and harassment.
• Wallenius Wilhelmsen has been part of anti-trust investigations in several jurisdictions since 2012. In 2021, we paid USD 149m
customer settlements and jurisdictional fines. At this time there are no further jurisdictional investigations ongoing.
• When the investigations into the car carrying industry begun, Wallenius Wilhelmsen immediately took action to strengthen the
organization, policies, processes, and training to ensure full compliance with competition law. These actions include:
• The appointment of a Global Compliance Officer to oversee and manage regulatory compliance issues
• Reinforced training on our Competition Compliance Policy that outlines and reiterates the group requirements for
compliant industry communication and documentation
• The introduction of a global Alert line to encourage reporting of any noncompliant behavior.
Please state the firm’s business tax residence (i.e. where the firm pays tax) and explain why Wallenius Wilhelmsen ASA’s head office is located in Norway and as such is also the company’s tax residency.
that specific tax residence was chosen
How many independent members sits on the Board of Directors? 4 of 6 board members are independent
Please state if and to what extent, the company has transactions with related parties To some degree, e.g., with our ship management companies; Wallenius Marine and Wilhelmsen Ship management. For more
information refer to the note on ‘Related party transactions’ in our Annual report
Source: Investors demanding sustainability and transparency of all HY bond issuers (initially a demand by Carnegie Fonder & Spiltan Fonder) 4621 ESG questions: Governance (2/2)
ESG questionnaire: Governance
Which KPIs dictate the remuneration to management (are sustainability and diversity goals Wallenius Wilhelmsen’s remuneration policy covers all employees and is developed to ensure the Company attracts and retains
included)? competent employees. The board determines the Group CEO’s remuneration and establishes the framework for adjustments for
other employees.
The company has adopted two new incentive programs that went into effect 2021.
Senior Managers and higher at all sites around the world are eligible for a Global Incentive Plan that will incentivize and reward
sustainability (20% of this bonus will be tied to ESG performance).
Executive Equity Compensation is also provided to further incentivize the company's sustainability performance and objectives: 20%
of this equity compensation will be tied to ESG performance.
KPIs include CO2 intensity reduction targets, Health & Safety performance and Diversity and inclusion.
Describe the company’s process for monitoring and reporting ESG issues and performance The foundation of our overall ESG risk approach is a materiality assessment, conducted periodically to engage stakeholders in
to senior management/the Board. In your response please confirm what KPIs are identifying which ESG topics are material to our business and value chain. We systematically track ESG objectives and KPIs, and
monitored (if any) and how frequently reporting is undertaken data is collected and reported quarterly to the company's top management.
The Board of Directors review the company's Long-term Strategy, Annual Sustainability Report, and ESG objectives, metrics and
targets annually. The executive Team and BoD receive regular reports on ESG performance from the Chief Sustainability Officer.
Have you signed a Union agreement? Many of our employees are members of a relevant union. We have Collective Bargaining agreements in place in several areas,
including USA and the Americas where most of our production workers are employed. For instance, we have Labor Agreements for
different sites within the U.S. and Canada. These Agreements are not collective but rather separate Agreements for different sites
within North America. 335, or 18%, of our 1 885 US production workers are represented by a union.
As stated in our Code of Conduct we cooperate with employee representatives with the aim to achieve balance between the interests
of the company and those of the employee.
Source: Investors demanding sustainability and transparency of all HY bond issuers (initially a demand by Carnegie Fonder & Spiltan Fonder) 47Risk factors (1/7)
Investing in bonds issued by the Company involves inherent risks. Prospective investors should carefully consider, among other things, all information in this Presentation, including the risk factors set
out below, before making an investment decision. This section addresses both general risks associated with the industry in which Wallenius Wilhelmsen ASA (the “Company”) or any of its subsidiaries
(such entities together, the “Group”) operates and the specific risks associated with its business. Further, this section describes certain risks relating to the Bonds which could also adversely impact
the value of the Bonds. It is not intended to be exhaustive – additional risks and uncertainties not presently known to the Group, or that it currently deems immaterial, may also impair the Group’s
business operations, financial condition, results of operations, cash flow and/or the value of the Bonds.
Investors should be mindful of the uncertainties that follow the coronavirus SARS-CoV-2 (“Covid-19”) pandemic when investing in the Bonds. The Covid-19 pandemic may adversely affect the likeliness
of occurrence and/or materiality of the risk factors presented in this Presentation, and could also impose additional risks that have not yet been identified by the Company or which are not considered
as material risks at the date of this Presentation.
The Group cannot assure investors that any of the events discussed in the risk factors below will not occur. If they do, the Group’s business, financial condition, results of operations and cash flows
could be materially adversely affected. In such case, the trading price of the Bonds could decline, the Company may be unable to pay all or part of the interest or principal on the Bonds, and an
investor may lose all or part of its investment. An investment in the Bonds is suitable only for investors who understand the risk factors associated with this type of investment and who can afford a
loss of all or part of the investment.
This Presentation also contains forward-looking statements that involve risks and uncertainties. Actual results could differ materially from those anticipated in such forward-looking statements as a
result of certain factors, including the risks described below and elsewhere in this Presentation.
The following sets out various risk elements that are considered particularly relevant for investing in the Bonds. The order in which the risks are presented below is not intended to provide an
indication of the likelihood of their occurrence nor of their severity or significance.
Risks related to the Group and the market in which it operates
Risks related to Covid-19
The Covid-19 pandemic has caused, and is expected to continue to cause, severe disruptions in regional economies and the world economy and financial and commodity markets in general. The
transmission of Covid-19 and efforts to contain its spread have resulted in international, national and local border closings, travel restrictions, significant disruptions to business operations, supply chains
and customer activity and demand, service cancellations, workforce reductions and other changes, significant challenges in healthcare service provision and delivery, as well as considerable general
concern and uncertainty, all of which have negatively affected the economic environment and may in the future have further and larger impacts.
The Group has experienced significant negative impact on the demand for both ocean transportation and landbased services. For instance, plant closures in Asia caused parts shortages, disrupting the
inbound supply chain to vehicle production leading to lower output and less volumes shipped.
While the impact of the COVID-19 pandemic is not expected to last indefinitely, the circumstances relating to the pandemic are dynamic and its impacts on the Group’s business operations is difficult to
predict. Disruptions caused by the pandemic may lead to a decline in customers’ production or ability to pay for the Group’s services, which could result in decreased demand for its vessels and services.
Customers’ inability to pay could also result in their default on the Group’s current contracts. A decline in the amount of services requested by the customers or customers’ default on the Group’s
contracts with them could have a material adverse effect on the Group’s business, results of operations, cash flows and financial condition.
48You can also read