Sustainable UFC Structures in JAPAN and its Durability Performance
←
→
Page content transcription
If your browser does not render page correctly, please read the page content below
Third International Conference on Sustainable Construction Materials and
Technologies http://www.claisse.info/Proceedings.htm

                       Sustainable UFC Structures in JAPAN
                             and its Durability Performance
        Hiroyuki MUSHA1, Katsuya KONO2, Tetsuo KAWAGUCHI 2, and Tadashi KOBAYASHI 3
                              1
                               Technology Center,Taisei Corporation,Japan
                 344-1 Nase-cho,Totsuka-ku,Yokohama-shi,Kanagawa,245-0051 JAPAN

            2
              Cement & Concrete Department,TAIHEIYO CEMENT CORPORATION, Japan
                            2-4-2,Osaku,Sakura City,Chiba,285-8655 JAPAN

             3
               Quality and Safety Management Division,Maeta Concrete Industry Ltd.,Japan
                        6-7,Kamihon-cho,Sakata-shi,Yamagata,998-8611 JAPAN

       ABSTRACT

       The application of the Ultra-high strength Fiber reinforcement Concrete (UFC) to the many
       kinds of structure has been increasing in recent years in Japan. UFC application in the PC
       bridge field is advanced because of taking advantage of thin members and weight reduction
       achieved by these ultra-high strength and high durability. Sakata Mirai footbridge is the first
       UFC structure in Japan completed in October 2002. Using UFC, the very thin members as
       thickness of 8-15 cm and the long simple beam span as 50 m have been achieved in the
       bridge. Since the bridge is located in severe corrosive environment, a field investigation was
       conducted to verify its 10 year’s durability performance. In this paper, the cases about the
       UFC bridges where various unique technologies are applied are introduced. Then, the
       examinations for durability and the mechanical properties of the ten years old UFC bridge
       are reported.

       Keywords. UFC, ultra-high strength, fiber reinforced, bridge, durability

       1. INTRODUCTION

       UHPFRC is an abbreviation of ultra-high performance fiber reinforced concrete, and there
       are various kinds of UHPFRC materials in the world. Then, UFC (Ultra-high strength Fiber
       reinforcement Concrete) is a kind of UHPFRC. This UFC (JSCE, 2004) has extremely high
       durability because of the fine structure of the matrix. UFC not only has ultra-high strength
       but also has high toughness by the effect of the steel fiber reinforcement. Since UFC has
       such toughness, rebars are not usually used in any UFC structures. This remarkable
       characteristic distinguishes UFC from other UHPFRC materials. UFC, which was developed
       based on “Reactive Powder Composite Material” (Richard, 1994), is the most applied
       UHPFRC materials for actual structures all over the world. Especially, UFC applications to
any kinds of structures such as bridges, buildings, tunnel lining, have been increasing, and
more than twenty UFC structures were constructed in recent ten years in Japan.
UFC application in the PC bridge field is advanced because of taking advantage of thin
members and weight reduction achieved by these ultra-high strength and high durability. The
structure, which was not able to be achieved with conventional concrete like a long span
simple beam exceeded 50 m and a very thin thickness of 8-15 cm, became possible by the
application of UFC to the PC bridge.
Sakata Mirai footbridge (Musha, 2002) shown in Photo 1 has been completed for the first
time applying UFC in Japan in October 2002. The location of the bridge is about 3.4 km
from the Japan Sea coastal line therefore this bridge is exposed by severe corrosive
environment in winter. Authors have been periodically investigating the durability and
strength performance of this bridge.
After Sakata Mirai Bridge, more than 20 of UFC bridges have been completed in Japan until
today. It also applied to an airport runway slab in a large scale. Various new technologies
were developed by using the UFC characteristic, and those technologies have been applied to
these UFC structures.
In this paper, the cases about the UFC bridges where various unique technologies are applied
are introduced, and those features are described. Then, the examinations for durability and
the mechanical properties of the ten years old UFC bridge are reported.

                                                Table 1 Composition of UFC
                                               mixed ingrediant                        super
                                             (cement, silica fume,   water   fiber                W/C
                                                                                     plastcizer
                                     unit        quartz, etc)
                                        3
                                    kg/m             2254             180    157        24        22

Photo 1 Sakata Mirai foodbridge             Fig. 1 Compressive strength frequency
                                                           (JSCE, 2004)

2. FEATURES OF UFC

2.1 Basic formulation of UFC
The formulation of UFC is shown in Table 1. The major principles are as follows; 1)
minimum of defects such as micro-cracks and pore spaces by extremely low water/cement
ratio (=22%), 2) enhancement of compacted density by optimization of the granular mixture,
3) enhancement of the microstructure by heat treatment, and 4) enhancement of ductility by
incorporating steel fiber. The self-levelling performance is achieved that a flow value (JIS-
R-5202.11) is around 220-280 mm for the material temperature of 20~25oC even for
including the steel fiber (0.2 mm in diameter, 15 mm in length) by 157 kg/m3 (2% in vol.) in
the matrix. Therefore it is possible to cast it into the very thin shell mold or into the
complicated shaped mold. The segregation or sinking of steel fiber from the matrix does not
occur because of the viscosity of the paste. However it is noted that the orientation of the
steel fiber should be controlled to distribute in all directions when casting.

2.2 Mechanical properties
The mixing plant for the fabrication of pre-cast segments uses an ordinary mixer. For the
mechanical quality management of the material, 6 test cylindrical specimens with the size of
φ10x20 cm for compressive strength and 3 test specimens with the size of 10x10x40 cm for
flexural strength were sampled for each pre-cast segments. All samples with 90℃ heat
treatment for 48 hours were cured in the same way as the pre-cast segments. Fig. 1 (JSCE,
2004) indicates the frequency distribution of compressive strength showing the mean value
is 196 N/mm2 and the standard deviation is 7.1 N/mm2 for the data number N=48. On the
other hand, the results of flexural strength was that the mean value is 36.5 N/mm2 and the
standard deviation is 4.5 N/mm2 for the data number N=24.
The incorporation of small-size steel fibers results in ultra-high energy absorption
capabilities. The bending fracture energy is 36,000 N/mm2, on the other hand one for the
ordinary concrete with compressive strength 30~50 N/mm2 is at most a range of 50~200
Nm/m2. The high-tensile strength combined with the high ductility makes conventional rebar
reinforcement unnecessary.

2.3 Durability
The matrix of UFC forms a dense structure due to the densest packing and microstructures
resulting from pozzolanic reaction of silica fume. The pore size distribution of UFC is
therefore quite different from the ordinary concrete. Fig. 2 and Fig. 3 (JSCE, 2004) show the
comparison of pore size distribution between UFC and the ordinary high strength concrete
with W/C=30%. The relationship between the pore volume ratio and the pore diameter was
predicted by applying a mercury intrusion porosimetry apparatus. The pore structure is
designated depending on the pore size; i.e. it is defined as ‘Gel Pore’ for the size up to 10 nm
on the other hand it is defined as ‘Capillary Pore’ for the size from 10 nm to 1μm. The
capillary pore is a continuous pore like ameba and this is related to the water permeability;
i.e. the lesser the capillary pore the better durability. It is obvious that UFC is extremely
denser structure than the ordinary concrete, as Fig. 2 showing that the pore volume ratio of
UFC for either heat curing or curing in water are 4.3-4.5%, hence that for high strength
concrete with W/C=30% is 9.0%. In addition, the pore volume ratio of capillary pore of UFC
is only 0.5%, hence that for high strength concrete is 5.8%.
  Carrying out 1100 freezing and thawing cycles in accordance with JIS A 6204 produces no
adverse effect on the specimens; i.e. no relative dynamic elastic modulus reductions for 1100
cycles. The extreme denseness of UFC makes it difficult to determine the diffusion
coefficient of chloride ions. For the estimation of chloride diffusion coefficient, the specimen
with 10x10x40 cm was immersed in a NaCl solution (1.9% consistency) for couple of years
and EPMA (Electron Probe Micro Analyzer) was used to predict the apparent chloride
diffusion coefficient through the regression curves to fit the chloride concentration
distribution near the specimen surface. Fig. 4 demonstrates the chloride ions concentration
profiles after different immersed periods. The pixel size was 0.02 mm and every five-pixel
data were averaged in depth direction; i.e. the interval of averaged data in Fig. 5 is 0.1 mm.
The chloride concentration distribution measured by EPMA for different immersed periods
is illustrated in Fig. 5. The regression curves to fit the chloride ions concentration designate
the apparent chloride diffusion coefficient for those different immersed periods. The chloride
diffusion coefficients determined by this method are shown in Table 2. Those results imply
the apparent diffusion coefficient ranging from 0.0019 to 0.0059 cm2/year. For comparison,
the value for conventional high strength concrete with W/C=30%, which is regarded as
having relatively high durability, is 0.14 cm2/year. The durability properties of UFC
therefore show a striking difference from those of the conventional normal concrete.
10 10-60 μm
1-10 μm
9
0.5-1 μm G.P.=gel pore
1.4 UFC, heat curing
8
pore volume ratio (%)
100-500 nm
pore volume ratio (%)
C.P.=capillary pore 1.2
7 10-100 nm
6-10 nm 1 UFC, curing in
6
3-6 nm
C.P. water 91d
5 0.8
4 C.P. C.P. W/C30%, curing in
0.6 water 91d
3
2 G.P.
0.4
G.P.
1 G.P. 0.2
0
UFC, UFC, W/C 30%, 0
heat curing curing in water curing in water 0.001 0.1 10
91d 91d pore diameter (μm)
Fig. 2 Comparison of pore volume ratio Fig. 3 Pore volume ratio distribution
(JSCE, 2004)
8
7 0.5 year
concentration (kg/m3)
6 1.5 years
5
chloride ions
2.5 years
4
3
2
1
0
0 1 2 3 4 5
distance from surface (mm)
Fig. 4 Chloride profiles after different periods (JSCE, 2004)
(surface) (wt.%) (kg/m 3 ) (surface) (wt.%) (kg/m 3 ) (surface) (wt.%) (kg/m 3 )
0
0
0
15.5 15.5 41.3
13.4 13.4 31.0
1
1
1
11.6 11.6 25.8
9.8 9.8 20.6
2
2
2
7.7 7.7 15.5
3 (mm)
3 (mm)
3 (mm)
5.7 5.7 10.3
3.9 3.9 5.2
2.1 2.1 2.6
0.0 0.0 0.0
0.5year 1.5year 2.5year
Fig. 5 Chloride ions distribution by EPMA (immersed case)
Table 2 Apparent chloride ion diffusion coeff. (immersed case)
immersed priods (year) 0.5 1.5 2.5
2
apparent chloride diffusion coeff. (cm /year) 0.0059 0.0022 0.0019
3. APPLICATIONS OF UFC TO STRUCTURES
UFC is applied to many kinds of structure in Japan. There are footbridges, road bridges,
roofs, sunshades, tunnel linings, slabs and so on. Since UFC makes it possible to reduce the
dead weight of the structure drastically and possible to extend a beam’s span largely, UFC
has been applied to many bridges. There are more than 20 UFC bridges in Japan, now. Three
typical UFC bridges are introduced as follows.
3.1 Sakata Mirai Bridge
This footbridge is a single-span PC box girder bridge and has a 49.4 m span shown in Photo
1 (Musha, 2002). It is the first PC bridge in Japan to utilize UFC. The bridge has very thin
members. The thickness of the top slab is only 5cm and the web is 8 cm (Photo 2), since
there is no rebar inside. The body of the bridge is 53 tons, or about one-fifth the weight of a
conventional concrete bridge. The low girder height is only 55 cm at girder ends despite its
long span length (50 m). The standard girder height-span ratio is about 1/17 for simply
supported box girder bridges having a span of about 50 m, but this bridge has a ratio of 1/90
at the girder ends and a ratio of 1/32 at the center of the girder (1.56 m in height). Utilizing
material high performance fully, the distinctive design was realized; i.e. the low girder height
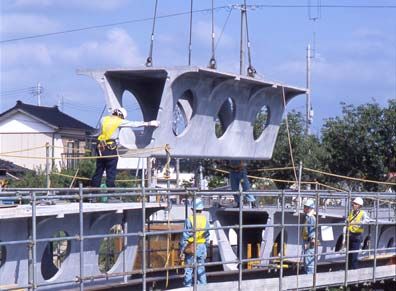
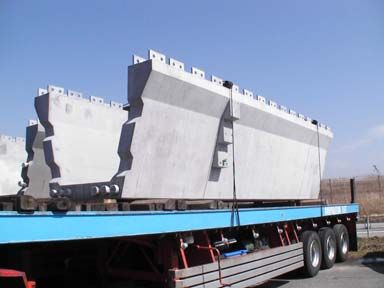
and the large circular holes in the webs (Photo 3).
Photo 2 Sakata Mirai Bridge Photo 3 Erection of precast block
3.2 Mikaneike Bridge
This 81.2 m in length and 3.5 m in width PC bridge is a two-span (2x39.3 m) continuous PC
box girder bridge shown in Photo 4 (Musha, 2007).
The girder height is 1.0 m so the ratio of girder height-span is 1/40. The top slab is 7 cm
thick, the bottom slab is 8 cm thick and the web varies from 8 to 20 cm thick. The box girder
was divided into top slabs and lower U-shaped girders (Photo 5) for pre-cast segment
production. The U-shaped pre-cast segments were connected together by wet joints. PBL
(Photo 5), which is the abbreviation of the Perfobond Strip shear connector (which German
name is Perfobond Leisten), was used to connect the top slab and the U-shaped girder.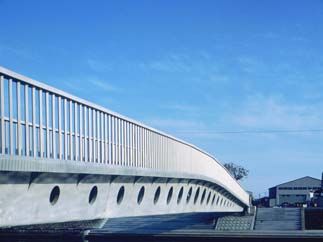
Photo 4 Mikaneike Bridge                 Photo 5 U-shaped girder and PBL

3.3 Tokyo International Airport (Haneda) GSE Bridge
The bridge structure is a single span pre-tensioned composite girder 48 m long shown in
Photo 6 (Musha, 2008). The girder type is determined in 3 box girders because of wide bridge
width 16.2 m. This bridge consists of UFC U-shaped girders (f’ck= 180 N/mm2) and
conventional cast-in-situ concrete slab (f’ck= 40 N/mm2). Since UFC does not require any
reinforcing bars, the web thickness utilizing its ultra-high strength is only 150 mm, achieving
a very slender form compared to the conventional concrete. UFC girders require heat curing
and shop fabrication to ensure quality, therefore, those are inevitably precast structure.
Taking into account the capacity of the lifting equipment at the shop, it was decided that each
segment of the precast girder should weigh less than 25 tons. Therefore the 47.6 m long main
girder was divided into seven precast blocks (Photo 7). After the UFC girders were erected
on the supports at the erection sites, the joint between the girders was filled with cast-in-situ
UFC to create a wet joint, and prestress was introduced to integrate the bridge body. The top
slabs and U-shaped girder were jointed together by PBL joints.

              Photo 6 GSE Bridge                    Photo 7 UFC precast block
                                                           (no rebar inside)

4. DURABILITY PERFORMANCE OF SAKATA-MIRAI UFC BRIDGE

Durability of UFC is verified by many kinds of laboratory tests using specimens. There are,
however, few field data for UFC durability. Since UFC is a relatively new material, the
verification of its durability based on actual structure is not enough, and it is essential for
further UFC's effective utilization. Therefore, the continuous investigations have been
conducting using Sakata Mirai Bridge. The periodic investigation into the bridge has being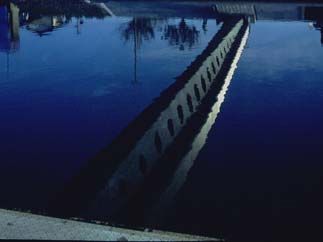
conducted at 0.5, 1, 2, 5, 7.5 and 10 years after its completion. This section introduces the
durability performance of UFC based on the field investigation.

4.1 Site location
Sakata Mirai footbridge is located in Sakata City, Yamagata prefecture facing to the Japan
Sea. The west coastline in Japan usually has severe west or southwest winds and snowy
storm in winter. Although the site location is 3.4 km far from the coastline, the seasonal
winter storms induce the chloride attack on the footbridge.

4.2 Secular distortion of mechanical properties
In order to investigate the material time history of mechanical properties and durability, UFC
specimens were exposed inside of the box girder of the footbridge as shown in Photo 8. The
dimension of the specimen for compressive strength is φ5x10 cm circular cylinder and that
for flexural strength is 4x4x16 cm regular prism. The result of compressive strength versus
exposing duration time is shown in Fig. 6 and those of flexural strength and first cracking
strength are shown in Fig. 7. The compressive strength seems to be gradually increasing but
it can be said that the strength is stable. It is noted that the average compressive strength in
Fig. 6 is larger than that in Fig. 1. This is because of the size effect on strength; i.e. the size
of specimens in Fig. 6 is small. The time dependent records of the flexural strength are also
stable. The strength of ordinary concrete has usually the upward trend in time, however UFC
had heat curing in the process of fabrication; therefore the chemical hydration has already
completed. This means the strength would not largely increase.

                                        Photo 8 Exposed specimens inside girder

                         230                                                               50
  compressive strength

                                                                                           40
                                                             first cracking and flexural

                         220
                                                                 strength (N/mm2)
       (N/mm2)

                         210                                                               30

                         200                                                               20

                         190                                                               10          max flexural strength
                                                                                                       first cracking strength
                         180                                                                0
                               0    24 48 72 96 120 144                                         0   24 48 72 96 120 144
                                   exposed periods (month)                                           exposed periods (month)
    Fig. 6 Records of compressive strength Fig. 7 Records of flexural strength
4.3 Chloride ions concentration profiles
The specimen with 4x4x16 cm regular prism that was exposed for 120 months (about 10
years) inside the box shaped girder (Photo 8), was sliced off 10 mm thickness. The
dimension of the test surface was taken to be 10 mm in width and 5 mm in depth from the
surface and this piece was grinded to apply EPMA. The chloride ions concentration profile
and the regression curve are illustrated in Fig. 8. The pixel size was 0.02 mm and every 5
pixel data were averaged in depth direction. The regression data was taken at deeper points
of 0.4 mm. It should be noted that compared to the test specimen that was immersed in a
NaCl solution (shown in Fig. 4), this concentration profile of the chloride ions is smooth and
fits the regression curve quite well. From the regression function, the apparent chloride ion
diffusion coefficient was predicted to be 0.000753 cm2/year (Table 3; left side of exposed
specimen) that is very small compared to the immersed case (Table 2) and the chloride ion
concentration on the surface was calculated to be 9.9 kg/m3. Fig. 9 indicates the chloride
distribution obtained by EPMA and the chloride ions concentration profile and the regression
curve are illustrated in Fig. 10 in two directions. It is apparent that the chloride ions
penetrated into just surface of the specimen such as 1 to 2 mm and the level of permeation of
the chloride ions is equivalent with that of immersed case (Fig. 5).
8 Upper side
7 EPMA result
chloride ions concentration
6 regression curve
5 Left Right
4 side side
(kg/m3)
3
2
1
0
0 1 2 3 4 5
distance from surface (mm) Lower side
Fig. 8 Chloride ions profile Fig. 9 Results of EPMA
(exposed specimen)
8 8
chloride ions concentration
chloride ions concentration
7 7
6 6
5 5
(kg/m3)
(kg/m3)
4 4
3 3
2 2
1 1
0 0
0 5 10 15 20 25 30 35 40 45 0 5 10 15 20 25 30 35 40 45
depth(mm) depth(mm)
Upper side Lower side Left side Right side
Fig. 10 Chloride ions distribution (exposed specimen)Photo 9 Test piece from web Photo 10 Core drilling in web
However these valuable durability data were obtained from the specimen exposed in the
girder, it is necessary to verify that these data reflect the state of the actual bridge. Then test
pieces (Photo 9; φ2.5x8 cm circular cylinder) were obtained by core drilling from the both
side of the web (Photo 10), and the similar analysis was executed. The chloride ions
concentration profile and the regression curve are illustrated in Fig. 11. The chloride
diffusion coefficients and the surface chloride ion concentration are shown in Table 3. The
strong sea breeze blows the web of the bridge, therefore the surface chloride ion
concentration of the outside of the sea side web is relatively big. Even though the surface
chloride ion concentration is big, its chloride diffusion coefficients are the same level to
other sides (i.e. outside of the mountain side web).
8 8
chloride ions concentration
chloride ions concentration
7 7
6 Sea side web 6 Mountain side web
5 5
(kg/m3)
(kg/m3)
4 4
3 3
2 2
1 1
0 0
0 10 20 30 40 50 60 70 80 90 0 10 20 30 40 50 60 70 80 90
depth(mm) depth(mm)
Outside (sea side) Inside Inside Outside
Fig. 11 Chloride ions distribution (core test piece)
Table 3 Apparent chloride ion diffusion coeff. (field data)
Apparent chloride diffusion coeff. Surface chloride ion concentration
Face 2 3
(cm /year) ( kg/m )
Upper 0.0001730 7.1
Lower 0.0002700 4.9
Exposed specimen
Left 0.0007530 9.9
Right 0.0003320 7.0
Core test piece of Inside 0.0000503 3.8
sea side web Outside 0.0000667 21.1
Core test piece of Inside N/A 0.7
mountain side web Outside 0.0000404 8.6The chloride diffusion coefficients determined from the test-pieces obtained by core drill are
same or less than those of the specimens (placed inside of the girder). Since the chloride
diffusion coefficients obtained from the specimens kept inside of the girder are larger than
those of the actual bridge, it is possible to use those specimens to judge the state of the
bridge in the safety side.
4.4 Conclusions of durability investigations
1) The time dependent records of compressive and flexural strength are stable.
2) Chloride ion diffusion coefficient obtained the field specimen is much lower than that in
the laboratory immersed specimen.
3) Chloride ion diffusion coefficient obtained from the test-pieces by core drill is lower than
that the field specimen exposed in the girder.
4) Ten years old UFC bridge still keeps good condition with its mechanical property and its
durability against the sever circumstances, therefore the sustainability of UFC structure is
verified in terms of the 10 years investigation.
5. CONCLUSION
On Sakata Mirai Bridge, which was the first UFC structure in Japan, the superior durability
was confirmed by the investigation of ten years after the completion. However, for UFC
claimed to have the durability more than 100 years, it is still only ten years. Therefore, it is
necessary to continue this investigation in future, and the obtained data will be significant in
order to realize sustainable structures.
At a time when the superstructures of general PC bridges are constructed with concrete
having a compressive strength of 40-50N/mm2, the ability to construct long-span bridges
with a material having a compressive strength of 180N/mm2 without using rebar has brought
a new perspective to the world of concrete. It is hoped that this technology will strongly
accelerate the further development of concrete. And it is also hoped that this technology will
realize many sustainable structures as gifts to the next generation.
REFERENCES
JSCE, (2004)"Recommendation for Design and Construction Ultra High Strength Fiber
Reinforced Concrete Structures-Draft," Sept.
Richard, P.; and Cheyrezy, M. H. (1994). “Reactive powder concretes with high ductility and
200-800 N/mm2 compressive strength,” Metha, P.K(ed.), Concrete Technology: Past,
Present and Future, SP144-24, pp. 507-517
Musha, H.; Ohtake, A.; Seki, F.; Ohkuma, H.; Kodama, A.; Kobayashi, T, (2002). ”Design
and Construction of SAKATA-MIRAI Bridge Using of Reactive Powder
Composite,” Bridge and Foundation Engineering, vol.36,No.11, Nov., pp.1-10
Musha, H.; Ishida, Y.; Yamanoi, T.; Yamashita, T, (2007). “Mikaneike Bridge –The First
Continuous Girder Bridge Using Ultra-High Strength Fiber Reinforced Concrete,”
Journal of Prestressed Concrete Japan, JPCEA, Vol.49, No.5, pp.18-26
Musha, H.; Watanabe, N, Fukuhara, T, Haraguchi, K, Takeda, Y, Matsukawa, F, (2008).
“Experiments of girder joint in Tokyo International Airport(Haneda) GSE bridge
using UFC,” 8th International Symposium on Utilization of High-Strength and High-
Performance Concrete, pp.893-900You can also read