T OWNSVILLE 2019 FLOOD : INSIGHTS FROM THE FIELD - Bushfire & Natural ...
←
→
Page content transcription
If your browser does not render page correctly, please read the page content below
TOWNSVILLE 2019 FLOOD: INSIGHTS
FROM THE FIELD

Andrew Gissing, James O’Brien, Salomé Hussein, Jacob Evans and
Thomas Mortlock.
Risk Frontiers & Bushfire and Natural Hazards CRC
TOWNSVILLE FLOOD 2019 - POST EVENT DATA COLLECTION | REPORT NO. 468.2019

  Version        Release history                                    Date

  1.0            Initial release of document.                       12/03/2019

 All material in this document, except as identified below, is licensed under the
 Creative Commons Attribution-Non-Commercial 4.0 International Licence.

 Material not licensed under the Creative Commons licence:
       •      Department of Industry, Innovation and Science logo
       •      Cooperative Research Centres Programme logo
       •      Bushfire and Natural Hazards CRC logo
       •      Any other logos
       •      All photographs, graphics and figures

 All content not licenced under the Creative Commons licence is all rights
 reserved. Permission must be sought from the copyright owner to use this
 material.

 Disclaimer:
 Risk Frontiers and the Bushfire and Natural Hazards CRC advise that the
 information contained in this publication comprises general statements based
 on scientific research. The reader is advised and needs to be aware that such
 information may be incomplete or unable to be used in any specific situation.
 No reliance or actions must therefore be made on that information without
 seeking prior expert professional, scientific and technical advice. To the extent
 permitted by law, Risk Frontiers and the Bushfire and Natural Hazards CRC
 (including its employees and consultants) exclude all liability to any person for
 any consequences, including but not limited to all losses, damages, costs,
 expenses and any other compensation, arising directly or indirectly from using
 this publication (in part or in whole) and any information or material contained in
 it.

 Publisher:
 Bushfire and Natural Hazards CRC

 March 2019

 Citation: Gissing, A, O’Brien, J, Hussein, S, Evans, J, Mortlock, T 2019. Townsville
 2019 floods: insights from the field, Bushfire and Natural Hazards CRC, Melbourne,
 2019.

 Cover: Oonoonba flooding. Queensland Fire and Emergency Service.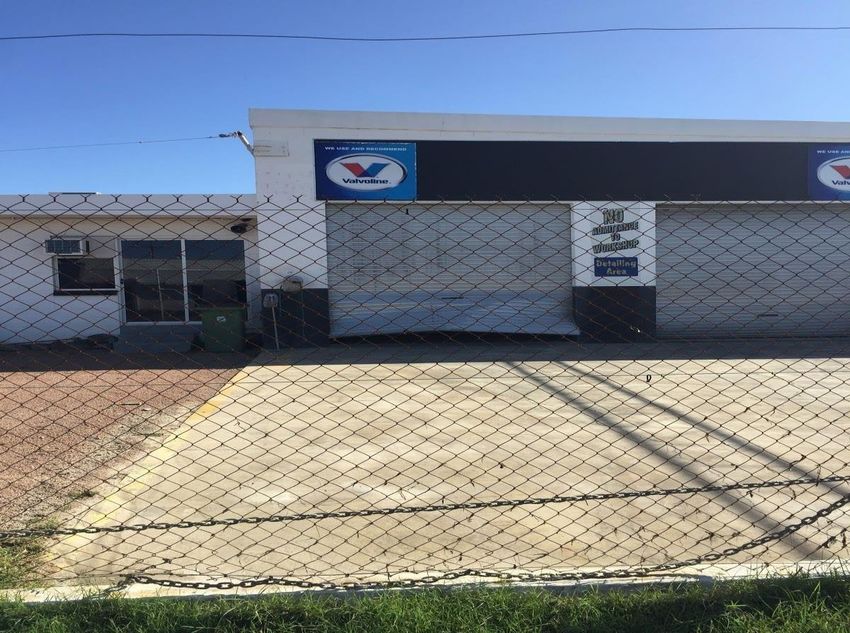
TOWNSVILLE FLOOD 2019 - POST EVENT DATA COLLECTION | REPORT NO. 468.2019
                                                                 1

TABLE OF CONTENTS

INTRODUCTION                                                           4

REASEARCH PREPARTION                                                   5

IMPACTS                                                                6

COMMUNITY RESPONSE TO WARNINGS                                        10

INITIAL RECOVERY                                                      11

DISCUSSION AND CONCLUSION                                             12

REFERENCES                                                            13

                                                                3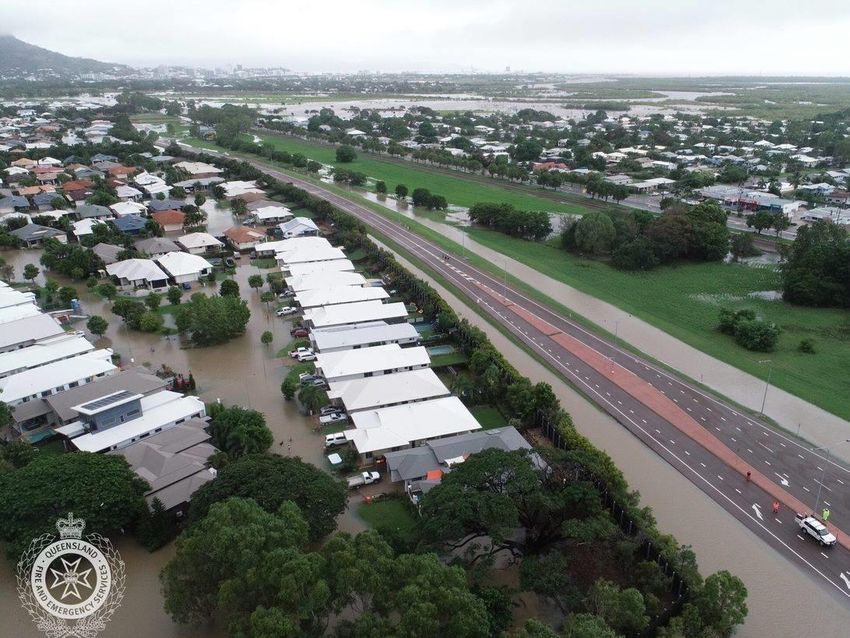
TOWNSVILLE FLOOD 2019 - POST EVENT DATA COLLECTION | REPORT NO. 468.2019

INTRODUCTION
Flooding impacted large areas of Townsville from Wednesday 30th January 2019,
as a consequence of heavy rainfall across the north of Queensland. The Bureau
of Meteorology (BoM) noted that 370mm of rain fell within 24 hours at Paluma
near Townsville. Almost 3300 properties were damaged, thousands were asked
to evacuate and there were widespread blackouts . The flooding came in
waves, with the initial rainfall causing around 30 cm of flooding in the worst
affected areas. This subsided somewhat before more rain fell in the catchment,
necessitating the release of water from the Ross River Dam, which led to flood
depths of up to 1.6 m over floor height.
These were the highest rainfall volumes on record for this area, with most rain
gauges suggesting the rainfall volume was on the order of at least a 1:200 year
event. In some areas, like Mt Margaret, it was much greater than this. This rain
event was produced by the southern arm of a low pressure trough that was
centred over the Gulf of Carpentaria, drawing rain in from the Coral Sea. The low
pressure system was part of the monsoonal trough which occurs around this time
of year. This same causal event was also responsible for the generation of
Cyclone Oma, which has concerned people tuning in to the regular Bureau of
Meteorology updates.
While it is not possible to say whether climate change played a role in the intensity
of this event, the event occurred after the final breakdown of the blocking high
pressure system in the Tasman Sea which was the cause of the sustained
heatwave conditions over much of Southeast Australia in January and delayed
the onset of the monsoon. There is some theoretical base to suggest the
stationarity of synoptic weather systems may increase with a weakening of the
summertime circulation associated with anthropogenic warming, although there
is little coherent evidence for this at present.
Risk Frontiers and Insurance Council of Australia staff visited Townsville on 11 th and
12th February, supported by a grant from the Bushfire and Natural Hazards CRC.
The aim was to undertake unstructured interviews with residents and business
operators to gain preliminary insights into impacts and responses to warnings and
to examine initial recovery. In total, more than 20 residents and six business
operators were spoken to. This briefing note highlights key preliminary themes that
arose from this research.

                                                                4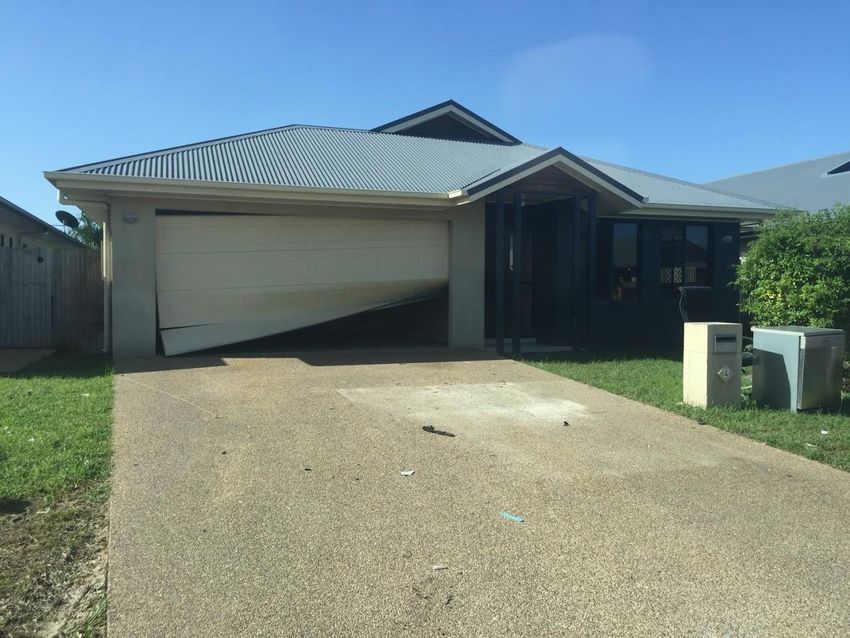
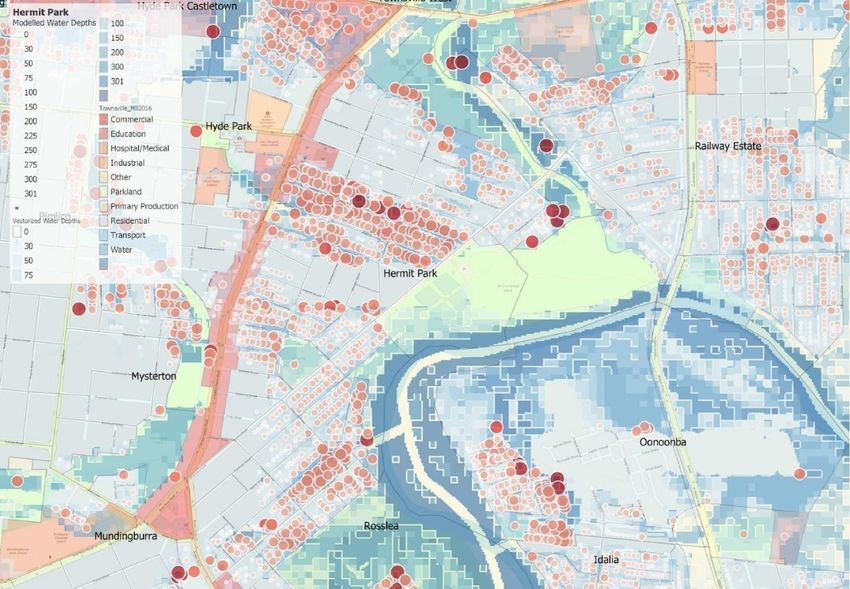
TOWNSVILLE FLOOD 2019 - POST EVENT DATA COLLECTION | REPORT NO. 468.2019

REASEARCH PREPARTION
Before arriving in Townsville, Risk Frontiers acquired the Townsville city maps which
indicated the likely flooding from a 2000 m3/s release from the Ross River dam
and georeferenced that image onto the city. This was done by using the
coordinates published on the frame of the map (the graticule) and linking that
to points of reference on the ground. [See figure 1?]
Image classification was then used to extract the colours from the map which
corresponded to the different depths of potential inundation and a GIS layer
corresponding to those depths was created. Depths were then determined for
every G-NAF (Geocoded National Address File) point which fell within the
inundation layer and were mapped accordingly. OpenStreetMap data was also
incorporated for a reference to the streets and other points of interest in the city,
and the landuse data from ABS meshblocks (the smallest statistical area
containing around 20 households) was used to quickly separate residential from
commercial and industrial building types.
The purpose of this map was to identify the most affected areas to prioritise the
investigation and to assist in validating the modelled depths (which seemed to
be very accurate, with minor exceptions usually being lower elevations in
parkland or likely due to very minor shifts (e.g.
TOWNSVILLE FLOOD 2019 - POST EVENT DATA COLLECTION | REPORT NO. 468.2019
IMPACTS
Residential flood damages in the main appear to have been restricted to the
ground story areas of raised dwellings, with peak flood heights reaching roughly
halfway through these first floor or understorey living areas. In many cases it would
appear that these spaces were occupied at the time of the flood and, in some
instances, rented to others. The majority were certainly used for extensive
storage. There was a smaller number, approximately one quarter of lower-set,
slab on ground dwellings in which flooding impacted main living areas.
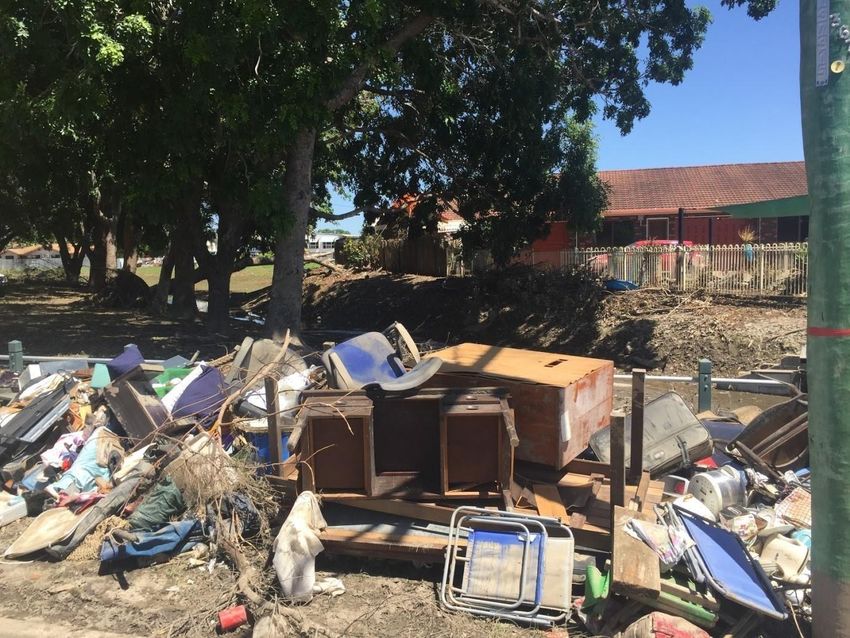
Almost every home and business on the floodplain had a large muddy pile of
possessions stacked by the roadside awaiting council pick-up [figure 2].
Common residential items damaged were carpets; household appliances such
as fridges, washing machines, dryers; cupboards and drawers; fabric lounge
chairs, chairs and tables; hardware; bedding; doors and outdoor furniture. Some
residents mentioned stacking goods on tables or on shelves within the ground
storey to attempt to put goods above the floodwaters or to relocate smaller,
valuable items to the upper storey (where possible). At least one resident
employed the creative solution of placing valuable items on inflatable platforms.
As many living spaces were spared damage on upper floors, the majority of
people appeared to have remained living in their homes. Those whose dwelling
was not habitable reported staying with friends.
Commercial damages largely varied with the type of business. We observed a
number of businesses that had suffered significant losses. For example, the
Townsville RSL suffered a total loss downstairs due to the floodwaters and was also
in the process of stripping the upstairs due to mould that developed following the
flooding. The RSL noted that they were receiving support from other clubs (e.g.,
supplying the RSL with their surplus equipment) and expected to have the upstairs
of their business operating again within four weeks. However, they faced longer
lead times for suppliers to fully refit the downstairs and were estimating business
interruption of some six months.
Some businesses reported that they could not move large pieces of equipment
to protect them in time. Most reported that they were insured and some said that
they had sufficient warning time to relocate equipment, including stock and
computers, with only minor damage suffered. An electrical / solar installation
business had lost around $10k worth of stock after up to 1.5m of water affected
their business. The manager said he had redeployed half of his workforce to make
safe existing solar installations where the equipment (inverters or isolators) may
have been damaged by brackish water while the other half of his workforce
completed new installations. He estimated that, with 400 installations to inspect
and make safe, it would be many weeks before his workforce would be back to
business as usual.
Most flood-affected businesses had closed for a week to enable clean-up and
restoration to occur, with some reporting slightly longer shutdowns as they had
made preparations in the Thursday and Friday before flooding. They operated
without electricity in general for four or more days (Monday 4 February to
Thursday 8 February) but continued to clean up. The majority had restarted
trading if they had power reconnected and had not suffered significant losses
6TOWNSVILLE FLOOD 2019 - POST EVENT DATA COLLECTION | REPORT NO. 468.2019
(e.g., the local Ford dealer, automotive workshops and electrical wholesalers
were operational) but a number of restaurants and cafes were shut along
Charters Towers Road in south Townsville, presumably due to a lack of electricity
and spoiled food due to a lack of refrigeration and perhaps mould in their
kitchens. Outside of the flood-affected areas a café operator reported that they
had lost their food supplies and were still working to get back to being fully
stocked.
Figure 2: Roller doors in Eastern Idalia potentially damaged by an electrical short.
High flow flood waters were ruled out as a cause based on lack of debris and
vegetation.
While significant flood velocities were not reported in Idalia, some structural
damage was observed to a few roller doors which were electrically operated. It
was surmised that there may have been an electrical short causing the motor to
attempt to open the door while it was locked in place, twisting and bending the
door upwards within its frame. Figure 2 shows an example of this. There was also
one occurrence of a tree having fallen on a building, seen in figure 3.
7TOWNSVILLE FLOOD 2019 - POST EVENT DATA COLLECTION | REPORT NO. 468.2019
Figure 3: Debris and furniture in the foreground. In the background, a tree has fallen
on the roof of what appears to be a childcare centre.
Figure 4 – Showing damage to a commercial property’s roller doors in Hyde Park.
8TOWNSVILLE FLOOD 2019 - POST EVENT DATA COLLECTION | REPORT NO. 468.2019
Across the wider Townsville community, many schools had been closed as
flooding was occurring and have now reopened, but a number of
earlychildhood centres remain closed. Several parks with play equipment have
also been closed.
Recent commercial developments were also subject to flooding. These buildings
have floor levels set above the one in one hundred year flood level, but that
wasn’t sufficient to prevent significant water depths flowing through them. This
included a large number of shops in Fairfield where BP, Bunnings, the Fairfield
Central Shopping Centre (Woolworths, Kmart and a number of smaller
businesses) and Fairfield Homemaker Centre (Petbarn, Pillowtalk, Godfreys etc.),
were all still closed a week after floodwaters had subsided.
9TOWNSVILLE FLOOD 2019 - POST EVENT DATA COLLECTION | REPORT NO. 468.2019
COMMUNITY RESPONSE TO WARNINGS
The Bureau of Meteorology, Townsville Council and the QLD Fire and Emergency
Services (QFES) provided warnings and information to the community throughout
the event via websites, traditional media, door-knocking and social media. The
local Council also utilised text messages and other social and traditional media
to convey information during the flooding and the dam release.
Many in the community appeared to be caught off-guard by the scale and
speed at which the flood occurred. Others believed that residents simply did not
believe that the magnitude of the flood would eventuate. They discussed how
their decision-making was influenced by a number of past flood events and
many spoke of their memories of previous events and then the realisation that
this was going to be a larger event when their local landmarks of previous flood
extents were submerged.
Overall, people described flood warnings as ‘okay’. Some implied they had
found the warnings and particularly the maps difficult to understand and, as a
result, misinterpreted the potential level of floodwaters at their house. Others,
however, noted that, while text message warnings were vague, it had prompted
them to seek further information from the range of sources available and to “take
responsibility” for what might happen to them. Suggestions for improvement
included providing warnings more regularly and, in regard to the dam release
warning, earlier. The suggestion that “if council knew there was a hard limit and
the gates would open automatically that should have been conveyed” was
repeated a number of times. There was limited criticism of the dam operators,
with the majority feeling that “they had done a good job” under difficult
circumstances and had the water not been released “it would have been a lot
worse”. A dissenting opinion was that, if the dam is to be used for flood control, it
should be largely empty before the wet season to maximise the ability of the dam
to retain flood waters.
There was significant local flood experience among the worst affected areas in
Hermit Park and Rosslea, with many locals stating they had lived in the area for a
long time (some with family experience back to the 1940s) and they were well
aware of the nature of flooding in the area. They hypothesised that some
development had made the flooding worse (infilling of an old rubbish dump with
a retaining wall that acted as a dam or levee at Bicentennial Park, for example);
recollections of watching floodwaters overtop what is now Idalia while remaining
dry in Rosslea were also common. The refrain “how could they have allowed that
development” was heard from a number of long term-residents.
10TOWNSVILLE FLOOD 2019 - POST EVENT DATA COLLECTION | REPORT NO. 468.2019
INITIAL RECOVERY
Both formal and informal mechanisms were observed to have assisted recovery
efforts. Emergency services, defence personnel and council staff were assisting
with the clean-up. Others brought assistance for those affected on an informal
level, and family and friends assisted in the clean-up. In general, the mood
among those we spoke to was upbeat, with the majority having insurance and
stating “it could have been worse” or “I’m lucky, others have it worse than me” –
often while standing beside a pile of ruined belongings on their lawn. The
generosity of the flood victims was also apparent, with most people offering us
water, food, a spare hat etc. despite having had a difficult time already and with
likely more hard work ahead of them.
11TOWNSVILLE FLOOD 2019 - POST EVENT DATA COLLECTION | REPORT NO. 468.2019
DISCUSSION AND CONCLUSION
The resilience of the community was reassuring and inspiring. Though Townsville
had just experienced a significant and very damaging event, we were left with
a sense that the community was functioning, and that there was resilience
amongst community members, who seemed to be getting on with the job of
cleaning up despite significant uncertainty over the coming weeks through the
recovery.
Despite commentary about the size of this flood being unprecedented, bigger
floods are definitely possible in Townsville (even denoting this event as a 1 in 500
year event it is far below the potential extent and depths likely to be experienced
by a Probable Maximum Flood (1 in 10,000 year event)) and there is much to be
learnt from this event. The physical and social impacts would have been far
greater had the floods been only a little higher as they would have inundated
living spaces of two-storey homes, making them entirely uninhabitable and
doubling (or worse) losses for families and debris to be collected and
dramatically increasing the displaced population.
There are significant opportunities to better understand community risk
perceptions, responses to warnings, sheltering behaviours and flood damages,
as well as gaining evidence of the effectiveness of flood mitigation and flood
warning systems. Several policy and communication issues are already
apparent, including:
• what should be done to reduce flood damages in enclosed ground
floor areas of raised dwellings? At the least these areas should not be
rented as habitable space to others
• while the Townsville community is fortunate to have the resources
of the Australian Defence Force nearby, a larger flood would have
necessitated many more rescues which might have overwhelmed their
capability. In any case, without local defence resources, a much wider
emergency response would have been required
• as raised in our previous briefing note on land-use planning in flood
prone areas, it is essential to adopt a risk-based approach to floodplain
management and to ensure that the disclosure of risk considers all event
magnitudes.
12TOWNSVILLE FLOOD 2019 - POST EVENT DATA COLLECTION | REPORT NO. 468.2019
REFERENCES
1 Catchpole T, De Mestre N. Physical models for a spreading line Fire. Aust For 1986;49(2):102–11.
2 Weber RO. Modelling Fire spread through fuel beds. Prog Energy Combust Sci 1991;17:62–82.
3 Perry GLW. Current approaches to modelling the spread of wildland Fire: a review. Prog Phys Geogr 1998;22(2):
222–45.
4 Fons WL. Analysis of Fire spread in light forest fuels. J Agric Res 1946;72(3):93–121.
5 Emmons HW. Fire in the forest. Fire Res Abs Rev 1964;5: 163–78.
6 Hottel HC, Williams GC, Steward FR. Modelling of Firespread through a fuel bed. Tenth Symposium
(International) on Combustion, Pittsburgh: The Combustion Institute; 1965. p. 997–1007.
7 McArthur AG. Weather and grassland Fire behaviour. Forest Research Institute, Forest and Timber Bureau of
Australia; 1966. Leaflet No. 100.
8 Van Wagner CE. Calculations on forest Fire spread by flame radiation. Canadian Department of Forestry; 1967.
Report No. 1185.
9 Thomas PH. Some aspects of the growth and spread of Fires in the open. Forestry 1967;40:139–64.
10 McArthur AG. Fire behaviour in eucaliptus forests. Forest Research Institute, Forest and Timber Bureau of
Australia; 1967. Leaflet No. 107.
11 Anderson HE. Heat transfer and Fire spread. USDA Forest Service; 1969. Res Pap INT-69.
12 Frandsen WH. Fire spread through porous fuels from the conservation of energy. Combust Flame 1971;16:9– 16.
13 Rothermel RC. A mathematical model for predicting Fire spread in wildland fuels. USDA Forest Service; 1972.
Res Pap INT-115.
14 Pagni J, Peterson G. Flame spread through porous fuels. Fourteenth Symposium (International) on Combustion,
USDA Forest Service, Washington, DC, Pittsburgh: The Combustion Institute; 1973. p. 1099–107.
15 Telisin HP. Flame radiation as a mechanism of Fire spread in forests. Heat transfer in flames. New York: Wiley;
1974. p. 441–9.
16 Steward FR. Fire spread through a fuel bed. Heat transfer in Fires: thermophysics, social aspects, economic
impact. Blackshear, PL; 1974.
17 Konev EV, Sukhinin AI. The analysis of flame spread through forest fuel. Combust Flame 1977;28:217–23.
18 Cekirge HM. Propagation of Fire fronts in forest. Comput Math Appl 1978;4:325–32.
19 Fujii N, Hasegawa J, Phallop L, Sakawa Y. A nonstationary model of Firespreading. Appl Math Model 1980;41:
76–180.
20 Grishin AM, Gruzin AD, Zverev VG. Mathematical modelling of the spreading of high-level forest Fires. Sov Phys
Dokl 1983;28:328–30.
13You can also read