The biosorption capacity of Saccharomyces cerevisiae for Cadmium in Milk
←
→
Page content transcription
If your browser does not render page correctly, please read the page content below
Preprints (www.preprints.org) | NOT PEER-REVIEWED | Posted: 12 July 2020                     doi:10.20944/preprints202007.0264.v1

              Article
              The biosorption capacity of Saccharomyces cerevisiae
              for Cadmium in Milk
                        Ramona Massoud 1, Kianoush Khosravi-Darani 2, *, Anoosheh Sharifan 3,

                                      GholamHassan Asadi 3 and Habibollah Younesi 4
                1 Department of Food Science and Technology, Standard Organization, Tehran, Iran.
                2 Research Department of Food Technology, National Nutrition and Food Technology Research Institute,
                Faculty of Nutrition Sciences and Food Technology, Shahid Beheshti University of Medical Sciences, P.O. Box:
                19395-4741, Tehran, Iran.
                3 Department of Food Science and Technology, Science and Research branch, Islamic Azad University, Tehran,

                Iran.
                4 Department of Environment Science, Faculty of Natural resources and Marine Sciences, Tarbiat Modares

                University, Mazandaran, Noor, Iran
                * Correspondence: kiankh@yahoo.com & k.khosravi@sbmu.ac.ir; Tel.: +98-21-22086348

                Abstract: This study aimed to evaluate the capacity of Saccharomyces cerevisiae for Cadmium
                absorption in Milk. Nowadays one of the most serious problems of the industrialized world is heavy
                metals pollution. Applying microorgaisms as a novel biotechnology is so useful especially in
                foodstuffs. Among the biosorbents used for heavy metals’ removal, Saccharomyces cerevisiae has got
                an increasing attention due to its popularity in food industry. In this regard, the effects of some
                important factors such as the initial metal concentration, biomass concentration and contact time on
                the biosorption capacity of Saccharomyces cerevisiae were studied. The biosorption was analyzed by
                the inductively coupled plasma mass spectrometer (ICP-MS). The maximum Cd removal (70%) was
                at 80 μg/L of Cd concentration in milk samples containing 30×108 CFU Saccharomyces cerevisiae at the
                end of storage time (the 4th day). There were no significant differences in sensory and
                physicochemical properties of milk samples during storage (p < 0.05). The isotherm studies followed
                by two popular models; Langmuir and Freundlich and the results showed a better fit to the
                Langmuir isotherm. Altogether, the results of this study demonstrated that the approach of using
                this valuable yeast, could be applied for foods’ detoxification and producing healthier foodstuffs.

                Keywords: Saccharomyces cerevisiae; biosorption; milk; ICP-MS; isotherm; sensory evaluation

              1. Introduction
                   Toxic metal contamination is a serious environmental problem all around the world due to the
              fast development of industries such as fuel, pesticides and mining. Their wastes discharge metals
              into the environment directly or indirectly [1, 2]. These toxic metals can enter to the food chain and
              then into our bodies [3]. Cadmium (Cd) is one of the high toxic metals in this regard [4]. Milk is a
              valuable food source for humans and animals. It has nearly all essential nutrients for growth [5].
              According to World Health Organization (WHO), the maximal allowed concentration values for Cd
              in milk is less than 10 µg/L [6].
                   Some reports have shown Cd contamination of milk around the world and unfortunately in
              some places it is more than the permissible level: Turkey [7], China [8], Iraq [9] and Iran [10, 11].
                   Common techniques for heavy metals removal from aqueous solution like ion exchange,
              chemical precipitation, membrane technologies, electrochemical treatment and using activated
              carbon which are expensive and also not effective for using in foodstuffs [12, 13].

            © 2020 by the author(s). Distributed under a Creative Commons CC BY license.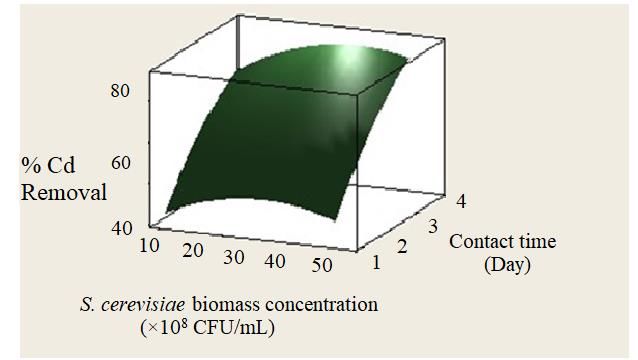
Preprints (www.preprints.org) | NOT PEER-REVIEWED | Posted: 12 July 2020                  doi:10.20944/preprints202007.0264.v1

                    Biosorption as a green technology, is the process of metal binding from aqueous solution to the
              surface of microorganism. The mechanism occurred through the absorption of metal ions to
              functional groups which is on the cell wall of the biomass [12]. It is a cheap, eco-friendly and fast
              technique [14]. Biosorpton is process that the heavy metals trap into the cell wall’s active site [12].
              The heavy metal’s removal takes place through various mechanisms. The functional groups of the
              cell wall of S .cerevisiae such as hydroxyl and carboxyl, are responsible for the biosorption technique.
              They are the main agents for metals to be attached during the mechanism. Moreover, the heavy
              metals intracellular accumulation occurs in the cell wall and metals are able to attach to the cell
              molecules [14-16].
                    In bosorption method various microorganisms like yeasts, bacteria, algae and fungi are applied.
              They possess some advantages such as being cheap and practical for foodstuffs [15, 16].
                    The unique yeast “Saccharomyces cerevisiae” is commonly used in bakery and brewery industries.
              It is an economic available biosorbent [17]. There are some studies about using this yeast for heavy
              metals biosorption [18- 22].
                    Our study aims to evaluate the capacity of S. cerevisiae for Cd absorption in Milk. So, the effects
              of three main factors; initial metal concentration, biomass concentration and contact time on the
              biosorption capacity of S. cerevisiae were studied. These factors were chosen through the previous
              studies of heavy metals bioremoval [20-23] and also based on the results of our research team. This
              technique would be useful in case of emergency in food and beverage industry.

              2. Materials and Methods

              2.1. Preparation of the biomass
                    The S. cerevisiae (PTCC-5020) was purchased from the Science Research and Technology
              Department, Tehran, Iran. Glucose, yeast extract, (NH4)2SO, K2HPO4, MgSO4 and KH2PO4 were
              combined as the yeast culture medium and then autoclaved at 121°C for 20 min. The medium was
              inoculated with S. cerevisiae after cooling followed by 20 h shaking at 70 rpm and then incubated at
              30°C. The biomass colonies were counted and the mean of 30×108 CFU/mL was obtained through the
              dilution method; the seed culture (1 mL) was diluted in a ratio of 1:10 with NaCl with serial dilutions
              (10 times). Then the dilution (1 mL) was added to the nutrient agar medium by pour plate method
              and incubated for 72 h at 30°C for 72 h [24].

              2.2. Chemicals
                   All chemicals were provided from Merck company (Germany) and Cd standard solution from
              Accu Trace company (USA). All the containers were acid-washed by HNO3 (15% v/v) overnight and
              then then rinsed with distilled water.

              2.3. Sample Preparation
                   Each sample was prepared of milk (50 mL) with levels of S. cerevisiae (10×108 to 50×108 CFU/mL)
              and different initial Cd concentration (40, 50, 60, 70, 80 μg/L) and stored in fridge for 4 days. Then the
              effect of 3 variables; initial metal concentration (40-80 μg/L), biomass concentration (10 - 50×108 CFU/mL)
              and contact time (1-4 days), on the biosorption capacity of S. cerevisiae were studied.

              2.4. Physicochemical Analysis
                    The pH, acidity and density of milk samples were determined according to AOAC methods [24].
              The pH value of milk samples was evaluated with a pH meter (Metrom, Switzerland) at room
              temperature. The titratable acidity was determined by titration method; milk sample (10 ml) was
              titrated by NaOH solution (0.1 N) and adding phenolphthalein as an indicator. The Lactodensimeter
              (Alla, France) was used to measure the density of milk samples [24].
Preprints (www.preprints.org) | NOT PEER-REVIEWED | Posted: 12 July 2020 doi:10.20944/preprints202007.0264.v1
2.5. Sensory Analysis
The sensory analysis was evaluated during storage time (1st to 4th day) by 10 trained panelists
[25]. Milk samples were analyzed for consistency, color, odor and overall acceptability. The samples
were scored in a 9-point hedonic scale. The scores were from 1(extremely dislike) to 9 (extremely
like). Mean values (± SD) were calculated from the panelists scores of each sample.
2.6. Central Composite Design (CCD)
The 3 variables; initial Cd concentration, S. cerevisiae biomass and contact time, having
significant effects on Cd removal. In this study, CCD was used to find the optimal conditions of Cd
biosorption with the experimental factors levels as shown in the Table 1.
Table 1. Levels of the main variables for the central composite design.
Main Variable Range and level
− α (−1.6) −1 0 +1 +α (+1.6)
S. cerevisiae biomass dosage
10 20 30 40 50
(× 108 CFU)
Initial Cd concentration )μg/L) 40 50 60 70 80
Contact time (day) 0 1 2 3 4
2.7. ICP-MS Analysis
The inductively coupled plasma mass spectrometer (ICP- MS, England) applied in this study,
with a standard torch, a cross flow nebulizer and a quartz spray chamber. It was tuned before each
experiment started. All the samples were put in microwave 1200W (Milestone Micro oven) to be
digested with segmented rotor MPR-600 [26].
2.8. Removal Evaluation
The milk sample containing S. cerevisiae and Cd were digested in the microwave and then
centrifuged (at 2000×g) for 15 min. The supernatant was injected to the ICP- MS for Cd residual
determination. measured by using the ICP-MS. All the trials were repeated triple.
The Cd removal efficiency (%) was calculated by Eq. (1) [27]:
%Removal = 100(Co-Cf) / Co (1)
where Co (μg/L): is the initial Cd concentration in solution; Cf (μg/L): is the final Cd concentration in
solution.
2.9. Absorption Isotherm
The biosorption isotherm were evaluated by adding the biosorbent (S. cerevisiae) to the milk
samples with initial Cd concentrations (20 - 100 μg/L). After biosorption, the remained Cd was
determined by ICP-MS. The biosorption experiments were repeated three times.
2.10. Statistical Analysis
The statistical analysis was done by MINITAB statistical software (version 14). The statistics data
was provided by analysis of variance (ANOVA). The data are presented as the mean value ± SD
during storage days. The P-values below 0.05 were statistically significant.
3. Results
3.1. The effect of initial metal concentrationPreprints (www.preprints.org) | NOT PEER-REVIEWED | Posted: 12 July 2020 doi:10.20944/preprints202007.0264.v1
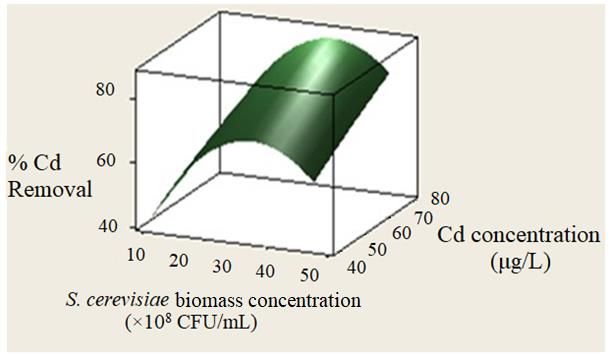
The effect of initial Cd concentration (40, 50, 60, 70, 80 μg/L) on the bioremoval efficiency was
investigated (Figure 1a). The results showed that by increasing the Cd concentrations, the absorption
improved. The highest Cd removal (70%) was observed at the initial metal concentration of 80 μg/L.
3.2. The effect of contact time
In this study, the Cd biosorption was evaluated during the contact times from 1 to 4 days. Figure
1(b) shows that Cd removal by S. cerevisiae increased as the time passed. As it shows the maximum
removal of Cd was occurred in the 4th day. By increasing time up to 8 days, the yeast count was
enhanced as the removal was nearly constant. Table 2 shows the yeast count and the bioremoval
levels during 8 days of storage.
Table 2. The bioremoval level of Cd in milk samples during storage.
Storage Time (day)
1 4 8
S. cerevisiae biomass (CFU/mL) 108 108 109
Total count (CFU/mL) 1012 1012 1015
Cd bioremoval (%) 45.51a 70.10b 70.21b
Different letters are significantly different (p < 0.05).
3.3. The effect of biomass concentration
As shown in Figures 1 (a and b), by increasing S. cerevisiae biomass concentration from 10 up to
50×108 CFU/mL, the removal efficiency enhanced. The optimum level of S. cerevisiae biomass
concentration was 30×108 CFU with the highest removal amount of 70%.
(a) (b)
Figure 1. The effect of initial Cd concentration on bioremoval (a), the effect of biomass concentration initial
on bioremoval (b).
3.4. Physicochemical evaluation
There was a slight reduction in pH values and a rise in titratable acidity of the milk samples.
Also the density level was nearly constant. However, the differences were not significant in the milk
samples (p>0.05) (Table 2).
3.5. Sensory evaluation
Table 3 also represents the results of sensory analysis during the storage of milk samples. There
were no significant differences in consistency, smell and color of these milk samples during timePreprints (www.preprints.org) | NOT PEER-REVIEWED | Posted: 12 July 2020 doi:10.20944/preprints202007.0264.v1
intervals with control samples (p < 0.05). Also the overall acceptance of milk samples had no
significant difference through storage period (p < 0.05).
Table 3. Physicochemical and sensory properties of milk samples during storage.
S. cerevisiae biomass concentration (CFU/mL)
Control 10 ×108 50 ×108
Storage time (day) 1 4 1 4 1 4
Physicochemical properties
pH 6.70±0.01a 6.67±0.05a 6.78±0.01a 6.67±0.07a 6.80±0.07a 6.71±0.07a
Acidity (% lactic acid) 0.14±0.01a 0.15±0.05a 0.14±0.07a 0.15±0.07a 0.14±0.07a 0.16±0.07a
Density (g/cm3) 1.01±0.01a 1.01±0.05a 1.02±0.01a 1.03±0.05a 1.02±0.07a 1.02±0.05a
Sensory property
a
Color 7.99±0.07 7.97±0.05a 7.97±0.07a 7.89±0.07a 7.90±0.05a 7.85±0.05a
Smell 7.99±0.05a 7.96±0.05a 7.95±0.05a 7.66±0.05a 7.95±0.07a 7.52±0.05a
Consistency 7.98±0.05a 7.98±0.07a 7.97±0.05a 7.94±0.07a 7.90±0.05a 7.88±0.05a
Overall acceptance 7.98±0.07a 7.95±0.05a 7.98±0.07a 7.95±0.05a 7.98±0.07a 7.90±0.07a
Different letters are significantly different (p < 0.05).
3.6. Isotherm studies
The capacity of S. cerevisiae biomass concentration (108 CFU/mL) for Cd biosorption was
determined at Cd initial concentrations (20, 40, 60, 80 and 100 μg/L) via two popular biosorption
isotherms; Langmuir and Freundlich models. The regression coefficient (R2) represent the better
isotherm model for Cd biosorption by S. cerevisiae.
The Langmuir equation is as the Eq. (2) [28]:
Ce/Qe = 1/(K * Qmax) + Ce/Qmax Eq. (2)
Where Qe (µg/L) is the Cd amount in absorbing process, Ce (µg/L) is the Cd equilibrium
concentration in milk, Qmax (µg/L) is the maximum Cd absorption level. KL (L/µg) is the Langmuir
constant. The Freundlich equation is as the following the Eq. (3) [29]:
LnQe = LnKf + 1/n LnCe Eq. (3)
Where n and Kf are the Freundlich constants. The Langmuir and Freundlich parameters are shown
in Table 4.
Table 4. Langmuir and Freundlich isotherm parameters for Cd removal.
Langmuir model† Freundlich model§
Cd initial concentration (µg/L)
Ce Qe Ce/Qe Ln Qe Ln Ce
20 13.4 6.6 2.033 1.887 2.595
40 23.2 16.8 1.381 2.821 3.144
60 27 33 0.818 3.256 3.269
80 28 51 0.522 3.889 3.263
100 28 70 0.389 4.254 3.321
†R² for Langmuir model was obtained 0.9186
§ R² for Freundlich model was obtained 0.8587
As Table 3 shows, both correlation coefficients were high in Langmuir and Freundlich isotherm
models. By the comparison of calculated R2 values, it was revealed that the Langmuir isotherm model
showed better fit than Freundlich model.Preprints (www.preprints.org) | NOT PEER-REVIEWED | Posted: 12 July 2020 doi:10.20944/preprints202007.0264.v1
4. Discussion
As shown in figure 1 (a and b) by rising the biomass concentration up to 30 × 108 CFU, the
absorption rate increased. The yeast of S. cerevisiae has a high biosorption affinity for heavy metals
[30, 31]. This trend is due to the carboxyl, hydroxyl and amino groups of the cell wall as the main
responsible for the heavy metals’ absorption [32-34]. As the amount of metal ions increased, their
absorption to the surface of the S. cerevisiae increases so, the higher biosorption would be observed
[21, 35 and 36]. By enhancing the S. cerevisiae biomass concentrations, the biosorption increases that
is because of the more available binding sites for metal ions and therefore more binding combinations
[37].
Also by increasing Cd concentration from 40 to 100 μg/L, the biosorption yield increased (Figure
1a). Similar to our studys’ results; Hadiani et al. [21] reported that Cd removal by S. cerevisiae
increased with rising the Cd level (25 to 80 μg/L). Ghorbani et al. [38] observed the Cd bioremoval by
S. cerevisiae (2.13 g/L) at the concentration of 26.46 mg/L. Also Peng et al. [39] showed that Cu
absorption by S. cerevisiae increased by increasing the metal from 40 to 120 mg/L. As shown in Figure
1(b), Cd absorption enhanced by rising contact time from 1- 4 day. With time passing, more Cd ions
would attach to S. cerevisiae receptor sites in the surface [40]. The findings of this study is in
accordance with Hadiani et al. [21] observed the increasing Mercury biosorption by S. cerevisiae from
24- 48 h and Hatami Fard and Mehrnia [35] reported more mercury absorption during 4 days. Like
the above studies, in this study, the highest Cd removal efficiency (70%) was observed at the Cd
concentration of 80 μg/L and the biomass of 30 × 108 CFU in the 4th day of storage. Prolongation of
the experiment is recommended to evaluate more removal of heavy metal in longer exposure. Also,
it should be taken into account that in the case of spoilage of milk with bacterial cells, or high initial
microbial loading of milk the rate of bio-decontamination could be quite different with this report.
Also Table 3 shows that the absorption increased by increasing the initial concentration of Cd,
as more initial concentration prepared more contact sites for absorbent and Cd [35]. Comparing both
R2 values in Langmuir and Freundlich isotherm models, it shows that Langmuir model has a better
fit, which confirms that Langmuir equation is correct for monolayer absorption on surface with
similar sites. The higher R2 in Langmuir model confirm the Cd absorption by S. cerevisiae in our study
obey this model.
5. Conclusions
In this study, three important variables; Cd and biomass concentration and the contact time for
Cd bioremoval by S. cerevisiae were evaluated. Our findings showed the highest level of Cd
biosorption (70%) observed in the S. cerevisiae concentration of 30 × 108 CFU and Cd amount of 80
μg/L in the 4th day. The ability of S. cerevisiae had been studied in high levels (ppm) of Cd and other
heavy metals in effluents not in foodstuffs. This study shows the ability of this valuable yeast for Cd
remediation in very low concentrations (ppb) from milk with no changes in physiochemical and
sensorial acceptability. S. cerevisiae is a desirable and eco-friendly biosorbent for toxic metals
bioremediation from food and water resources. These findings open the window for evaluating the
capacity of heavy metals’ binding by S. cerevisiae in milk. There is a need for more studies in this
field to reduce the toxic effects of the heavy metals in food and drinks.
Author Contributions: Conceptualization, R.M., K.K.D.; Software, A.Z.; Formal Analysis, R.M. and A.Z.;
Writing-Original Draft Preparation, R.M.; Writing-Review & Editing, K.K.D., A.S. and G.H.A.; Supervision,
K.K.D. and A.S.; All authors have read and agreed to the published version of the manuscript.
Funding: This research received financial support of Shahid Beheshti University of Medical Sciences for grant
Number 22408.
Acknowledgments: We are grateful to the National Nutrition and Food Technology Research Institute (NNFTRI)
of Iran for supporting this study. Also we like to thank Dr. Younesi for his kind assistance.
Conflicts of Interest: The authors declare no conflict of interest.
ReferencesPreprints (www.preprints.org) | NOT PEER-REVIEWED | Posted: 12 July 2020 doi:10.20944/preprints202007.0264.v1
1. Weldeslassi, T.; Balwant, H.; Oves, M. Chemical Contaminants in Soil. Air and Aquatic
Ecosystem. Mod. Age Environ. Prob. Rem. 2017, 25, 1-22.
2. Doležalová Weissmannová, H.D.; Mihoˇcová, S.; Chovanec, P.; Pavlovský, J. Potential
Ecological Risk and Human Health Risk Assessment of Heavy Metal Pollution in
Industrial Affected Soils by Coal Mining and Metallurgy in Ostrava. Czech Republic Int.
J. Environ. Res. 2019, 16, 4495; doi:10.3390/ijerph16224495
3. Kanwal, R.; Fiz, F.; Iqra, W.; Muhammad, S.; Hamid, A. Prevalence of exposure of heavy
metals and their impact on health consequences. J. Cell. Biochem. 2019, 119,157-184.
4. Ostroumov, S.A.; Tropin, I.V.; Kiryushin, A.V. Removal of Cadmium and Other Toxic
Metals from Water: Thermophiles and New Biotechnologies. Rus J. Gen. Chem. 2018, 88,
2962–2966. DOI: 10.1134/S1070363218130224.
5. Burim, N.; Ametaj. Introducing Dairy: A Transdisciplinary Journal to Advance
Understanding of Dairy Nutrition, Health and Productivity, Welfare and Well-Being as
Well as Milk Synthesis-Composition and Health Effects of Its Products. Dairy 2018, 1, 1–
5; doi:10.3390/dairy1010001
6. WHO (World Health Organization), International Standards for Drinking Water, 5th
ed., 2010, Geneva.
7. Ayar, A.; Sert, D.; Akın, N. The trace metal levels in milk and dairy products consumed
in middle Anatolia-Turkey. Environ. Monitor. Assess. 2015,152(1),1-12.
8. Qin, L.; Wang, X.; Li, W.; Tong, X.; Tong, W. The minerals and heavy metals in cow's
milk in China Japan J. Health Sci. 2009, 55(2), 300-305.
9. Alani, M.S.; Al-Azzawi, M.N. Assessment of Lead Cadmium and Copper concentrations
in Raw Milk Collected from different location in Iraq. Iraq J Sci 2016, 56(1), 350-355.
10. Nejatolahi, M.; Mehrjo, F.; Sheykhi, A.; Bineshpor, M. Lead Concentrations in Raw
Cows' Milk from Fars Province of Iran. Americ J Food Nut 2014, 2(5), 92-94.
11. Najarnezhad, V.; Akbarabadi, M. Heavy metals in raw cow and ewe milk from north-
east Iran. Food Add. Contamin. 2013, 12, 2-6.
12. Katarzyna, C.; Marcin M. Green analytical methods of metals determination in
biosorption studies. Trends Anal. Chem. 2019, 116, 254-265.
13. Jianlong, W.; Can C. Biosorption of heavy metals by Saccharomyces cerevisiae: A review.
Biotechnol. Adv. 2006, 24, 427 – 451.
14. Gupta, V.K.; Nayak. A.; Agarwal, S. Bioadsorbents for remediation of heavy metals:
current status and their future prospects. Environ. Eng. Res. 2015, 20, 001-018.
https://doi.org/ 10. 4491/ eer. 2015.018.
15. Massoud, R.; Hadiani, M.R.; Khosravi Darani, K. Bioremediation of heavy metals in food
industry Application of Saccharomyces cerevisiae. Electron J. Biotechnol. 2019, 37, 56–60.
https://doi.org/ 10.1016/j.ejbt.2018.11.003
16. Wang, J.L.; Chen, C. Biosorption of heavy metals by Saccharomyces cerevisiae a review.
Biotechnol Adv. 2006, 24, 427–451. https://doi.org/10.1016/j.biotechadv.2006.03.001Preprints (www.preprints.org) | NOT PEER-REVIEWED | Posted: 12 July 2020 doi:10.20944/preprints202007.0264.v1
17. Jéssica, M.; Nascimentoa, D.; Oliveirab. Andrea, J.D.; Rizzoc, C.L.; Selma G.F. Leite.
Biosorption Cu (II) by the yeast Saccharomyces cerevisiae. Biotechnology Reports 2018,
20, 31-35.
18. Salimi, M.; Mahzounieh, M. Saccharomyces cerevisiae on Mo and Cd removal. J. Med
Microbiol Infect Dis. 2015, 3 (2), 18-22.
19. Amirnia, S.; Ray, M.B.; Margaritis, A. Heavy metals removal from aqueous solutions
using Saccharomyces cerevisiae in a novel continuous bioreactor–biosorption system.
Chem Eng J. 2015, 264, 863-872. https://doi.org/10.1016/j.cej.2014.12.016
20. Infante, C.; Arco, D.; Angulo, E. Removal of lead mercury and nickel using the yeast
Saccharomyces cerevisiae. Rev MVZ Cordoba. 2014, 19, 4141–4149.
21. Hadiani, M.R.; Khosravi-Darani, K.; Rahimifard, N.; Younesi, H. Assessment of Mercury
biosorption by Saccharomyces Cerevisiae Response surface methodology for
optimization of low Hg (II) concentrations. J. Environ Chem Eng. 2018, 6, 4980–4987.
https://doi.org/ 10.1016/ j. jece. 2018.07.034
22. Amirnia, S.; Ray, M.B.; Margaritis, A. Heavy metals removal from aqueous solutions
using Saccharomyces cerevisiae in a novel continuous bioreactor-biosorption system,
Chem. Eng. J. 2015, 264, 863–872. doi:http://dx.doi.org/ 10.1016/j.cej.2014.12.016.
23. Massoud, R.; Khosravi-Darani, K.; Sharifan, A.; Asadi, G.H. Lead Bioremoval from Milk
by Saccharomyces cerevisiae. Biocat Agri Biotechnol. 2019, 22, 11-20. https,//doi.org/ 10.
1016/ Journal bcab.2019.101437
24. AOAC, Official Methods of Analysis. Association of official analytical chemists,
Washington, DC 2005.
25. ISO 22935-2:2009 (IDF 99-2:2009). Milk and milk products - Sensory analysis - Part 2:
Recommended methods for sensory evaluation. 2009.
26. Khan, N.; Jeong, S.; Hwang, M.; Kim, J.; Choi, S.H.; Yeong, E.; Yeon Choi, J.; Park, K.S.;
Kim, K.S. Analysis of minor and trace elements in milk and yogurts by inductively
coupled plasma-mass sperometry (ICP-MS). Food Chem 2014,147, 220–224.
27. Goksungur, Y.; Uren, S.; Guvenc, U. Biosorption of cadmium and lead ions by ethanol
treated waste baker’s yeast biomass. Bioresour. Technol. 2005, 96, 103–109.
28. Langmuir, I. The adsorption of gases on plane surfaces of glass, mica and platinum. J.
Am. Chem. Soc. 1918, 40(9), 1361–1403.
29. Freundlich, H. M. F. The adsorption in solutions. Chemistry 2000, 57, 385-470.
30. Zheng, X.; Wang, X.; Shen, Y.; Lu, X.; Wang, T. Biosorption and biomineralization of
uranium (VI) by Saccharomyces cerevisiae -Crystal formation of chernikovite. Chemosphere
2017, 175, 161-169.
31. Hlihor, R.M.; Diaconu, M.; Fertu, D.; Chelaru, C.; Sandu, I.; Tavares, T. Bioremediation
of Cr (VI) polluted wastewaters by sorption on heat inactivated Saccharomyces cerevisiae
biomass. Int. J. Environ. Res 2013,7, 581–594.Preprints (www.preprints.org) | NOT PEER-REVIEWED | Posted: 12 July 2020 doi:10.20944/preprints202007.0264.v1
32. Fadel, M.; Hassanein, N.M.; Elshafei, M.; Mostafa, A.H.; Ahmed, M.; Khater, H.M.
Biosorption of manganese from groundwater by biomass of Saccharomyces cerevisiae.
HBRC J. 2017,13,106–113.
33. Gohari, M.; Hosseini, S.; Sharifnia, S.; Khatami, M. Enhancement of metal ion
adsorption capacity of Saccharomyces cerevisiae’s cells by using disruption method. J. Tai.
Ins. Chem. Eng. 2013, 44, 637–645.
34. Parvathi, K.; Nagendran, R.; Biosorption of chromium from effluent generated in
chrome electroplating unit using Saccharomyces cerevisiae. Sep. Sci. Technol. 2007, 42, 625–
638.
35. Hatami Fard, G.; Mehrnia, M.R. Investigation of mercury removal by Micro-Algae
dynamic membrane bioreactor from simulated waste water. J. Environ. Chem. Eng. 2016,
10, 25-33. http,//dx.doi.org/10.1016/j.jece.
36. Saber-Samandari, S.; Gazi, M. Removal of mercury (II) from aqueous solution
usingchitosan-graft-Polyacrylamide Semi-IPN hydrogels. Sep. Sci. Technol. 2013, 48,
1382–1390.
37. Prasanna Kumar, Y.; King, P.; Prasad, V.S. Adsorption of zinc from aqueous solution
using marine green algae -Ulva fasciata sp. Chem. Eng. J. 2007, 129, 161–166.
38. Ghorbani, F.; Younesi, H.; Ghasempouri, S.M.; Zinatizadeh, A.A.; Amini, M.; Daneshi,
A. Application of Response Surface Methodology for Optimization of Cadmium
Biosorption in an Aqueous Solution by Saccharomyces cerevisiae. Chem. Eng. J. 2008, 145,
267–275.
39. Peng, Q.; Liu, Y.; Zeng, G.; Xu, W.; Yang, C.; Zhang, J. 2010. Biosorption of Copper (II)
by Immobilizing Saccharomyces cerevisiae on the Surface of Chitosan-Coated Magnetic
Nanoparticle from Aqueous Solution. J. Hazard. Mat. 2010, 177, 676-82. 0.1016/j.j hazmat.
2009.12.084.
40. Amini, A.; Younesi, H. Biosorption of Cd (II), Ni (II) and Pb (II) from Aqueous Solution
by Dried Biomass of Aspergillus niger, Application of Response Surface Methodology
to the Optimization of Process Parameters. Clean Soil Air Water J. 2009, 37, 776-786.You can also read