The Energy Blame Game and Other False Narratives - EIP ...
←
→
Page content transcription
If your browser does not render page correctly, please read the page content below

The Energy Blame Game and Other False Narratives
Now that petroleum and natural gas are in short supply (along with every other commodity), prices have spiked
and the initial shock to our collective senses of the Russian invasion of Ukraine has been absorbed, it’s time to
start passing blame. Experience informs us that the one blaming the loudest is usually the one either shifting
blame or trying to avoid being blamed.
And that brings us to the oil industry.
They will explain to anyone listening (yes people are now listening to the oil companies because they finally have
something everyone else wants) how the Biden Administration has caused this supply dislocation with their pro-
green / anti-fossil fuels energy policies. We have heard this narrative for the last year but it’s louder now that the
Biden administration is going hat in hand to beg for more production from an industry he likes to hate.
But we prefer facts, and the facts are these:
    A decade-plus of over-investment and sub-par returns by the oil & gas Industry led to an investor revolt - the
    result being a heightened focus on capital discipline, shareholder returns, and under-investment by the
    industry over the past five years.
    Government allocation of tax incentives to fossil fuels, solar, wind, batteries, electric vehicles, etc. is a small
    fraction of the annual capex spent by the fossil fuel industry. Despite the rhetoric, these subsidies are not a
    material diversion from the fossil fuel industry.
    The Biden Administration has had a decidedly anti-fossil fuel narrative, up until recently. While its current
    policies may affect future production growth, they have not impacted the current supply/demand situation.
Oil and natural gas are global commodities--and like all commodities--their prices cycle around their replacement
cost with supply/demand imbalances causing those cycles. Everyone knows well the effects the pandemic and
subsequent recovery had on quickly suppressing and then accelerating demand. The supply side, however, is
harder to see, and it is driven by industry capital spending. Exhibit 1 shows this for the global industry back to
1985.
Exhibit 1– Global Petroleum Industry Capital Spending – 2021 Constant Dollars

Sources: Evercore ISI Research (using a compilation of Company Data, Salomon Brothers, Salomon Smith Barney, Lehman Brothers,
Barclays Capital, and Evercore ISI Research estimates), U.S. Bureau of Economic Analysis, EIA, EIP estimates.

Oil and gas capital spending is down 57% since its 2014 peak. We have also plotted global oil production to show
how high oil prices in the middle of the last decade drove an above-trend spending spree which, in turn, led to
falling oil prices and even lower returns on invested capital. Based on past trends, the industry has been under-
spending for over five years.

 EIP Insights Post March 16, 2022                                                                                www.eipinvestments.com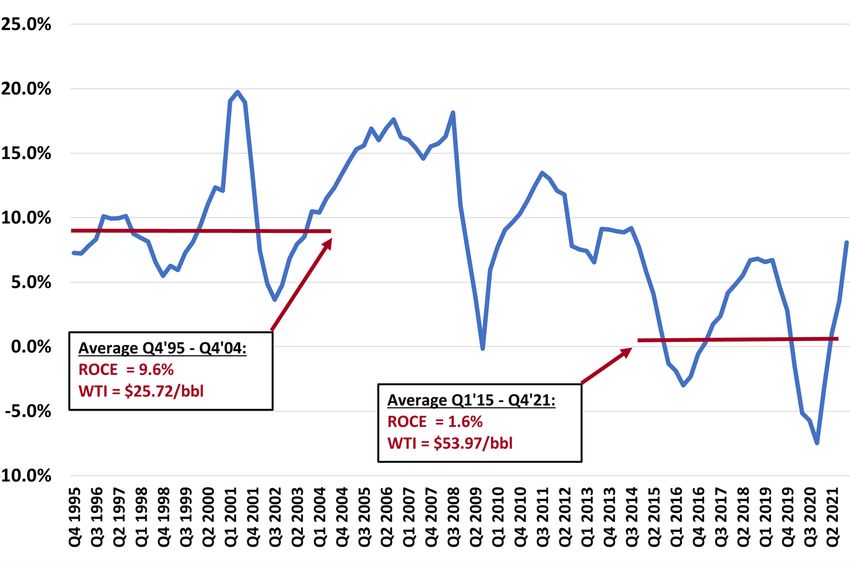
While spending still runs about $400 billion per year, this doesn’t all add to production capacity because depletion
rates for oil and gas fields globally are in the high single digits per year. This means that a significant portion of
capital spending is needed just to offset these natural declines. One way to capture this is to subtract depletion,
depreciation and amortization charges (DD&A) to derive the net incremental investment and then divide that by the
existing capital base to derive the growth rate of the industry’s capital base. That’s shown in Exhibit 2.
Exhibit 2– Capital Growth Rate for the Large Publicly Traded Petroleum Companies

                                                               * This chart calculates the capital growth rate of a
                                                               composite of major oil companies selected by EIP
                                                               using annual company reported data sourced from
                                                               Bloomberg. The composite included the following
                                                               companies (tickers): XOM, CVX, COP, RDSA LN, BP LN,
                                                               OXY, EOG, TTE FP, DVN, MRO, APA. Inclusions of other
                                                               companies may change the information above and
                                                               EIP’s analysis.

Exhibit 2 shows that despite investing $400 billion annually the oil and gas industry capital base has been
shrinking since 2016 because that capital spending is less than DD&A. While the over-spending built up some
excess capacity, events before the Russian invasion already indicated that surplus was gone. We wrote about this
last November in a piece called DUC DUC Goose Egg.
Even though this underinvestment cycle began during the Trump years, no one is blaming that administration as
low oil prices meant no one was paying attention, and because, well, there was no causal relationship. Now with
oil above $100 per barrel, everyone is asking why the petroleum industry is not growing its production faster. The
answer was provided last September by the Chairman of Chevron who said this in an interview with Bloomberg:
“There are two signals I’m looking for [to increase capital spending] and I’m only seeing one of them right now. We
could afford to invest more. The equity market is not sending a signal that says they think we ought to be doing
that.”
Translation: shareholders wanted more cash returned to them rather than drilled back in the ground. Why?
Because the returns from the last spending boom were so horrendously low. How low?Exhibit 3 shows the return
on capital employed (ROCE) for S&P 500 Energy Sector. The average ROCE over the last seven years between
2015-2021 have been about 1.6%, even though oil prices averaged about $54 per barrel (source Bloomberg).
Compare that to the nine years between Q4 ‘95-Q4 ‘04 when the ROCE averaged 9.6% and the oil price averaged
about $26.
Exhibit 3– Return on Capital Employed for the S&P 500 Energy Sector

                                                                                * This chart calculates the return on capital employed
                                                                                (ROCE) of a composite of major oil companies
                                                                                selected by EIP using annual company reported data
                                                                                sourced from Bloomberg. ROCE = (Earnings plus
                                                                                after-tax interest) / (Total Assets minus Current
                                                                                Liabilities). The composite included the following
                                                                                companies (tickers): XOM, CVX, COP, EOG, SLB, PXD,
                                                                                OXY, MPC, KMI, WMB, DVN, VLO, PSX, BKR, HAL, OKE,
                                                                                HES, FANG, CTRA, MRO, APA. Inclusions of other
                                                                                companies may change the information above and
                                                                                EIP’s analysis.

 EIP Insights Post March 16, 2022                                                                    www.eipinvestments.com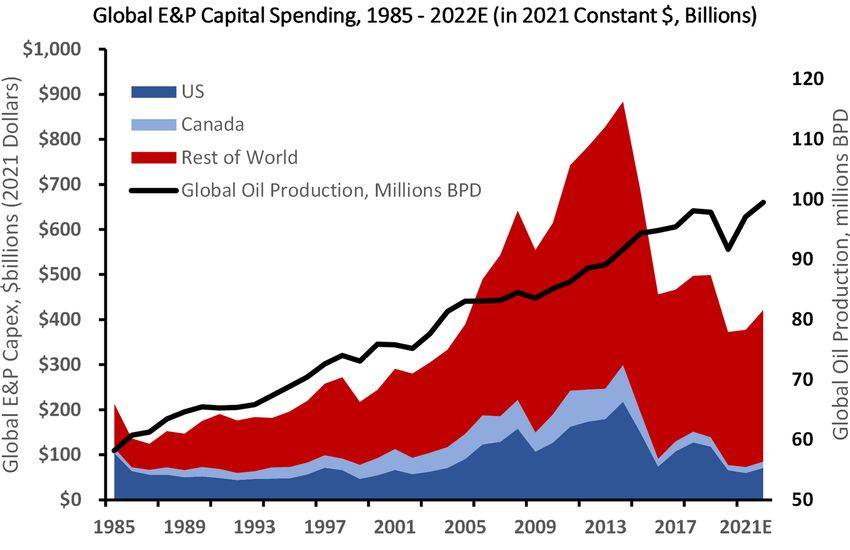
In our view, this was the primary issue that led ExxonMobil shareholders to vote against management on three of
the four board seats up for grabs last year, not the popular narrative linking it to environmental concerns. Put
another way, we think it was the “G” in ESG more than the “E” that caused the shareholder revolt. No doubt other
management teams in the industry took note as they could be challenged next, further increasing their focus on
returns. So, for the last two years it has become fashionable to keep a lid on capital spending as oil prices
recovered from pandemic lows and use the excess free cash flow for special dividends and share repurchase.
But now in the context of supply shortages and runaway pump prices dominating the headlines, the industry needs
a different narrative for public consumption, so they don’t seem like Scrooge or Mr. Potter in It’s a Wonderful Life.
So, they point the finger at their favorite bogeyman: bad government policy with a two-part story line. The first, is
the siphoning of capital from the fossil fuel industry to fund renewable subsidies. The second, is the obstruction of
drilling caused by Biden Administration policies. Let’s take subsidies first.
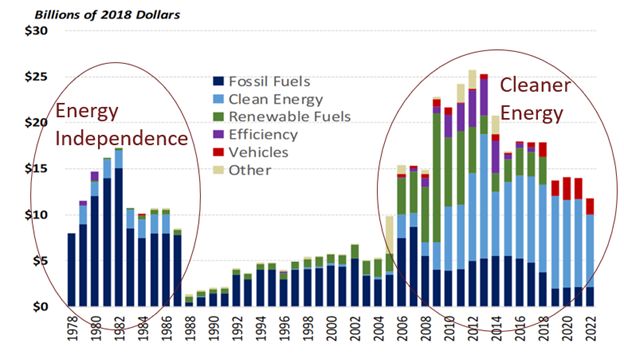
As we have published many times in Exhibit 4, there has in fact been a significant shift from incentivizing fossil
fuels in pursuit of U.S. energy independence to cleaner energy as the shale revolution took hold and public policy
shifted its concern from scarcity to abundance.
Exhibit 4– Federal Tax Incentives for Fossil Fuels and Clean Energy
Source: Congressional Research Service: The Value of
Energy Tax Incentives for Different Types of Energy
Resources - March 19, 2019. Energy tax incentives
include the value of (1) energy tax expenditures, as
estimated by the JCT; (2) energy tax provisions that
offset excise tax liability, such as tax incentives for
ethanol and biofuels (through 2015); and (3) outlays
that are related to tax provisions, notably outlays
associated with Section 1603 grants in lieu of tax
credits. Annual estimates are the sum of individual tax
expenditures and other tax provisions and do not
reflect possible interaction effects. Tax expenditure
estimates are based on current law, and thus do not
reflect forgone revenues associated with retroactive
extensions of expired provisions.
But this shift began in the Bush 43 Administration and continued through the Trump Administration.It’s not that
Trump was for these subsidies, it’s just that the President doesn’t allocate tax dollars, Congress does, unless the
President vetoes entire spending bills. Moreover, U.S. federal government incentives for clean and renewable
energy of about $10 billion dollars annually is a rounding error relative to the $440 billion per year decline in capital
spending (from about $880 billion in 2014 to about $440 billion for the last 5 years) undertaken by the global
petroleum industry shown in Exhibit 1.
Blaming a lack of capital spending on fossil fuels because of a government allocation of tax incentives doesn’t
make sense, as capital spending in the fossil fuel industry has always been primarily a function of available cash
flow and secondarily by Wall Street’s willingness to add or subtract from that sum. Attributing a capex drop that
began in 2015 to the policies of an administration that took over in 2021 is simply an uninformed and false
narrative.
That’s where the “stop drilling” narrative comes in. Biden did in fact issue two executive orders on his first days in
office: cancelling the Keystone XL pipeline from Canada and a 60-day moratorium on issuing drilling permits on
federal lands.
Because oil is also shipped by rail for export from Canada, the Keystone XL pipeline would have helped Canadian
oil production only if it the pipeline tariff was cheaper than rail transport. We believed that state, local, and
environmental opposition in the courts would keep adding to the cost of the pipeline until its cost advantage over
rail all but disappeared--death by a thousand cuts. That’s being proved out by the proposed Trans-Mountain oil
pipeline expansion which would move barrels from Edmonton, Alberta to Vancouver, British Columbia, a much
shorter route to ocean waters than Keystone XL (715 miles vs 1200 miles). Local opposition to that expansion
was so intractable that its owner, Kinder Morgan, sold it to the Canadian government who sees it as a strategic
asset. Current estimates of the project’s cost exceed $21 billion CAD, meaning the tariff to ship the oil via pipeline
could exceed the cost to ship by rail.[1]
The moratorium of drilling on federal land is the other part of the narrative. The most important fact to remember
here is that less than 15% of U.S. oil and natural gas production (which is less than 2% of global production)
comes from federal land[2]. Moreover, the 60-day moratorium has long since expired and drilling permits are
once again being issued. But the rate of issuance shown in Exhibit 4[3] might surprise you.
EIP Insights Post March 16, 2022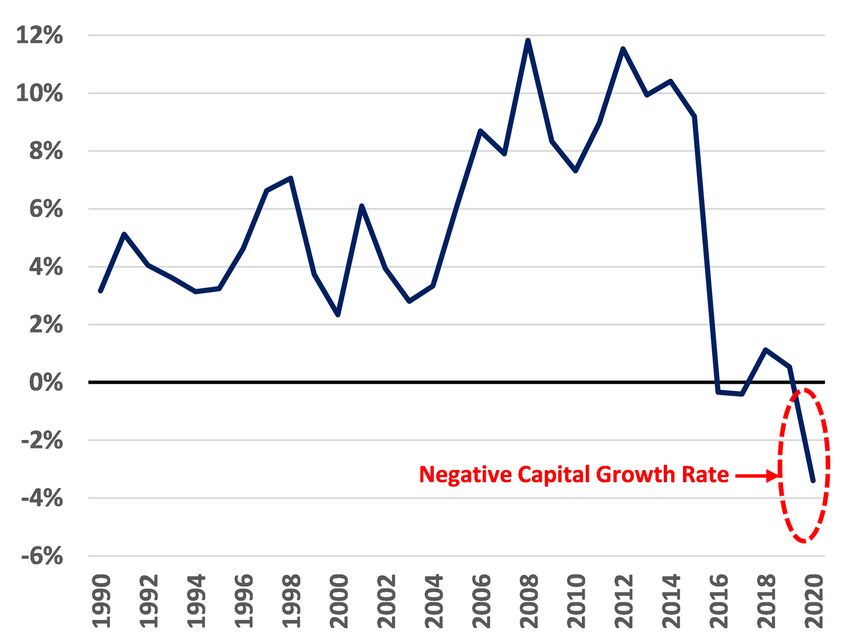
Exhibit 5– Annual Drilling Permits Awarded on Federal Lands

Source: U.S. Department of the Interior Bureau of Land Management (BLM), Oil and Gas Statistics - FY 2021, Table 7 Number of Approved APDs. The table
contains the total number of Federal Applications for Permit to Drill (APDs - Federal) by state approved by the BLM each fiscal year. Oil and gas operators
may not begin drilling activities on a lease without an approved APD and posted bond.

The Biden administration is in fact trying to limit the sale of new leases on federal lands, onshore and offshore.
But this effort--if it succeeds--will only affect oil and gas production many years in the future, and then only if the
industry has no development opportunities on private land that makes up the other 85+% of production.
Presidential authority to lease Federal lands is granted by Congress, and as a recent case in Federal District Court
showed, the President cannot act alone on this issue.
While it is true that leasing of new federal lands onshore has been declining for a variety of reasons not related to
the current Administration, another significant factor at play is the spike in the amount of proposed lease sale
acreage that is being challenged in court by state and local interests and environmental groups. Exhibit 6 shows
that the amount of acreage lease sales currently being challenged in court amounts to nearly 5 million acres,
about equal to the last five years of acreage.
Exhibit 6– New Onshore Acreage Leased by Year and Acreage Being Challenged

  Source: Dept of Interior and Declaration of Peter Cowan, Sr. Leasing Specialist, US Dept. of
  Interior, Bureau of Land Management, Division of Fluid Minerals before the US District Court for
  the Western District of Louisiana, May 19, 2021

These challenges have triggered an active review at the Federal level of the process by which acreage is made
available onshore and offshore, drilling permits are reviewed, pipelines are approved, etc. This year the Supreme
Court will hear a number of cases that deal directly with issues related to these challenges.
There is no question that the Biden Administration’s narrative and tone, up until recently, was anti-fossil fuel. While
campaigning he had threatened to shut down “fracking”, end all subsidies to fossil fuels and throw fossil fuel
executives in jail.[4] This kind of narrative was popular until the recent shortages and spike in prices. Just a year
ago this Working Paper[5] by the International Monetary Fund (IMF), claimed

EIP Insights Post March 16, 2022
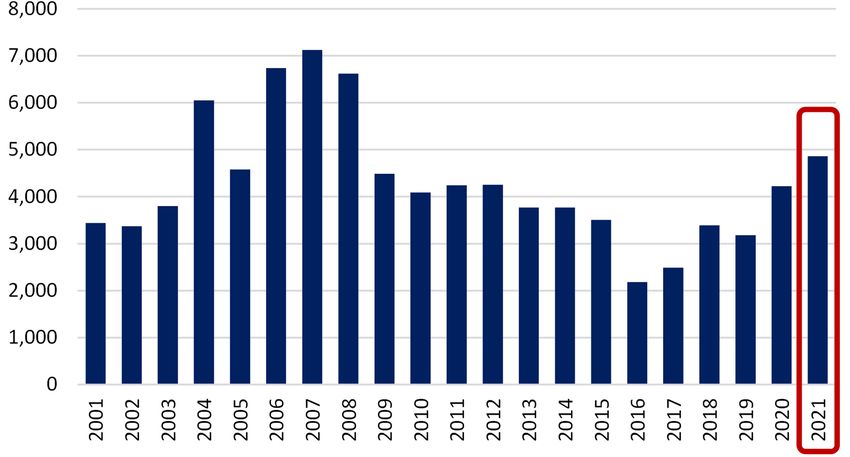
the global fossil fuels industry received $5.9 trillion – that’s TRILLION - in subsidies in 2020--a number rivalling the
annual revenues of the entire fossil fuel industry. Read the report more closely and you find that only $36 billion
are direct subsidies to global producers, the other 99.4% percent of the $5.9 trillion is subsidies to consumers and
the societal costs of greenhouse gas emissions. There are plenty of false narratives on both sides.
These hostile narratives do affect future oil and gas production, but those dots don’t connect unless you factor in
the providers of private capital. The reason oil production is lagging now results from capital allocation decisions
over the last five years driven by shareholders distrustful of the industry’s ability to invest profitably. Future
production trends will similarly be affected by the same dynamic. But the starting point is different. Five years ago
shareholders demanded—and got-- a huge increase in capital spending discipline as evidenced by more dividends,
share buybacks and lower operating expenses. That was a struggle between the owners and the players (i.e. the
management teams) and the owners won.
Now the war in Ukraine, the security issues it raises, and high pump prices means the public and their elected
representatives have a compelling interest in this industry dynamic and want to intervene. Some simply want
lower prices while others also want U.S. oil and gas production technology prowess to be a sort of “arsenal of
democracy.” To achieve this, politicians and policy makers will have to learn how to incentivize the owners
(shareholders) to loosen the purse strings. Threatening a windfall profits tax, for example, would do the opposite.
The global energy production/refining/delivery system is primarily owned and run by private companies. And while
government-owned petroleum companies are part of the mix, many of their facilities and projects are partnerships
with private companies. Words matter and if politicians keep flogging the oil industry in the town square,
shareholders may just keep their hands on their wallets.
As we have been writing in these blog posts and our quarterly letters for over a year, investor sentiment in the
energy world has been shifting away from exclusively green toward a broader base that incorporates existing
infrastructure.There is a similar shift now in the political narrative as politicians focused solely on long-term
climate issues fear being thrown out of office for being insensitive to near-term affordability and security
concerns. As Harvey Keitel said in Pulp Fiction, if self-preservation is an instinct these politicians possess, their
narrative will keep shifting. We would offer the same advice to the petroleum industry.

[1] Altex Energy analysis of rail shipping costs versus pipeline. https://www.altex-energy.com/economics-of-rail-versus-pipeline/
[2] Data as of 2020, Federal Lands, including Indian lands, as a percentage of total US onshore and Offshore Oil, natural gas, and natural gas liquids. Source:
US Department of Interior, U.S. Energy Information Administration, Short-Term Energy Outlook, March 2022.
[3] Source: https://www.blm.gov/programs-energy-and-minerals-oil-and-gas-oil-and-gas-statistics
[4] Source: https://www.dailymail.co.uk/news/article-7837265/We-jail-Biden-wants-prosecute-fossil-fuel-executives-environment-damage.html
[5] Source: https://www.imf.org/-/media/Files/Publications/WP/2021/English/wpiea2021236-print-pdf.ashx
The above is Energy Income Partner LLC’s (EIP) opinion and such opinions may change without notice or duty to update. The information is based on data
obtained from third party publicly available sources that EIP believes to be reliable, but EIP has not independently verified and cannot warrant the accuracy of
such information. Past performance is not indicative of future results, which may vary significantly due to changing conditions. Any investment may lose money,
including investment principal. EIP Accounts managed for partial periods could have experienced materially less favorable results than those portrayed over the
highlighted time horizon. An index is unmanaged, does not incur fees or expenses and an investment cannot be made directly in an Index.References to a
particular company or funds are for informational purposes only and are not an offer to purchase or sell or a solicitation to purchase or sell a particular security,
company or fund.

EIP Insights Post March 16, 2022

You can also read