The Global Use of Medicines 2022 - OUTLOOK TO 2026 - IQVIA

Page created by Felix Lawrence
 
CONTINUE READING
The Global Use of Medicines 2022 - OUTLOOK TO 2026 - IQVIA
The Global Use
of Medicines 2022
O U T L O O K TO 2 0 2 6

JANUARY 2022

Copyright © 2020 IQVIA. All rights reserved. IQVIA® is a registered trademark of IQVIA Inc.
in the United States and various other countries.
The Global Use of Medicines 2022 - OUTLOOK TO 2026 - IQVIA
Agenda
▪ Welcome and introductions
  Murray Aitken, Executive Director, IQVIA Institute for Human Data Science
▪ Global outlook and drivers
  Michael Kleinrock, Research Director, IQVIA Institute for Human Data Science
▪ Regional Highlights

   •   U.S.
   •   Europe
   •   China
   •   Japan
   •   Latin America

▪ Audience questions and moderated discussion
  Murray Aitken
▪ Closing

                                                                                 1
Today’s panelists

                                                                                  Alan Thomas
                                           Sarah Rickwood                         Director, Strategic
                                           VP, Thought Leadership                 Planning
                                           and Marketing                          Japan
                                           EMEA                     Howard Chen
               Hannah Law                                           Head of
               VP, Thought Leadership                               Management
               and Marketing                                        Consulting
               U.S.                                                 China

                        Sydney Clark
                        VP, Consulting Services
                        LATAM
                                                                                                        2
                                                                                                            2
Global outlook and drivers

                             3
Key Points
1. Global spending on COVID-19 vaccines is modeled to be $250Bn through 2026, though cost and volume
   estimates vary, and overall medicine spending is expected to exceed the pre-pandemic outlook by $133Bn
   to 2026 and grow 3-6% CAGR through 2026, reaching about $1.8 trillion in total market size.
2. Overall volume is projected to grow 1.5% in days of therapy through 2026, driven by pharmerging growth
   of 2.0% CAGR, while low-income countries are expected to grow at just 0.6% CAGR.
3. Slowing growth across key geographies is expected as health systems absorb pandemic costs and
   manage spending from the continuing historically high numbers of new medicines.
4. The two leading global therapy areas — oncology and immunology — are forecast to grow 9–12% and 6–
   9% CAGR, respectively, through 2026.
5. Treatments for autoimmune disorders are forecast to reach $178 billion globally by 2026, driven by steadily
   increasing numbers of treated patients and new products, and offset after 2023 due to biosimilars.
6. New therapies contribute to rapid acceleration of neurology markets, including novel migraine therapies,
   potential treatments for rare diseases, and the potential for therapies for Alzheimer’s and Parkinson’s.
7. The outlook for next-generation biotherapeutics includes significantly uncertain clinical and commercial
   prospects for cell, gene and RNA therapies, which will grow to $20 billion in spending by 2026.
                                                                                                                 4
Global spending, including COVID-19 vaccines and therapeutics,
             to exceed pre-pandemic outlook by $133Bn to 2026
             Changes in the historical and projected global medicine pending model due to COVID-19, 2019–
             2026, US$Bn
 1,900
                                                                                                                                                                                Spending outlook change
 1,800
                       Incremental spend for COVID-19 vaccines & therapeutics                                                                                   41                  due to COVID:
                       Current outlook excluding COVID vaccines
 1,700

                       Pre-COVID-19 outlook
                                                                                                                                                 39                               $133Bn, 2020–2026
                                                                                                                            39
 1,600

                                                                              48
                                                                                                    42
                                                                                                                                                                                           =
                                                                                                                                                              1,764            COVID-19 vaccine spending:
 1,500

                                                         97                                                                                     1,689
 1,400

                                      3                                                                                    1,615                                                       $251Bn
                                                                             1,489                 1,550
 1,300
                                                        1,424                                                                                                                       ($185–$295Bn)
                  1,297              1,340
 1,200

                  2019               2020               2021                 2022                   2023                   2024                 2025           2026                        +
  3E+11
                                                                        Cumulative difference, US$ Billion                                                    251                COVID-19 therapeutics:
                                                                                                                                            217                                   $58 Billion ($48-69Bn)
                                                                                                                       185
2.5E+11

  2E+11

                                                                                                   155                                                                   133
                                                                             121                              105                  114                  123
                                                        84                              88
                                                                                                                                                                                           +
1.5E+11

  1E+11

                                                                  58                                     35                  44                   50                58
  5E+10

                                          3                  16                    26
         0

                                                                                                                                                                               COVID-19 disruption impact:
                                                                                                                                                                                  -$175Bn 2020–2026
 -5E+10

                               -28            -25 -41
                                                                       -60
 -1E+11

                                                                                             -85                                                              -175
                                                                                                                    -115
-1.5E+11

 -2E+11
                                                                                                                                         -145
                  2019           2020           2021        2022          2023                                             2024            2025            2026
                  Cumulative difference in non-COVID spending from pre-COVID-19 levels                                              Cumulative Covid-19 vaccine spending
                  Cumulative COVID-19 therapeutics                                                                                  Total cumulative difference from pre-COVID-19 levels
             Source: IQVIA Market Prognosis, Sep 2021; IQVIA Institute, Nov 2021
             The Global Use of Medicines 2022: Outlook to 2026. Report by the IQVIA Institute for Human Data Science.
                                                                                                                                                                                                             5
Global market growth will return to pre-pandemic projections by
2025 despite year-to-year fluctuations
Comparison of current outlook to pre-COVID outlook

                   Constant dollar growth forecast (invoice)                                                   Key events in the outlook
   12%
                                                                                                               1 2020: -2.1% (~$27Bn)
   10%                                         Incremental COVID-19-related
                                               usage for treatments and vaccines                               2 2021: +1.1% above pre-Covid-19
                                                                                                                 growth; +2.9% above 2020 growth
    8%                                   3                                                 Post-pandemic         excluding vaccine and therapeutics
                                                                                          economic/budget
                                                                                             pressures         3 2021: +8% higher growth including
    6%                                                                                                           vaccines and therapeutics compared
                                                                                                    5            to spending without them
    4%      Demand
                                          2                                                                    4 2022: Significant decline in required
            impact
                                                                                                                 spending for COVID-19 vaccines as
                                       Post-                                                                     much of the world is inoculated to
    2%
            during        1         pandemic                            Vaccine spending                         some degree
            pandemic                  volume            4               declines with shift to
                                     rebound                            boosters                               5 Expected budget pressures will
    0%                                                                                                           emerge from longer-term pressures
              2019        2020         2021         2022         2023        2024         2025          2026     of sustained pandemic
            Pre-COVID-19 outlook
            Current outlook excluding COVID-19 vaccines & therapeutics
            Current outlook including incremental spend on COVID-19 vaccines & therapeutics

Source: IQVIA Market Prognosis, Sep 2021; IQVIA Institute, Nov 2021
The Global Use of Medicines 2022: Outlook to 2026. Report by the IQVIA Institute for Human Data Science.
                                                                                                                                                         6
The use of medicines particularly in pharmerging markets grew in
2020 despite the pandemic but will normalize beginning in 2021
Historical and projected use of medicine by segment, 2011–2026, Defined Daily Doses (DDD) in
Billions
                                                                                                                                                 Forecast
                                                                                                                                                               5-Year
                                                                                                                  5-Year                                       CAGRs
                                                                                         3,782                    CAGRs            3,877 3,965 3,971 3,944
                                                        5-Year                                                             3,773
 4,000

                                                                                   3,628       3,665                                191   192   192   191      1.5%
                                                        CAGRs                3,469        204                      2.9%     189
                                                                       3,297        204         185                                                            0.6%
                                                                                                                  -2.8%
 3,500

                                       3,109 3,177        4.2%                195
                               2,998                                    194
 3,000                 2,881            213   214         1.8%
                               225
         2,590 2,683   218
                198                                                                                                                    2,452 2,458 2,442
          196                                                                                    2,236 2,215               2,295 2,378
 2,500

                                                          6.5%                  2,010 2,128                       4.6%                                         2.0%
                                                                       1,885
                                   1,724 1,769
                       1,502 1,585
 2,000

         1,294 1,374
 1,500

 1,000

  500
         1,100 1,111 1,162 1,188 1,172 1,194              1.6%         1,218 1,264 1,297 1,343 1,265              1.2%     1,289 1,308 1,321 1,321 1,311
                                                                                                                                                               0.7%

    -

         2011   2012   2013    2014    2015   2016                     2017     2018    2019     2020      2021            2022    2023   2024   2025   2026

                                              Lower income                                     Pharmerging                            Developed
Source: IQVIA Market Prognosis, Sep 2021; IQVIA Institute, Nov 2021
The Global Use of Medicines 2022: Outlook to 2026. Report by the IQVIA Institute for Human Data Science.
                                                                                                                                                                        7
The global medicine market — using invoice price levels — is
expected to grow at 3–6% CAGR through 2026 to about $1.8Tn
Global medicine market size and growth 2011–2026, const US$Bn

                                                                                                                                                   Forecast
                                                                                                                                                                     5-Year
  2,000
                                                                                                                        5-Year                                1,750– CAGRs
  1,800                                                                                                                CAGRs                                  1,780 Overall
                                                                    5-Year                                              Overall                                       3-6%
  1,600                                                                                                                                                               3-6%
                                                                    CAGRs                                         1,424 5.1%
  1,400                                                             Overall                                              0.1%
                                                                     6.5%
  1,200                                                     1,112

  1,000                                                              4.8%
              813                                                   11.4%                                                7.8%                                        5-8%
     800

     600

     400                                                             5.3%                                                4.3%                                        2-5%

     200

             2011     2012      2013     2014      2015     2016               2017     2018      2019     2020   2021            2022   2023   2024   2025   2026

                                                               Developed                  Pharmerging              Lower income

Source: IQVIA Market Prognosis, Sep 2021; IQVIA Institute, Nov 2021
                                                                                                                                                                              8
The Global Use of Medicines 2022: Outlook to 2026. Report by the IQVIA Institute for Human Data Science.
Strong growth in pharmerging markets and new brands in
developed markets will lift global spending through 2026
Spending and growth drivers 2016–2026 const US$Bn

                                                                                                                         Forecast

                                                                                                                                     1,750–
                                                                                                                                     1,780

 2016                                                                                      2021                                       2026
Spending                                                                                  Spending                                  Spending

                               10 Developed                                                               10 Developed

Source: IQVIA Market Prognosis, Sep 2021; IQVIA Institute, Nov 2021
The Global Use of Medicines 2022: Outlook to 2026. Report by the IQVIA Institute for Human Data Science
                                                                                                                                               9
New brand spending in developed markets projected to be similar
     to the last 5 years but a smaller share of spending
     Ten developed countries new brand spending

                                             Total 2012−16 = $177Bn                   Total 2017−21 = $161Bn                              Total 2022−26 = $196Bn

                                 60                                                                                                                                                   12%

                                                                                                                                                                                            New brands % of total brand spending
New brand spending const US$Bn

                                 50                                                                                                               Forecast                            10%

                                 40                                                                                                                                                   8%

                                 30                                                                                                                                                   6%

                                 20                                                                                                                                                   4%

                                 10                                                                                                                                                   2%
                                      17      15     34      55       57        38         35     36           26       26       31          40         42         41            42
                                  0                                                                                                                                                   0%
                                      2012   2013   2014    2015      2016      2017      2018   2019          2020    2021      2022      2023        2024       2025       2026
                   Global
                                                                                                                         79           Average launches projected at 54–63/year
                   NAS                 36     42      56      46       39        48        59      51           79                       (290–315 launches within 5-years)
                   Launches
                                                                                                                      (77-81)*

                                                           New brand spending                                         New brands share of brand spending
     Source: IQVIA Market Prognosis, Sep 2021; IQVIA Institute, Nov 2021
     The Global Use of Medicines 2022: Outlook to 2026. Report by the IQVIA Institute for Human Data Science                                                                                                                       10
The impact of exclusivity losses will increase to $188Bn over
the next 5 with a large increase in the impact of biosimilars
Developed markets impact of brand losses of exclusivity 2017–2026, US$Bn

                                                                                                                                       Forecast

       2017               2018               2019               2020               2021               2022           2023            2024         2025    2026
 0

                -1.4       -3.7               -5.5               -5.2                                     -6.4
       -23.4                                                                        -9.7                                                                  -11.6
 -5

                          -20.5                                                                                      -14.8                        -13.8
-10
                                             -21.9              -10.5                                 -25.5
                                                                                    -9.4                                             -23.0
-15
                                                                                                                                                          -24.3
                                                                                                                     -28.8                        -24.8
-20
                                                                -15.7
                                                                                   -19.1
                                                                                                                                     -14.9
-25

       -24.7              -24.3
-30

                                             -27.4
-35

                                                                                                      -31.9
                                                                                                                                                          -35.9
                                                                                                                                     -37.9
-40

                                                                                                                                                  -38.6
-45

                                                                                                                     -43.7
-50

                                  $25Bn    $86Bn                                                                              $70Bn   $118Bn
                                      $111Bn                                                                                     $188Bn

                                                             Biologic                      Small                 $ Total brand loss due to LOE
Source: IQVIA Market Prognosis, Sep 2021; IQVIA Institute, Nov 2021
The Global Use of Medicines 2022: Outlook to 2026. Report by the IQVIA Institute for Human Data Science
                                                                                                                                                                  11
Global savings from biosimilars will have a significant impact on
country medicine spending through 2026
Global savings from biosimilars 2021-2026

                                                                                            5-year savings scenarios

120
                                                                                 $215Bn base case ($165–270Bn Range)

100

 80

 60

 40

 20

  0
                  2021                           2022                           2023                      2024             2025   2026
                                                                    Savings high-low range                       Savings

Source: IQVIA Market Prognosis, Sep 2020; IQVIA Institute, Mar 2021
The Global Use of Medicines 2022: Outlook to 2026. Report by the IQVIA Institute for Human Data Science                                  12
Oncology and neurology lead growth while immunology slows
due to biosimilars
Top 20 therapy areas in 2026 in terms of global spending with forecast 5-year CAGRs, const $US
                                                                                                                    5-Year CAGR
                                                                                                                2022–2026 Const US$
                                          2026 Spending
                      Oncologics                                                                          306           9-12%
                    Immunology                                                                   178                     6-9%
                    Antidiabetics                                                               173                      6-9%
                       Neurology                                                         151                             3-6%
                  Anticoagulants                                     87                                                 8-11%
                 Cardiovascular                                      87                                                  4-7%
                      Respiratory                              71                                                        5-8%
                              Pain                             70                                                        6-9%
                   HIV antivirals                        45                                                              3-6%
                   Antibacterials                       41                                                               2-5%
                     GI products                       37                                                                4-7%
                 Ophthalmology                    26                                                                     3-6%
           Vaccines ex COVID                      26                                                                    -1-2%
                  Dermatologics                  25                                                                     8-11%
                 Lipid regulators                23                                                                      5-8%
              Hospital solutions                22
                                                                                                                         2-5%
                   Anti-ulcerants               20
                                                                                                                         1-4%
             Blood coagulation                 19
                                                                                                                         5-8%
             Trad chinese med                  16
                                                                                                                        -1-2%
    Cough cold, incl flu antivirals        5
                                                                                                                        -1-2%

Source: IQVIA Institute, Nov 2021
The Global Use of Medicines 2022: Outlook to 2026. Report by the IQVIA Institute for Human Data Science                               13
Global oncology spending to exceed $300 billion by 2026,
      with growth slowing to 10% from biosimilar savings
      Global oncology spending and growth

                          350                                                                            Forecast                20%

                                                                                                                           306   18%                                    2022–2026 Key Metrics
                          300
                                                                                                                     278
                                                                                                                                 16%

                                                                                                                                       % Spending growth constant US$
Spending constant US$Bn

                                                                                                               252                                                           +63% total
                          250                                                                                                    14%                                      spending growth
                                                                                                     229
                                                                                              208                                                                          (9–12% CAGR)
                                                                                                                                 12%
                          200                                                         187
                                                                              170
                                                                                                                                 10%
                                                                       151
                          150                                                                                                                                                 +$119Bn
                                                               128                                                               8%
                                                         110
                                                    98                                                                           6%
                          100                  86
                                          75
                                60   66
                                                                                                                                 4%                                          ~+100 new
                          50
                                                                                                                                 2%                                        oncology drugs

                           0                                                                                                     0%
                                2012 2013 2014 2015 2016 2017 2018 2019 2020 2021 2022 2023 2024 2025 2026
                                                            Spending                           Growth

     Source: IQVIA Institute, Nov 2021
     The Global Use of Medicines 2022: Outlook to 2026. Report by the IQVIA Institute for Human Data Science                                                                                    14
Immunology spending growth to slow to 6-9% through 2026 from
biosimilar impact as volume growth continues at 12% annually
Global immunology Spending and Growth

                                 200                                                                  Forecast                25%

                                 180                                                                                                           2022–2026 Key Metrics
                                                                                                                        178
Global spending constant US$Bn

                                 160                                                                              168         20%
                                                                                                            158
                                 140                                                                  149                                         +12% per year
                                                                                              141
                                                                                                                                                  volume growth
                                 120                                                  127                                     15%

                                                                                                                                    % Growth
                                 100                                            108                                                                 +50 Billion
                                                                           94                                                                          +39%
                                 80                                                                                           10%
                                                                      80                                                                           (6-9% CAGR)
                                 60                              69
                                                            58
                                 40                   49                                                                      5%                   Average cost
                                                 40                                                                                                  per day
                                 20         32
                                       28                                                                                                           -$7 to $27
                                  0                                                                                           0%
                                       2012 2013 2014 2015 2016 2017 2018 2019 2020 2021 2022 2023 2024 2025 2026

                                                           Spending         Growth               DDD growth

Source: IQVIA Institute, Nov 2021
The Global Use of Medicines 2022: Outlook to 2026. Report by the IQVIA Institute for Human Data Science                                                                15
The outlook for next-generation biotherapeutics includes
significantly uncertain clinical and commercial successes
Cell, gene and RNA therapeutics

                                  60

                                  50
 Global spending constant US$Bn

                                  40

                                  30

                                  20
                                        First therapies were launched
                                       in 2010 but had less than $1Bn
                                  10       total spending until 2018

                                  0
                                       2016     2017     2018     2019          2020           2021       2022      2023   2024   2025   2026

                                                                        Range of Scenarios                   Base case

Source: Company Financials; IQVIA Institute Nov 2021
The Global Use of Medicines 2022: Outlook to 2026. Report by the IQVIA Institute for Human Data Science                                         16
New therapies in rare neurological disorders, Alzheimer’s, and
        migraine are expected to drive spending growth in neurology
        Leading CNS disorders global market growth dynamics
                                    25%

                                              Alzheimer's
                                                                                                                                                           Migraine
Global % CAGR const US$ 2021–2026

                                    20%

                                    15%

                                    10%                                                                           All other central
                                                                                     Antipsychotics               nervous system
                                                                          Anxiety

                                    5%                      Anti-epileptics
                                                                                                            Opioid dependence
                                                            Parkinson's
                                                                                                             Alcohol dependence
                                    0%                                                                Antidepressants
                                                                   ADHD
                                                                                             Multiple sclerosis                                   Neurology
                                                                                                                                                  Mental Health
                                    -5%
                                       -15%    -10%             -5%                 0%           5%               10%                 15%   20%   25%             30%

                                                                                Global % CAGR const US$ 2016–2021

       Source: IQVIA Institute, Nov 2021
       The Global Use of Medicines 2022: Outlook to 2026. Report by the IQVIA Institute for Human Data Science                                                          17
The Global Use
of Medicines 2022
U . S . M AR K E T O V E RV I E W

JANUARY 2022

Copyright © 2020 IQVIA. All rights reserved. IQVIA® is a registered trademark of IQVIA Inc.
in the United States and various other countries.
The U.S. market, on a net price basis, is forecast to grow 0–3% CAGR
      over the next 5 years, down from 3.5% CAGR for the past 5 years
      U.S. Medicine Spending and Growth at invoice-level and estimated net 2011–2026
                                                                                                                                                       Forecast
                                                                                                                                                                  699
700

                                                                                                                                                         674
                                                              5-Year                                                     5-Year                  648                      5-Year
                                                                                                                                          625
                                                              CAGRs                                                      CAGRs     605                                    CAGRs
600                                                                                                             580
                                                                                                        545
                                                              Invoice                          521                       Invoice                                          Invoice
                                                                                      493
500

                                                   456         CAGR          465                                          CAGR                                             CAGR
                                          437                   7.0%                                                       4.9%                                            2-5%
400
                                 384
      327               332                                  Net 28%                                                     Net 35%                                         Net 39%
               317                                            below                                                       below                                           below
300

                                                             invoice                                                     invoice                                         invoice

                                                                                                                                          397    406     416      424
200

                                                                                               363      363     380                390
                                          318      331      Net CAGR         331      344                              Net CAGR                                          Net CAGR
      262               255      286                          4.8%                                                       3.5%                                              0-3%
100
               253

  0

      2011     2012     2013    2014     2015     2016                       2017     2018    2019     2020     2021               2022   2023   2024    2025     2026

                                                                        Net sales                     Invoice to net difference
      Source: IQVIA Institute, Nov 2021
      The Global Use of Medicines 2022: Outlook to 2026. Report by the IQVIA Institute for Human Data Science
                                                                                                                                                                                    19
Spending in the U.S. is expected to increase by $119Bn through
2026 driven by new and existing brands
Spending and growth drivers in US 2016–2026 Const US$Bn
                                                                                                          Forecast

  2016                                                                                     2021                        2026
 Spending                                                                                 Spending                   Spending

Source: IQVIA Market Prognosis, Sep 2021; IQVIA Institute, Nov 2021
The Global Use of Medicines 2022: Outlook to 2026. Report by the IQVIA Institute for Human Data Science
                                                                                                                                20
New brand spending in the U.S. is projected to be higher than the
last five years but a smaller share of spending
U.S. New brand spending
                                                                                                                                             Forecast

                                       Total 2012−16 = $112Bn
New brand spending US$Bn

                           40                                                                                                                                            12%

                                                                                                                                                                               New brands % of total brand spending
                                                                                                                                    Total 2022−26 = $114
                           35                                                  Total 2017−21 = $93Bn                                                                     10%
                           30
                                                                                                                                                                         8%
                           25

                           20                                                                                                                                            6%

                           15
                                                                                                                                                                         4%
                           10
                                                                                                                                                                         2%
                            5
                                 9      8      25      35       34      22        18         22           15       15       18        23        25        24        24
                            0                                                                                                                                            0%
                                2012   2013   2014    2015      2016   2017     2018        2019          2020   2021       2022    2023      2024      2025      2026

US NAS                                                                                                              60        Average launches projected at 50–55/year
                                 29     37     46      49        27      42        58         51           55
Launches                                                                                                         (58-62)*        (250–275 launches within 5-years)

                                                                New brand spending            New brands share of brand spending

Source: IQVIA Market Prognosis, Sep 2021; IQVIA Institute, Nov 2021
The Global Use of Medicines 2022: Outlook to 2026. Report by the IQVIA Institute for Human Data Science
                                                                                                                                                                                                                      21
The U.S. is an increasingly complex environment
Market dynamics to watch

1   Perpetual uncertainty of
       healthcare reform            2        Payer control in
                                               commercial               3      COVID accelerates
                                                                               new models of care

✓ Healthcare reform + Part D re-   ✓ Expanding payer control          ✓ New sites, new models pick up
  design                                                                impact of loss care
                                   ✓ Formulary exclusions
✓ Growth and controversy in 340B                                      ✓ Rising awareness and evidence
                                   ✓ Net price pressure in              of disparity in access
                                     immunology and other specialty
                                                                      ✓ New opportunity across value
                                   ✓ New evidence requirements          chain
                                                                      ✓ Patient engagement in high
                                                                        demand

                                                                                                        22
Access and costs under pressure as payers and manufacturers
prepare for potential policy changes and new competition

    Proposed Part D changes                                                                      Increase in access restrictions                                                                             Formulary exclusions

     Reform potential a constant                                                                     Competitive dynamics matter                                                                       Oncology no longer protected
✓   Removes coverage gap1                                                                        ✓      Rising number of blocked products in 20212                                                ✓        Payers address market competition, open the
                                                                                                                                                                                                           door for more patient alternatives
✓   Adds manufacturer liability in initial and                                                   ✓      Specialty patients 20% more likely not to fill a
    catastrophic phases1                                                                                prescription vs 20133
                                                                                                 ✓      25% abandonment in specialty for Part D patients4
                                                                                                                                                                                                                                                          60
                                                                                                                                                                                             60
                                                                                                 100%                                                                                        55

                                                                                                                                                            Number of Formulary Exclusions
                                                                                                 90%        21%                                                                              50
                                                                                                                         31%     29%
                                                                                                                                             37%                                             45

                                                                  New Patient Starts (% NBRxs)
                                                                                                 80%                                                                                                                                                      34
                                                                                                                                                    45%
                                                                                                            12%                                                                              40                                              37
                                                                                                 70%
                                                                                                                         11%     12%                                                         35
                                                                                                 60%                                         10%                                             30
                                                                                                 50%                                                11%                                      25                                              22
                                                                                                 40%                                                                                         20
                                                                                                                                                                                                                                16
                                                                                                            67%                                                                              15
                                                                                                 30%                     58%     60%                                                                                            6                         26
                                                                                                                                             53%
                                                                                                                                                    44%                                      10
                                                                                                 20%                                                                                                                                         15
                                                                                                                                                                                             5                                  10
                                                                                                 10%                                                                                                   2            4
                                                                                                                                                                                             0
                                                                                                  0%                                                                                                  2017        2018         2019        2020         2021
                                                                                                            2013         2015    2017        2019   2021
                                                                                                                                                                                                      Excluded Products with Branded Preferred Alternatives
                                                                                                                Filled    Abandoned     Rejected                                                      Excluded Products with Generics/Biosimilars

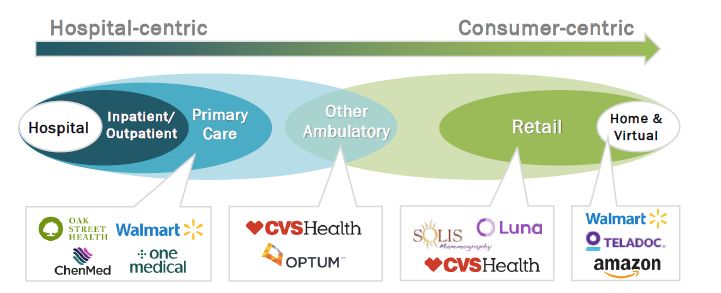
Sources: IQVIA LAAD Claims Data, 2021; Published national formularies; 1IQVIA Thought Leadership; 2, 3, 4IQVIA US Market Access Strategy Consulting analysis                                                                                                   23
COVID-19 disrupted care, and the status quo, making room for
new players, and new models, to serve and empower patients

  DISRUPTION                                                                                                                                                           INNOVATION

                                                                                                                 Raised in 1H2021 for                                  States expand
                                        missed preventive health                                $15B
               8.5M                     visits, unevenly distributed1
                                                                                                                 telemed platforms5                            38      telehealth coverage7

                                                                                                                CAGR through ’27 in                                           Digital Health
                                        missed diagnosis visits in                               7.9%                                                         $29B
               269M                     1H20212                                                                 home healthcare market6                                       Funding in ‘21
                                                                                                                                                                              (2x 2020)8

                                        compound annual growth rate
               -8%                      of oncology diagnosis visits
                                        from 2019 to 20213

                                        Growth in telehealth claims
               2,901%                   compared to 2021 vs 20194

Sources: 1Health Equity in the Time of COVID-19, IQVIA; 2, 3, 4IQVIA Claims Data, 2021; 5https://mercomcapital.com/product/1h-q2-2021-digital-health-healthcare-it-funding-ma-
report/; 6Advancing Health Outcomes Through Home Healthcare, IQVIA; 7 ; 8https://rockhealth.com/insights/2021-year-end-digital-health-funding-seismic-shifts-beneath-the-surface/              24
The Global Use
of Medicines 2022
E U R O P E O V E RV I E W

JANUARY 2022

Copyright © 2020 IQVIA. All rights reserved. IQVIA® is a registered trademark of IQVIA Inc.
in the United States and various other countries.
Spending in top 5 Europe is expected to increase by $51Bn
through 2026 driven by new brands
Spending and growth drivers in France, Germany, Italy, Spain, and UK 2016–2026 const US$Bn

                                                                                                          Forecast

  2016                                                                                     2021                        2026
 Spending                                                                                 Spending                   Spending

Source: IQVIA Market Prognosis, Sep 2021; IQVIA Institute, Nov 2021
The Global Use of Medicines 2022: Outlook to 2026. Report by the IQVIA Institute for Human Data Science                         26
The impact of exclusivity losses will reach $33 billion over 5
years, with more than half due to the availability of biosimilars
EU4+UK Impact of brand losses of exclusivity 2017–2026, US$Bn

                                                                                                                                        Forecast

       2017               2018               2019               2020               2021               2022                 2023            2024    2025   2026
  0

                          -0.2                -0.3               -0.7
                -0.3      -1.7
 (1)
        -1.7                                  -1.0                                                        -1.7
                                                                 -1.1
                                                                                    -3.1                                                    -3.6
 (2)
                                              -1.3                                                                          -3.9
        -2.0               -1.8                                  -1.8                                     -2.9                                     -4.8
 (3)
                                                                                                                                                          -5.3
 (4)
                                                                                    -1.3
                                                                                                                                            -2.3
                                                                                                                            -3.8
 (5)

                                                                                    -4.4                  -4.6                                     -3.2
 (6)
                                                                                                                                                          -1.7
                                                                                                                                            -6.0
 (7)

 (8)
                                                                                                                                                          -7.0
                                                                                                                            -7.7                   -8.0
 (9)

(10)

                                  $4.6Bn     $6.7Bn                                                                                $19.4Bn $13.9Bn
                                       $11.3Bn                                                                                          $33.3Bn

                                                           Biologic                    Small                     $   Total brand loss due to LOE
Source: IQVIA Market Prognosis, Sep 2021; IQVIA Institute, Nov 2021
The Global Use of Medicines 2022: Outlook to 2026. Report by the IQVIA Institute for Human Data Science                                                          27
Rate of uptake of biosimilars has accelerated as stakeholders
become increasingly comfortable and competition grows
Biosimilar market averaging 40% after 12 months and likely 60% after 24

             Europe biosimilar uptake rates                                                           Biosimilar market dynamics
             (months since launch, Treatment Days)                       Launch
                                                                          Dates                 • Payers extract steep discounts in EU,
 100%                                                                                             eg >80% for Humira in Nordics…
                                                         Bevacizumab     Jul 20
                                                                                     Price      • ...but savings have not translated into
   80%                                                   Adalimumab
                                                                         Oct 18
                                                                                    impact        consistent volume expansion of biologics
                                                                         Oct 18
                                                         Pegfilgrastim                          • Originators are also evolving their offer…
   60%                                                                                            –Re-formulation (eg sub-Q; improved excipient)
                                                                         Apr 18                    can slow erosion, but only for a while
                                                         Trastuzumab
                                                                                                  –Aggressive price competition to win back tenders
   40%                                                                            Competitor • Biosimilar manuf. are innovating…
                                                         Rituximab
                                                                         Apr 17
                                                                                   strategies  –Celltrion launched infliximab sub-Q formulation in
                                                         Etanercept
                                                                                                   EU – while original Remicade only available as IV
   20%

                                                         Infliximab
                                                                         Mar 16             • Even greater budget pressures will drive
    0%                                                                                        payers to aggressively seek savings
                                                                         Oct 13
         M0 M6 M12 M18 M24 M30 M36                                                 COVID-19 • Catalyst for changing biosims. dynamics?
Source: IQVIA EMEA Thought Leadership; IQVIA MIDAS MTH September 2021                                                                                  28
Market access environment in EU4+UK remains challenging and
some countries aim for reforms
Healthcare cost containments as a focus together with improving HTA processes
               UK
 ▪    Faster, more agile NICE assessments
      to increase access to innovation                                                                       Germany
 ▪    Population Health Agreement                                                                 ▪   New Coalition focus on Cost
 ▪    Favourable Biosimilar Launch country                                                            Containment (AMNOG)
                                                                                                  ▪   Call for end of “Orphan Privilege”
               France
                                                                                                  ▪   Discussion Substitution for 26
 ▪    Improve Patient Access (LFSS)                                                                   Biosimilar Candidates
 ▪    Ensure Drug Supply Security
 ▪    Increase Gx and Bx Usage                                                                               Italy
               Spain                                                                              ▪   30% Increase in Funds for Innovative
 ▪    Streamline HTA system                                                                           Medicine
 ▪    Approval of Hospital-developed Cell                                                         ▪   AIFA reorganisation
      Therapy                                                                                     ▪   Faster Access to Orphan Drugs
 ▪    Promote wider Gx and Bx Usage

     Pan-European HTA by 2025: “a key deliverable of the European Pharmaceutical Strategy and an important building block for a European
                                        Health Union” – Health Commissioner Stella Kyriakides

Source: IQVIA EMEA Thought Leadership; IQVIA HTA Accelerator                                                                                 29
EU proposes harmonised regulation on HTA in a phased
approach, starting with cancer therapies in 2025
Aim to improve medicine availability, ensure efficient resource usage and strengthen HTA quality

            Regulation passed                Begin to take effect                               EU HTA covering
            European Parliament              on                                                 all therapy areas
            13/12/2021                       01/01/2025

     2021/22                           2025                           2028                2030+                                                   Open
               HTA Guidance                                                                                                                       Questions
Phases

                                                                          Cancer Therapies
                                                                                                                                • Comparability to national
                                                                                      Orphan Drugs & ATMPs                        assessments
                                                                                                                                • Timeline unclear for the
                                                                                                     All other Areas              start of the national HTAs
          ▪ EUnetHTA Service                ▪ Member states collaborate on the creation of Joint Clinical Assessments (JCA)     • Handling of the
            Agreement                         and Joint Scientific Consolations (JSC)                                             manufacturers data at the
Details

          ▪ Consortium of 12 EU/EEA         ▪ Solid scientific basis for pricing and reimbursement decisions that will remain     national level
            member states                     at the national level                                                             ---------------------------------------
          ▪ Development of                  ▪ JCA are not legally binding but member sates need to give “due consideration”     EU Methods paper essential
            methodologies ahead of                                                                                              to ensure consistency
                                            ▪ Maximum transparency of the data submitted by the applicant
            EU HTA regulation                                                                                                   across member states

Source: IQVIA EMEA Thought Leadership; IQVIA HTA Accelerator                                                                                                              30
Healthcare system digital maturity accelerates, but not all
 countries develop at the same pace
5                                      EMEA Digital Health System Maturity Score                                                                                                                                                    Impact on Medicines
                                                   A country’s overall rating is constructed from 12
                                                                                                                                                                                                                                     Innovation and use
                                                   elements* and scored against peers from 1 to 5
                                                                                                                                                                                                  • Innovation and insight: Mature countries have
                                                                                                                                   Denmark                                                          well developed patient data collection, including
                                                                                                                                                                                                    EHR, Genomic data and consistent data standards
4                                                                                                                Sweden
                                                      Estonia                                                                                                                                       which can drive RWD collection, speed clinical
                                                                                                                                                                                                    development; telemedicine infrastructure speeds
                                                                                                                                                                                                    remote trial implementation
                                                                                 Israel
                                                                                                      Austria
                                                                                       Belgium                                                                                                    • Evaluating medicines use and impact: digitally
3                                           Lithuania                                                            Netherlands                                    Switzerland
                                                                                                                                                                                                    mature countries have the infrastructure and
                              Poland
Kazakhstan           Russia                                                             UAE
                                                                                                                                                                                                    governance to collect and use nation wide data on
                                     Hungary
Ukraine                                                         Slovenia
                                                                                                                                                                                                    medicines use and outcomes, and to act on that –
                                                                                                                                                                   Ireland
                 Turkey
                                 Romania
                                                 Latvia                                                                                                                                             enabling, for example, the possibility of evidence
South Africa
                            Bulgaria
                                                             Saudi Arabia                                                                                                                           based medicines use and population health
2              Albania                                                                                                                                                                              agreements
     India                                                   Czechia                                       5 – Sophisticated at a national scale
                               Croatia           Greece                                                    4 – Regional maturity and scaling
    Egypt
                                                                                                           3 – Developing rapidly with potential                                                  • Rationalising medicines use to drive cost
                               N. Macedonia
                                                                                                           2 – Underdeveloped and challenged                                                        savings: Europe has had the lengthiest history of
Morocco Bosnia              Serbia
                                                                                                           1 – Very little digital progress                                                         biosimilar approval and uptake, but uptake is still
1                                                                                                                                                                                                   variable and cost saving impact could be driven
    0                 10                  20          30         40      50       60                                                           70                  80                  90           faster with better use of data to track progress
                                                 GDP per Capita (Thousands of USD, 2020)
 Notes: *These 12 elements belong to three groupings. Initiatives: policy, funding, data governance, institutions. Infrastructure: Electronic health records, data standards, omics, interoperability. Implementation: telehealth, AI, information use, virtual studies
 Source: IQVIA European Thought Leadership; GDP per capita data obtained from World Bank Open Data; Framework scores are based on interviews and surveys with internal IQVIA experts                                                                                      31
The Global Use
of Medicines 2022
C H I N A O V E RV I E W

JANUARY 2022

Copyright © 2020 IQVIA. All rights reserved. IQVIA® is a registered trademark of IQVIA Inc.
in the United States and various other countries.
China’s healthcare reform is shifting the market towards a value-based
innovation focused market

                                                                 Market Access in China

                            Regulatory         Manufacturing          Tendering &
                                                                                          Hospital Listing         Prescription          Reimbursement
                            Registration         & Supply             Distribution

                                               Localization of        Volume-Based                              Digital Healthcare
Policy Initiatives       Expedited Approval                                              Tiered Care System                             NRDL Adjustment
                                               Manufacturing        Procurement (VBP)                              Revolution

                                                                                                                                            Healthcare
                                                                       Mechanism           Diagnosis and Rx     Digitalization in the
                            Encouraged                                                                                                  expenditure control
Key Trends                                     Deglobalization      normalization and         outflow to          entire industry
                            innovation                                                                                                      thanks to
                                                                    price cut of drugs    improve efficiency          ecology
                                                                                                                                           negotiations

Key                                                                                      Hospital (Provider);   Hospital (Provider);
                         NMPA (Regulator)     NMPA (Regulator)        NHSA (Payer)                                                         NHSA (Payer)
Stakeholders                                                                              NHC (Regulator)        NHC (Regulator)

Impact on
Pharmaceutical
Companies
                                ☺                   ☺                                                                                       
Source: IQVIA analysis                                                                                                                                        33
Spending growth in China is expected to accelerate post-COVID, driven
almost entirely by new original medicines
China medicine spending by product type 2011–2026

                                                                                                                                                            Forecast
                                                                                                                                                                              5-Year
                                                                                                                                                                       205    CAGRs
                                                                                                                                                               197
                                200                                                                                                                   189
                                                                                                                          5-Year               182                            3.8%
                                                                                                                                       175
Medicine spending const US$Bn

                                                                                                                      169 CAGRs
                                                                                                        161    158
                                                                                 5-Year                                        6.1%
                                                                                                                                                                              10.4%
                                150                                              CAGRs           140
                                                                                          134
                                                                          126    13.0%                                         13.1%
                                                                   115
                                                             107
                                                    95                           13.2%
                                100                                                                                                                                           0.7%
                                             84                                                                                2.4%
                                      68                                         11.5%

                                 50                                                                                                                                           -0.6%
                                                                                 14.5%                                         2.6%

                                                                                 13.9%                                         10.2%                                          2.7%
                                  0
                                      2011   2012   2013   2014    2015   2016            2017   2018   2019   2020   2021             2022   2023   2024     2025     2026

                                        Unbranded products                 OTC & others                  Non-original brands                  Original branded products
Source: IQVIA Market Prognosis, Sep 2021; IQVIA Institute Nov 2021
The Global Use of Medicines 2022: Outlook to 2026. Report by the IQVIA Institute for Human Data Science
                                                                                                                                                                                       34
Fueled by favorable policies since 2017, new launches of innovative
             medicines have rapidly increased
                   China Policies to Encourage
                                                                                                         Number of innovative drug approved            Launch lag between China and Global
Innovation

                        Drug Innovations
                                                                                                                                                                 Drug approved in 2016
                      2019 Drug Administration Law                                                            Local
             ✓                  Revision                                                                      MNC2                 55     54
                                                                                                                                                                             …
                                                                                                                                   10                  • Only 4 innovative drugs approved in 2016
                      Marketing Authorization Holder                                                                                      12     45
             ✓                   Reform                                                                                     41                                   Drug approved in 2019
                                                                                                                            1
                                                                                                                                                 19
                         Harmonizing with Global
             ✓        (ICH1, Multi-Country Trials, etc.)

                                                                                                                                   45     42
                               Review Acceleration,                                                                         40
             ✓                Green path Mechanism
                                                                                                                                                 26
                                                                                                                                                                             …
                                                                                                             7
                                                                                                                                                       • ~40   innovative drugs approved in 2019
                                                                                                             3                                         • Only 4.6 years launch lag, compared to
             ✓              CDE3 Capability Building                                                         4
                                                                                                                                                         8.4 years launch in 2016
                                                                                                         2016              2017   2018   2019   2020

             Source: IQVIA database, IQVIA analysis, desk research
             1. ICH: International Council for Harmonisation of Technical Requirements for Pharmaceuticals for Human Use
             2. MNC: Multi-National Company; 3. CDE: Center for Drug Evaluation                                                                                                                     35
Innovative drugs are increasingly gaining NRDL access, however, pressures
       on price-cuts to enter is continuing to increase
                                   Jul. 2017                 Aug. 2018                 Nov. 2019                  Dec. 2020                  Nov. 2021
NRDL

                                                                                                               751 formal review             273 Formal
       Negotiation                                                                                                    list                   review list
                                  44 Candidates              18 Candidates            150 Candidates
       candidates                                                                                        22%          162                       117
                                                                                                                   Candidates      43%       Candidates
       Succussed                       36                        17                        97
                                     Succeed           94%     Succeed          65%      Succeed                      96                        67
       exclusive drugs       82%                                                                                    Succeed                   Succeed
                                                                                                            59%                        57%

                                      MNC: 23                  MNC:15                   MNC: 50                   MNC: 39                 MNC: 26
       MNC vs Local
         (Exclusive drug)
                                     Local: 13                 Local: 2                 Local: 47                 Local: 57               Local: 41

                                                                                                                                   • 13 solid tumor
                                                                                                                                   • 2 hematology products
       Onco and RD          • 15 oncology drugs                                 • 7 oncology drugs       • 14 oncology drugs         and 4 blood cancer
                                                      • Oncology drugs only
        drug listing        • 2 rare-disease drugs                              • 6 rare-disease drugs   • 7 rare-disease drugs      drugs
          status                                                                                                                   • 4 immunology drugs
                                                                                                                                   • 7 rare-disease drugs

                                                                                                                   ~62%
                                       ~40%                     ~54%                     ~61%
                                                                                                            (66 western drugs)
         Price-cut            Local products: ~ 31%     Local products: ~ 33%    Local products: ~ 57%                                       ~62%
                                                                                                           Local products: ~ 61%
                              MNC products:~ 41%        MNC products:~ 56%       MNC products:~ 62%
                                                                                                           MNC products:~ 63%

 Source: Desktop research, IQVIA analysis
                                                                                                                                                             36
Timeframe from approval to NRDL listing have shortened significantly with
       increased pressure for price reductions

                                                             All NRDL negotiated                                                                 NRDL negotiated                                     Key takeaways
                                                                Western drugs                                                                    oncology drugs
NRDL

                                                                                                                            2017                  2018          2019          2020
                                                                  2019
                                                              25 out of 52
                                                                                             2020
                                                                                         43 out of 66                    4 out of 15          11 out of 17   7 out of 8   11 out of 13
                                                                                                                                                                                           •   Newly-launched drugs in recent
                                                                 (48%)                      (65%)                          (27%)                 (65%)         (88%)         (85%)             years have more reimbursement
          # of drugs included in                                                                                                                                                               opportunities to be included by
           NRDL within 2 years                                                                                                                                                                 negotiation
                after launch

                                                                                                                                7.3                                                        •   Time interval is sharply
                                                                                                                                                                                               shortened between launch and
                                                                  3.0                                                                                                                          NRDL listing than ever, indicating
                                                                                       1.5                                                            1.6       1.6           1.2
           Median time (years)                                                                                                                                                                 products must prepare in advance
          between approval and                               2019 (52       2020 (66                                          2017            2018            2019            2020             for entering market
             NRDL inclusion                                Western drugs) Western drugs)                                 Negotiation (15 Negotiation (17 Negotiation (8 Negotiation (13
                                                                                                                         oncology drugs) oncology drugs) oncology drugs) oncology drugs)

                                                                 57%                                                                                           59%                         •   Greater price cut is observed
                                                                                      51%                                                             53%
                                                                                                                               46%                                                             for newly listed innovative
                                                                                                                                                                             Not
                                                                                                                                                                          announced
                                                                                                                                                                                               drugs, especially oncology drugs,
             % of price cut after                                                                                                                                            yet               and the trend is expected to
               negotiations1                                 2019 (52       2020 (66                                        2017 (15        2018 (17        2019 (8         2020 (13           continue
                                                           Western drugs) Western drugs)                                 oncology drugs) oncology drugs) oncology drugs) oncology drugs)

       Note: 1. Price cut was calculated by comparing the reimbursement price negotiated against the lowest provincial bid price before negotiation
       Source: External Interview; IQVIA analysis                                                                                                                                                                                   37
Volume-Based Procurement (VBP) is the national tendering for off-patent
      drugs in China
                                        ▪     Volume Based Procurement (VBP) was first introduced in 2018, which kicked off national tendering on off-patent drug
                                              in China. 5 rounds national-wide by far, while this mechanism would become normalized and institutionalized
                                        ▪     Led by NHSA, VBP bid winners will have sales guarantee for the committed volume (~70% of total hospital market) at the
VBP

                                              negotiated price with a 2-year contract; while the remaining non-committed market (~30% of total hospital market) is still
                                              free-selection based
                                        ▪     Off-patent drugs with ≥ 2 generics 1) approved in China, 2) passed Generics Quality Equivalence Test (GQCE), are
                                              exposed to VBP risk
                     Key Facts on VBP                                                    VBP Mechanisms
          ▪      Six rounds of national-wide VBP organized by NHSA                                          • Originator and GQCE Gx in same competition group
                 with direct impact on off-patent originators since 2019              VBP bidding rules     • Lowest tender price will be set as bid ceiling price
                 - Average price cut level >50%, with highest at 99%                                        • Lowest price to win the bid
                 - Over 200 molecules involved contributing beyond
                     20% of total China market                                                              • Multiple winners to ensure national supply and share the 70%
                                                                                      Impact on winners       committed market volume by splitting provinces
          ▪      VBP price cut levels varies across molecules because of
                 competitiveness and COGS (Cost of Goods Sold).
                                                                                                         • The remaining 30% non-committed market is still free-selection
          ▪      Chemical drugs face with strong price cut, while
                 competition is milder in biologics, i.e., all insulins won         Impact on non-winner • ~30% price cut enforced on originators after VBP becomes
                                                                                                           effective
                 the bidding with average price cut at 41%

        Key findings:
        VBP is regarded as China version of patent cliff, as originator will still experience enforced price cut (~30%) even lose-bid.
        Early planning on patent and launch strategy in China is crucial to prolong product lifecycle

      Source: desk research, IQVIA analysis                                                                                                                                  38
The price drop required vs the lowest pre-VBP price to be stabilizing around
      ~ 60%, and the average # bidders per molecule continues to increase

                                                                                    4th Round   5th Round
VBP

                                                                                     -52%
                                                                                                  -56%

                                                                                     5.0            5.7

      Source: desktop research, IQVIA research and analysis, quantitative studies                           39
The Global Use
of Medicines 2022
J APAN O V E RV I E W

JANUARY 2022

Copyright © 2020 IQVIA. All rights reserved. IQVIA® is a registered trademark of IQVIA Inc.
in the United States and various other countries.
Japan                                                          Universal Healthcare coverage through                                                                                                    Healthcare Spend
                    Snapshot                                                       National Health Insurance (NHI) System                                                                                                     Share of GDP

    Elderly (aged 65 or older)                                                                                                     Life Expectancy
                                                                                                                                                                                                                                 10.9%
                                                                                                                                                         84.3                                                                  #5 Globally
    Share of Population                                                                  28.8%                                     #1 Globally
    #1 Globally (USA: 16.9% #29) 1                                                                                                 (USA: 78.9 yrs #29) 2 Years                                                              (USA: 16.8% #1) 4

                                                                                                                                                                             ⚫ Long-Life Medical Care System
                     Over 8,400 Hospitals 12.98 beds per 1,000 people                                                                                                        ⚫ Improved HP Resource Management
                     #1 Globally (USA: 2.87 beds per 1,000 people) 3                                                                                                         ⚫ Diagnosis Related Groups

                                                                                                                                                                             ⚫ Reduced Polypharmacy
                     Comprehensive Drug List with ~98% of Approved
                                                                                                                                                                             ⚫ Fixed Co-Payment Structure
                     Prescription Drugs in Japan on Reimbursement List                                                                                                       ⚫ Innovation-Based Pricing

⚫ Conditional Early Approval
⚫ Sakigake (Breakthrough Therapy)
                                                                                                                              Increased Patient Access to Leading Global Therapies
    Designation                                                                                                               36 of top 50 in 2010 increasing to 46 of top 50 in 2021 5

                    Clinical Trials in Japan                                                     20% in                   55% in                                                Japan                                  34 mths    16 mths in
                    included in Global Trials 6                                                   2010                     2020                                                 Drug Lag 5                             in 2010    last 3 Yrs
1: https://data.oecd.org/pop/elderly-population.htm ; 2: https://www.who.int/data/gho/data/indicators/indicator-details/GHO/life-expectancy-at-birth-(years) ; 3: https://www.who.int/data/gho/data/indicators/indicator-
details/GHO/hospital-beds-(per-10-000-population) ; 4: https://stats.oecd.org/Index.aspx?ThemeTreeId=9 ; 5: IQVIA MIDAS Quantum Sept 2021 MAT period ; 6: IQVIA Japan. Japan Thought Leadership analysis of                                     41
PMDA and other public data
Japan medicine spending is forecast to decline slightly through
      2026 as stronger innovation is offset by shift to annual price cuts
      Japan medicine spending by product type 2011–2026, constant US$ Billions

                                                                                                                                                             Forecast
100

                                                               5-Year                                                    5-Year                                                5-Year
                                           87       88         CAGRs           87                88                      CAGRs                                                 CAGRs
 90

                                  83                                                    86                86     85                       84     84     84       83
                         82                                                                                                                                             83
       80       80                                              1.8%                                                         -0.5%                                             -0.6%
 80

 70                                                             -0.2%                                                        0.1%                                              0.8%

 60

                                                                -5.9%                                                        -5.3%                                             0.4%
 50

                                                               14.3%                                                         7.8%                                              0.0%
 40

                                                               10.0%                                                         4.3%                                              1.1%
 30

                                                                -4.8%                                                        -7.6%                                             -12.1%
 20

 10
                                                                4.0%                                                         0.1%                                              0.8%

      2011     2012     2013     2014     2015     2016                       2017     2018     2019     2020   2021                     2022   2023    2024    2025    2026

                              Protected brands             Long-listed products              Generics           NHI others           Non-NHI products          OTC/others

      Source: IQVIA Market Prognosis, Sep 2021; IQVIA Japan, Sep 2021; IQVIA Institute, Nov 2021
      The Global Use of Medicines 2022: Outlook to 2026. Report by the IQVIA Institute for Human Data Science                                                                           42
While top-line spend remains flat, continued growth expected in
Japan from existing brands and contribution from new brands
Spending and growth drivers in Japan 2016–2026 Const US$Bn
                                                                                                          Forecast

  2016                                                                                     2021                        2026
 Spending                                                                                 Spending                   Spending

Source: IQVIA Market Prognosis, Sep 2021; IQVIA Institute, Nov 2021
The Global Use of Medicines 2022: Outlook to 2026. Report by the IQVIA Institute for Human Data Science
                                                                                                                                43
The Global Use
of Medicines 2022
L AT I N AM E R I C A O V E RV I E W

JANUARY 2022

Copyright © 2020 IQVIA. All rights reserved. IQVIA® is a registered trademark of IQVIA Inc.
in the United States and various other countries.
Medicine spending — using list price levels — is
expected to grow at 7-10% CAGR through 2026 to over $100bn
Latin America medicine market size and growth 2017–2026, const US$Bn

                                                                                                                                            Forecast
                                                                                                                                                              5-Year
     120                                                                                  5-Year                                                              CAGRs
                                                                                          CAGRs                                                               Overall
                                                                                                                                                       104
                                                                                          Overall                                                              8.0%
     100
                                                                                           8.3%                                                                3.3%
                                                                                                                                                               6.4%
      80                                                                                                                                                       8.9%
                                                                                70
                                                                                            4.1%                                                               10.5%
      60                                                                                    11.8%
                  52                                                                         8.6%                                                              6.9%
                                                                                             1.5%
      40
                                                                                             7.8%
                                                                                                                                                               9.2%
      20
                                                                                            11.7%

                2017           2018            2019           2020            2021                          2022       2023        2024   2025         2026

                                           Brazil      Mexico       Argentina        Colombia       Chile    Rest of the Region   Total

Source: IQVIA Market Prognosis, Sep 2021; IQVIA Institute, Nov 2021
                                                                                                                                                                        45
The Global Use of Medicines 2022: Outlook to 2026. Report by the IQVIA Institute for Human Data Science.
Spend growth drivers drug type / channel in LatAm
      Spend, funding and growth dynamics by drug type / channel in Latin America

                             Pharmacy Retail                                                   Pharmacy Retail                    Non Retail
                                  Channel                                                          Channel                         Channel
                           OTC / Consumer Health                                               Prescription Drugs              Prescription Drugs
     % of total
   drug spend
                                   ~20% of total spend                                         ~55% of total spend             ~25% of total spend

Drug funding                       Mostly Out of Pocket                                         Mostly Out of Pocket            Mostly Payer Funded
       model                       (limited payer funding)                                      (limited payer funding)       (public and private payers)

                               1.    Dermatology                                          1.    Cardiovascular            1.    Oncology
          Top 5
                               2.    VMS                                                  2.    Central Nervous System    2.    Antibiotics / fungals
       Therapy
                               3.    Analgesics                                           3.    Diabetes                  3.    Immunology
        Areas /
                               4.    Cough & Cold                                         4.    Women’s Health            4.    Central Nervous System
     Categories
                               5.    Anti-acids                                           5.    Antibiotics / fungals     5.    Vaccines

                               •    Post pandemic market                                  •    Ageing population          •    Innovation
                                    accomodation                                          •    Lifestyle habits           •    Post pandemic market
   Key Growth
                               •    Economic recovery                                     •    Mental health                   accomodation
       drivers
                               •    Prevention                                            •    Innovation                 •    Payer dynamics
                               •    Ageing population
                                                                                                                                                            46
Source: Source: IQVIA MIDAS and IQVIA LOCAL COUNTRY AUDITS
The Global Use of Medicines 2022: Outlook to 2026. Report by the IQVIA Institute for Human Data Science
Several initiatives aimed at broadening access while reducing cost
• Slow implementation of Insabi
• Move to centralize purchases under UNOPS
                                                               • Increased HC spending expected from new left-wing government
• Delays in sanitary registration given
                                                               • Slow progress in approving Rare Disease and Cancer legislations, as
  frequent changes in the commissioner
                                                                 well as SIS rollout
• Reduction in times at Cofepris for new
  molecules thanks to process optimization and
  equivalence agreements with other agencies                              • Increasing number of therapy areas and molecules
• National drug formulary changed to the                                    under direct control
  consolidated “Compendio Nacional”                                       • Potential changes in the INVIMA and IETS roles for
                                                                            approval, value-based pricing and funding of
                                                                            medicines
• For new medicines, request of forms for “Anexo                          • Presidential elections May 2022– healthcare likely to be
  5” to gain access to the National formulary                               a key point in candidate programs
• Consolidation of SERCOP process for
  purchases in the public sector                                                  • Tax reform may increase tax rates for medicines
• Slow progress in legislating the Organic Health                                 • IP protection remains strong despite recent legislation
  Code bill                                                                         (Article 40 and vaccines IP protection)
                                                                                  • Continued development and growth of private
                                                                                    sector, with potential expanded coverage (e.g.,
• Increased adoption of DRG in hospital setting                                     oncology, vaccines)
• Increased central procurement through CENABAST                                  • Digitalization of public sector through ConnectSUS
• “Ley de Fármacos II” which approved INN* prescription and
  labeling changes; price control mechanism still under              • Increase use of tenders in public sector
  discussion                                                         • Creation of “free” medicines list for PAMI patients
• Increased demand driven by Ley Ricarte Soto oncology, HIV,         • Widening price differentials between PAMI prices and list prices
  vaccines), “Cancer Law” and funding of high cost drugs
                                                                     • Lack of new innovative medicines included in PAMI
                                                                     • Delay in AGNET (HTA) implementation; high degree of
 Source: IQVIA Analysis
 *International Nonproprietary Name                                    rejection (75%) from CONETEC                                       47
Concluding thoughts

                      48
Download the full report and accompanying exhibits
www.IQVIAInstitute.org

Find us on social media

  Twitter: @IQVIA_Institute

  LinkedIn: #IQVIAInstitute

Join our mailing list

    iqviainstitute.org/subscribe

                                                     49
Thank you
You can also read