THE How the approaching sansdemic* will transform the labor market for the rest of our lives - NEW Digital Alliance
←
→
Page content transcription
If your browser does not render page correctly, please read the page content below

THE
             THE

How the approaching sansdemic*
 will transform the labor market
      for the rest of our lives

        * SA NS DEMI C :   sans-without, demic-people
THE DEMOGRAPHIC DROUGHT
How the approaching sansdemic will transform the
labor market for the rest of our lives

Written by

Ron Hetrick

Hannah Grieser            ©2021, Emsi, Moscow, ID. All rights reserved.

Rob Sentz                 Emsi is a leading provider of labor market data
                          to professionals in higher education, economic
                          development, workforce development, talent acquisition,
Clare Coffey
                          and site selection. Emsi data is used to solve a variety
                          of problems: align programs with regional needs,
Gwen Burrow               equip students with career visions, understand regional
                          economic and workforce activity, and find and hire the
                          right talent. Emsi serves clients across the US, UK, and
Design by                 Canada.

Daniel Botkin             www.economicmodeling.com

THE DEMOGRAPHIC DROUGHT                                                              2
Contents
Foreword

How We Respond to the Vanishing Workforce									4

Introduction

The Sansdemic Is Coming											5

Workforce past

           Chapter 1: Baby Boomers: The Rising Tide That Lifted All Boats						     7

Workforce present

           Chapter 2: The Remarkable Erosion of the Prime-Age Male Workforce					   13

Workforce future

           Chapter 3: Living Below 2.1										21

           Chapter 4: The Grim Implications of Living Below 2.1 							             27

           Chapter 5: Can We Find an Oasis in the Demographic Drought?						        33

Conclusion

Value People More											39

Glossary													40

THE DEMOGRAPHIC DROUGHT                                                                  3
FOREWORD

HOW WE RESPOND TO THE
VANISHING WORKFORCE

                     T   his research highlights one of the
                         most important issues in our lives:
                     living in a world where there are simply
                                                                 are companies investing in tools to make
                                                                 the workplace safe, there is an arms race
                                                                 of new IT systems, wellbeing offerings,
                     not enough workers to manage and            and culture programs to make companies
                     grow our companies. “Hire more people”      more enjoyable and rewarding, all
                     has long been an axiomatic first step to    with the goal of increasing tenure and
                     growth. How will we adapt when we can’t     retention.
                     take the “more people” part for granted??
                                                                 And perhaps the most inspiring change
                     Well, I speak with the leaders of big       is executives’ realization that people are
                     companies every day, and this issue is      not just an expense, but an asset that
                     on their minds. In fact, at company after   appreciates over time. Companies are
                     company I’ve heard the same thing:          raising wages, improving benefits, and
                     we need to rethink our entire strategy      increasing investment in development
                     because we simply cannot find the           and career growth—discovering that
                     people and skills we need.                  these investments pay off. We live in
                                                                 a world where more and more work is
                     Business leaders are hard at work           automated every day: the big lesson
                     developing these necessary new              of the sansdemic is that CEOs have to
                     strategies. Today, internal mobility,       take notice. If you aren’t investing in
                     reskilling, and job redeployment are        your people, your company won’t grow,
                     among the most important innovations        and this spur to investment is good for
                     at work. Companies are becoming very        business and individuals alike.
                     open to part-time workers, employees
                     who live and work remotely, and workers     Thank you to Emsi for this important
                     who need training to perform. In fact,      research. I hope it’s a wakeup call for
                     most companies are building their own       every business leader and policymaker
                     internal academies (Bank of America,        around the world.
                     Verizon, Ashley Furniture Industries) to
                     develop people from ever more diverse
                     backgrounds.                                Josh Bersin
                     To help retain valued people, the crusade   Global Industry Analyst
                     to improve employee experience is           www.joshbersin.com
                     growing by leaps and bounds. Not only

THE DEMOGRAPHIC DROUGHT                                                                                       4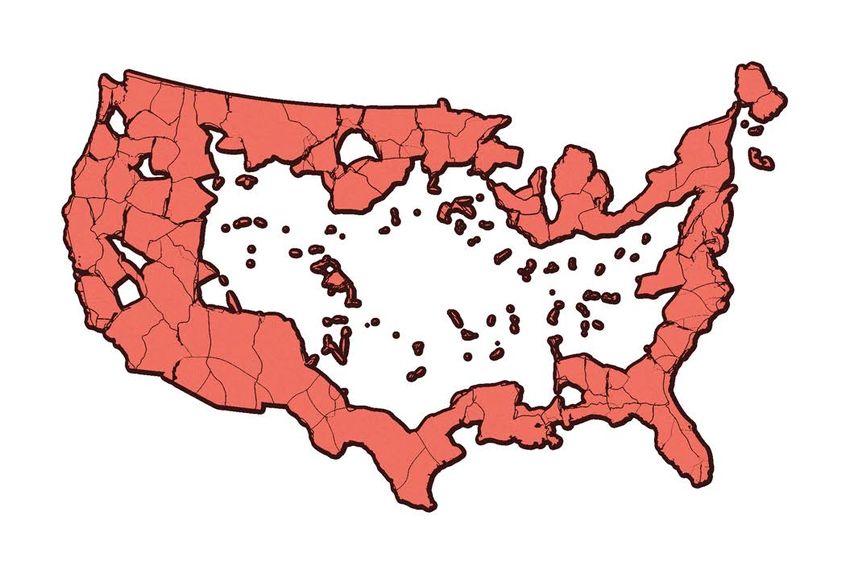
INTRODUCTION

THE SANSDEMIC
IS COMING
                     I n February 2020, before the COVID
                       crisis, a record 70% of US businesses
                     reported a talent shortage, according
                                                                    will send Americans rushing back to
                                                                    school in order to gain new knowledge
                                                                    and skills, but not so this time. Enrollment
                     to a Manpower survey. That was more            fell from 18.2 million students in 2019
                     than double the 32% of businesses who          to 17.8 million students in 2020, a loss
                     reported difficulty finding talent just five   of over 460,000 students, according to
                     years earlier in 2015. When COVID hit and      the National Student Clearinghouse.
                     unemployment spiked to record highs, all       Freshman enrollment in particular sank
                     talent shortages should have vanished.         an unprecedented 13%.

                     BUT THEY DIDN’T.                               WHAT’S GOING ON?
                     Today, the economy is suffering from           In the wake of such a chaotic year, it’d be
                     what some are calling the “COVID               easy to blame these disturbing trends
                     paradox”: millions of people out of            on COVID and resultant policies, but
                     work, millions of open jobs unfilled, and      that would be only partially accurate.
                     millions of people voluntarily bowing out      COVID didn’t create these problems, for
                     of the labor market. As of March 2021, 19      these problems existed well before last
                     million Americans filed for some form          year. The people shortage was already
                     of jobless benefits with a majority of the     coming. It was almost here. All 2020 did
                     claims specifically for pandemic relief        was act as an accelerant. Everything that
                     assistance. This despite a record number       happened last year, including the radical
                     of over 7M job openings.                       steps the US took to battle the virus,
                                                                    simply sped up the effects of a more
                     The fact is, the US labor force                nefarious and long-term problem largely
                     participation rate (LFPR), which measures      ignored by politicians and media alike:
                     people working or actively seeking work,
                     has dropped to lows we haven’t seen            The US is suffering the beginning phases
                     since the recession of the mid-1970s.          of a great sansdemic—“without people,”
                     Despite countless dislocations across the      or in our case “without enough people”—a
                     country, businesses frantically posting for    demographic drought that is projected to
                     jobs simply cannot find enough people          worsen throughout the century and will
                     to fill open positions.                        impact every business, college, and region.

                     Postsecondary enrollment has also              This is no COVID paradox. This is
                     tanked. Typically, economic upheaval           history catching up with us. We’ve been

THE DEMOGRAPHIC DROUGHT                                                                                       5
approaching the edge of this cliff for decades, as a growing          Regardless of what you think the ideal
crowd of researchers and writers have observed the past few           global population size might be, or
years:                                                                whether you think our biggest problem
                                                                      is too few people or too many, a sharp
•   Nathan Grawe discussed America’s shrinking population and         and sudden population reduction will
    its impact on higher ed in particular in Demographics and         have enormous implications for the
    the Demand for Higher Education (2018).                           economy and the lifestyle we all take for
                                                                      granted. The ability to order a package
•   Darrell Bricker and John Ibbitson wrote about the imminent        and see it in days, to buy a cup of coffee
    people shortage in Empty Planet (2019).                           on your way to work, to enjoy a wealth of
                                                                      affordable consumer goods, to have our
•   Brookings’ William Frey, who has written about demographic        garbage collected, to fill a prescription, to
    challenges for years, reported that the US just saw its slowest   receive nursing care—all these functions
    population growth in history.                                     depend on an army of workers that
                                                                      simply cannot be replaced if they were
•   In recent weeks Tyler Cowen touched on the same issues            never born.
    in Bloomberg, observing that America’s fertility rates have
    fallen below replacement rates.                                   To explore the causes and features of the
                                                                      coming sansdemic, as well as to consider
•   Ross Douthat, a frequent writer on the declining American         ways that you can survive or even thrive
    birth rate in The New York Times, suggests that, unless           throughout—read on.
    we find a solution, we will soon be living in a world that
    resembles nothing more than “just a rich museum.”                 »Note: Discussion of complex
                                                                      demographic realities inevitably involves
In this ebook, our goal is to draw more attention to this             technical jargon. For definitions of and
                                                                      differences between key terms, such as
trend and help you better understand the three pre-existing
                                                                      “birth rate” vs. “total fertility rate,” please
conditions both revealed and exacerbated by 2020:                     refer to the appended glossary.

•   The mass exodus of baby boomers (workforce past) - Last
    year, the number of baby-boomer retirees increased by
    over a million. The largest generation in US history remains
    a powerful cohort of key workers that still hold millions of
    roles. Their sudden departure from the labor force will gut
    the economy of crucial positions and decades of experience
    that will be hard to fill en masse.

•   Record-low labor force participation rate (LFPR) of prime-
    age Americans (workforce present) - Thousands of
    Americans have voluntarily opted out of looking for work.
    The children and grandchildren of baby boomers are not
    replacing the boomers who leave the workforce.

•   The lowest birth rates in US history (workforce future) - The
    national birth rate, already in decline, hit a 35-year low in
    2019, and the relative size of the working-age population has
    been shrinking since 2008. In fact, the national population is
    projected to begin shrinking by 2062. This means that over
    the next generation, talent shortages will only compound.

THE DEMOGRAPHIC DROUGHT                                                                                                 6
CH 1.

WORKFORCE PAST

Baby Boomers: The Rising Tide
That Lifted All Boats
TAKEAWAYS

»In normal years, 2         »Boomers are an             »The gap the boomers        »Boomers are retiring
million baby boomers        enormous cohort of 76       leave can’t be entirely     with an average $1.2
retire. But in 2020, over   million Americans born      filled, because around      million household net
3 million retired. COVID    between 1946 and 1964.      1970, the total fertility   worth, making them the
and related policies        They powerfully shaped      rate dipped below 2.1.      richest generation in
drove an additional 1.1     every institution they      While boomers were          American history. This
million people from the     touched, but they are       born into families with     accumulated wealth
labor market, according     leaving the labor market    an average of four          may further reduce the
to Pew Research Center.     they built and defined in   children each, boomers      labor participation of the
                            droves.                     themselves had an           already sub-replacement
                                                        average of fewer than       workforce poised to
                                                        two children and did not    succeed the baby
                                                        replace themselves.         boomers.

THE DEMOGRAPHIC DROUGHT                                                                                      7
The baby boom shaped our view of the                                         Today we know that this is not the case, as we shall

future of the world’s population                                             see. But first, let’s look at the effect of boomers on
                                                                             the labor force and hiring norms.
To understand the coming sansdemic, we need to
first understand the legacy of the baby boomers. As
their generational nickname suggests, boomers—                               Boomers were a labor force explosion
the generation born between 1946 and 1964—are
the product of the enormous surge in births after                            that powerfully shaped hiring norms
World War II. After falling steadily through the Great                       The population explosion meant tremendous
Depression, the US birthrate swung upwards, and                              growth in the labor force, growth whose benefits
peaked at nearly 27 births per 1,000 people in 1949.                         we’ve enjoyed since the 1970s. And because
                                                                             women began entering the workforce in much
In the years following the baby boom, exponential                            higher numbers than in any time since World War
global population growth seemed inevitable for the                           II, the workforce and consequent productivity gain
foreseeable future. Not only were people having a                            was twofold.
lot of babies, but, thanks to advances in medicine,
nutrition, and living conditions, these babies                               From when the data was first collected in 1948
were now surviving infancy in greater and greater                            to the late 60s, the LFPR for women over age 25
numbers. Those same advances that reduced infant                             jumped from 30% to 40%. Once the first female
mortality also helped raise adult life expectancy to                         boomers entered the workforce in the early 1970s,
historic highs.                                                              their LFPR shot up even more, hitting 60% by the
                                                                             mid 90s.
The combination of fertility and longevity has pushed
the global population toward nearly 8 billion as of                          This was a powerful combination: an enormous
2020. That number is expected to swell to nearly 10                          population of boomers and extraordinary growth in
billion by 2050. The baby boom shaped our view                               female participation. The US labor force swelled to
of the future of the world’s population, particularly                        unparalleled levels. The workforce gained a massive
the possibility of overpopulation. For years, people                         generation, then nearly doubled it as women joined
naturally assumed that baby booms would be a                                 the men.
continuous and exponential growth driver.

US birth rates (births per 1,000 population)

35
                                                           Baby boom
30

25

20

15

10

5

0
     1909      1919          1929          1939          1949         1959          1969          1979          1989        1999   2009

Source: National Center for Health Statistics, 2005; Martin et al., 2012; Martin et al., 2013; Hamilton and Sutton, 2013.

THE DEMOGRAPHIC DROUGHT                                                                                                                   8
One of the most powerful ways boomers        Labor force participation rate 1947-2012 and projected 2022
shaped the American economy was
their effect on hiring norms. Boomers        68%

provided firms with an abundance             66%
of labor power. Not only were there
                                             64%
simply a lot of boomers, there were a
lot of educated boomers, with college        62%
attendance soaring as boomers reached                                                                          projected
                                             60%
college age in the 1960s and 70s. And, as
80s satires of the upwardly mobile yuppie    58%
pointed out, these educated, plentiful
                                             56%
workers were highly motivated to build
wealth and move up the career ladder.        54%

                                             52%
Rather than the model of the “company          1947 1952 1957 1962 1967 1972 1977 1982 1987 1992 1997 2002 2007 2012 2017
man”—defined by internal promotion, on-      Source: U.S. Bureau of Labor Statistics.
the-job training, and a workforce identity
shaped by membership in a particular
firm—the open market became the norm.
Workers identified themselves by their       Female LFPR jumped up to 60% by the mid 1990s
profession rather than their company: the
“GE man” became an “IT manager with          60%

over 15 years of experience.”
                                             50%

As boomers moved around in search of
                                             40%
opportunities afforded by the booming
economy, talent became abundant
                                             30%
and affordable. On the open market,
companies could shop for ready-made
workers: the most qualified applicant,       20%

the most experienced veteran of a given
                                             10%
role. Workers were the commodity, and
companies could afford to be choosy,
                                             0%
hiring from other companies with                     1900         1920        1940      1960        1980       2000
talented individuals who were ready
                                             Source: Our World in Data based on OECD (2017) and Long (1958)
for a change, or from any number of
specialized programs that had emerged
since the 1980s. Such programs were
built to educate college students for        even more, creating wider and wider recruiting networks,
particular roles, and churned out workers    which massively benefited companies and individuals alike.
at regular and reliable rates.               Companies could post jobs and see lots of applicants. People
                                             could constantly search for new or better paying jobs. They
Less attached to a company than to a         could play the field and act as free agents. Wages and salaries
profession, and with a healthy economy       grew. The baby boomer generation, and the firms they started
affording them lots of opportunities,        and worked for, flourished.
boomers marketed themselves to
companies. The advent of internet            These conditions created deeply entrenched norms in
job postings opened up the market            workforce preparation and talent acquisition. And these norms

THE DEMOGRAPHIC DROUGHT                                                                                                     9
were perfectly reasonable while said conditions                      workforce for community and culture, those incentives
were maintained. But these conditions won’t last                     have largely been cut off). Further, many boomers were
forever. For many industries, they’re already gone.                  surely worried about catching the virus and opted to
                                                                     stop out.

Boomers are exiting the labor force                                  And given boomers’ high net worth and decreased
                                                                     need to punch the clock, they have wide latitude
faster than ever                                                     in their career decisions. Yes, many boomers were
We’re still living in the world of work created by                   pushed out of the labor force due to job loss. But to
the boomers, but boomers are no longer its core                      many more, now probably seems as good a time to
participants. As of 2016, millennials became the                     retire as any.
single largest group in the labor force—a group that
is showing radically different attitudes toward work,                This alone is likely having a far greater impact on
which presents distinct challenges we’ll discuss in                  the labor market than is being reported. Why?
Part 2.                                                              Boomers are often vacating higher level and
                                                                     highly valued positions in their companies. Many
According to Pew Research Center some 2 million                      boomers helped build those companies, hold senior
baby boomers retire each year. In 2020, this number                  positions, and, most importantly, have many years
appears to have grown to an historic high: over 3                    of accumulated knowledge and experience, which
million decided to end their careers.                                will be tremendously difficult to transfer over to
                                                                     younger workers. As companies attempt to replace
Much of this is likely related to the fact that over the             these boomers, they will be greeted with a massive
past year, work has become significantly more remote                 challenge.
(people aren’t allowed to work near their colleagues),
exhausting (it’s hard to put in hours of Zoom calls
every day), and isolated (if people were staying in the

Millennials became the largest generation in the labor force in 2016

Note: Labor force includes
those ages 16 and older who
                                   U.S. Labor force, in millions
are working or looking for work.   70M

Annual averages shown.                            66                                       Boomers
                                   60M
                                                                                                                                    56
                                   50M                                                       54                                     53
                                                                     Gen Xers
                                   40M                                                                                                  41
                                                                                 Millennials
                                   30M
                                                   Silent/Greatest
                                   20M

                                   10M
                                                                                                                                    9
                                                                        Post-Millennials
                                   0                                                                                                3
                                       1994      1997        2000               2005        2008    2010                  2015   2017
                                   Source: Pew Research Center analysis of monthly 1994-2017 Current Population Survey.

THE DEMOGRAPHIC DROUGHT                                                                                                                 10
Boomers aren’t being replaced Industrious boomers generated
2020 sped up an inevitable process: the accelerated
incredible amounts of wealth—which
exit of baby boomers from the economy they their children stand to inherit
created is being compounded by the fact that
boomers are not being replaced. We turn now to another major impact of the
boomers: wealth. The work of 76 million boomers
For the US population to reproduce itself—-meaning, generated incredible economic prosperity. This
for current population numbers to stay the same— was partly because there were so many of them,
the total fertility rate (TFR) needs to equal 2.1 children including, as we saw earlier, tens of millions of
per 1 woman. When the TFR stays at or near 2.1, one women.
child is born to replace every person now living
(with the .1 allowing for cases of early mortality). In This tsunami of workers generated pots of wealth,
other words, the population doesn’t grow, but it is as we can see with the national GDP. In the 28-year
at least replaced. Yet, with a few annual exceptions, period from 1947 to 1975, real GDP nearly tripled
America’s TFR has been far below 2.1 since 1971. from $2 trillion to roughly $5.6 trillion. But once the
boomer generation kicked in with two people per
This means that there aren’t enough millennials family unit generating two household incomes,
and Gen Zers to fill boomers’ shoes. Boomers the next 28 year period saw real GDP nearly tripled
spent more time on career and income, and less again from $5.6 trillion to $14.5 trillion—2.5 times
on reproducing themselves. While boomers were the increase of the previous period. By the time
born into families with an average of four children boomers first started retiring in 2009, GDP had hit a
each, boomers themselves had an average of just spectacular $15.3 trillion.
1.8 children. Thus, as they leave the workforce, there
simply aren’t enough workers to replace them. How did this growth affect regular families? Median
family income grew modestly from $5K to $14K
We’ll discuss this problem further in Chapter 3. between 1955 and 1975. It then soared to $56K (a
stunning $42K increase) in the next 20-year period
ending in 1995. In other words, as boomers (many
of them dual-income earners) hustled industriously
The number of retired Baby Boomers rose more from 2019 to through their prime earning years, median family
2020 than in prior years income grew five times as much as it did in the
previous 20 years.
Annual increase in Boomer retirements +3.2M
+2.5M
+2.2M +2.2M +2.2M
+1.9M +2.0M +1.9M
+1.5M
2012 2013 2014 2015 2016 2017 2018 2019 2020
Source: Pew Research Center analysis of July, August and
September Current Population Survey monthly files (IPUMS)
THE DEMOGRAPHIC DROUGHT 11Historical Median Income Using Alternative Price Indices: 1967 to 2019
$70K
Historical median income
using alternative price
$60K indices: 1967 to 2019
Current method Median family income
C-CPI-U
adjusted for inflation.
+ Current
2019 dollars
$50K
method Even with the setback
(prior to of the recession, the
C-CPI-U + PCEPI
2000) (prior to 2000) pattern of growth has
$40K
mostly ranged from
steady and sustained to
sharp and steep.
$30K
1959 1965 1970 1975 1980 1985 1990 1995 2000 2005 2010 2015 2019
Source: US Census Bureau, Current Population Survey, 1968-2020 Annual Social and
Economic Supplements (CPS ASEC)
The result is an enormous amount of wealth. The tide is going out
As of today, the average net worth for a boomer These enormously blessed children of the baby
household is $1.2 million, making it the wealthiest boomers—Gen Xers and millennials—would normally
generation in the history of the world. We don’t replace their parents in the labor force...if there were
mean to suggest that every single individual in this enough of them, but as we’ve seen, there aren’t.
cohort has made this much. But broadly speaking,
this generation has amassed a lot of wealth. The recent history of our labor force amounts to a
slow-moving tide. After decades of high tide, we’ve
The combination of significant wealth with low become accustomed to it. But the tide is going
birthrates may mean that a major transfer of wealth out. The exit of boomers from the workforce is not
is on the horizon. With fewer offspring to divide up staggered, but en masse, and it’s already leaving
an inheritance, the children of highly educated, high- companies scrambling to fill people gaps. When
earning baby boomers can expect to receive that the tide fully recedes, the productivity losses will
average $1.2 million more or less intact when their be extreme. The Economic Policy Institute projects
parents die. that by 2030, a middle class family’s after-healthcare
income will be down by 14%. Meanwhile, the World
What are the consequences of such wealth? We will Economic Forum estimates people spend over 37%
consider one particularly unfavorable consequence less in retirement. A decrease in aggregate demand
in Chapter 2. coupled with a labor supply shortage amounts to a
dire prediction for GDP.
In the next chapter, we’ll discuss another reason the
children of baby boomers aren’t filling their parents’
shoes: lack of motivation and a shift in career ideals
and work ethic, resulting in record-low LFPR among
prime-age men in particular.
THE DEMOGRAPHIC DROUGHT 12CH 2.
WORKFORCE PRESENT
The Remarkable Erosion of the
Prime-Age Male Workforce
TAKEAWAYS
»2.4 million women left the workforce from February »The opioid epidemic is a major culprit in siphoning
2020 to February 2021—a development that has prime-age men off the labor force. In 2015 alone, a
overshadowed another mass exodus. Men have been staggering 860,000 prime-age men were absent
disappearing since the 1980s. from the labor force due to opioids.
»The prime-age male workforce (ages 25-54) plunged »In 2014, for the first time since 1880, more men 25-34
from 94% in 1980 to 89% in 2019. That 5 percentage- years old were living with their parents than with a
point drop represents over 3 million missing workers spouse.
when compared to the 94% participation rate. When
compared to a hypothetical 100% rate, it represents
nearly 7 million. »Males increasingly prefer part-time over full-time
work. The number of prime-age men willingly opting
»Millennials are expected to inherit an estimated $68 for a part-time job jumped from 6 million in 2007 to
trillion from their boomer parents by 2030, making nearly 8 million in 2019.
them the wealthiest generation in history. The wealth
created by boomers in general has made millennials
less motivated to seek careers of their own.Meet the Millennials Male workers: AWOL since 1980
A revolving door began spinning on the workforce
in the 1980s: women in, men out—especially in the
Introduction generations following the baby boomers.
In the last chapter, we considered the enormous size In 1980, the prime age male workforce (ages 25-54)
of the baby boomer generation and the fantastic made up 38% of the workforce. But by the fourth
wealth they created. In this chapter, we will consider quarter of 2019, nearly 40 years later, that same
what happened when the subsequent generations prime age male workforce had dropped to just 34%
(Gen Y, millennials in particular) were neither of the workforce.
numerous nor motivated to replace boomers in the
labor force. The chart below illustrates the drastic decline in the
LFPR for prime-age men. The dip in male LFPR was
already underway in the 1970s. Then between 1980
2.4 million women left the workforce and 2019, it jumped off a cliff. In 1980, the LFPR for
prime-age men was right around 94%. By 2019, it had
in one year plummeted to 89%. This drop represents roughly 2.6
First, let’s consider an alarming phenomenon that million prime-age men no longer actively working or
is making headlines and turning heads: women are searching for a job.
leaving the workforce by the millions.
Back in January 2020, women were in a slim majority Prime-age male labor force participation rate plummeted
for the second time in US history, accounting for from 94% in 1980 to 89% in 2019
just over 50% (50.04%) of the national workforce.
But COVID has changed all that. From February
95%
2020 to February 2021, 2.4 million women separated
from the labor force, compared to 1.8 million men—a
difference of 600,000. In January 2021 alone, 92.5%
275,000 women left the workforce, compared to
71,000 men.
90%
A primary cause behind this widespread retreat is
that several major industries employing a majority 87.5%
of women—service, retail, travel & tourism—were
also the first to be shut down or obliged to curtail 1970 1975 1980 1985 1990 1995 2000 2005 2010 2015 2020
business during COVID. Other reasons include Source: BLS Current Population Survey.
pure necessity (women leaving to take care of their
families once schools pivoted to distance learning) Of course, men naturally made up a shrinking
or burnout (women exhausted from juggling both percentage of the total workforce as women
families and work). flooded the ranks starting in the 1950s, but the
trend we’re observing here isn’t a matter of men
The loss of women from the labor market is comprising a smaller slice of the pie. This is a matter
indeed shaping up to be a dire trend. But even of men opting out of the pie. Gen X, millennial, and
more disturbing is a stealthier long-term trend Gen Z men increasingly don’t work, period. And yes,
that has been missing from much of the national the decline of the overall number of males in the
conversation for the past 40 years: where have all the workforce since 1980 is somewhat due to the fact
men gone? that male boomers have moved into the next age
THE DEMOGRAPHIC DROUGHT 14bracket. However, this doesn’t change the fact that The question is, why?
the overall participation of prime-age men is tanking. We will consider three primary reasons:
Here’s a grim angle on the same problem. The last • Boomer wealth and delayed responsibility
male group to grow in the labor force was baby
boomers. In the chart below, note how male LFPR • Opioid epidemic
catapults as boomer men enter the market from 1970s
to 2000, but stagnates as boomers begin to retire. • Fundamental attitude shift away from full-time
work and towards part-time work (and video
games)
Baby boomer men were the last male group to grow in the
labor force
The impact of boomer wealth: delayed
As boomers began exiting the labor market, the total
number of prime-age men in the workforce did not responsibility
As we saw in Chapter 1, the work ethic of 76 million
Boomer entrance
baby boomers begat incredible economic wealth.
On top of being part of an enormous labor force, the
50K majority of married boomers were also dual-earner
Boomer exit
couples. This meant two people generating two
household incomes for the same family. By 1995, the
40K
large female boomer population was 33-49 years
old (prime working years) and, combined with their
husbands’ incomes, earning the largest increases
in household income in the recorded history of the
30K
1970 1975 1980 1985 1990 1995 2000 2005 2010 2015 2020
world.
Source: BLS Current Population Survey.
WHAT WAS THE IMPACT OF ALL THIS WEALTH ON THE
grow at all for 16 years, from 2004 to 2020. However,
CHILDREN OF BOOMERS?
the number of prime-age men not in the labor force
swelled by an astonishing 70%. What this means Let’s back up a minute to get the big picture.
is that even though millennials in particular now The maximum earning years for households are
outnumber living baby boomers, more and more between ages 45 and 54. For boomers, this would
millennial men are, for one reason or another, opting have spanned the years of 1991 to 2018 with the
out of work. peak occurring somewhere between 2002 to 2007.
Boomers’ children would have been in their early 20s
to mid 30s in that time frame.
What this means is that as boomer parents
flourished in their peak earnings years, their adult
children did not technically need to work in order to
ease the drain on the household. The dual-income-
earning parents were already making enough
money. In fact, millennials are expected to inherit
an estimated $68 trillion from their boomer parents
by 2030, which will make them the wealthiest
generation in history.
THE DEMOGRAPHIC DROUGHT 15One of the blessings of such wealth is also a curse: old as of 2020, while the median age soared from 31
the easy slip into delayed responsibility. A full 13% of years old in 1980 to age 47.
millennials did not get their first job until they were
over 20 (with men having a higher average age than Sidenote: A common explanation for millennials’
women), compared to just 8.9% of Gen X and 6.3% delay in buying a first home is the $1.7 trillion in
of boomers. The LFPR for men ages 25-34, already student loan debt shared by approximately 44.7
in slow decline as boomers began aging out, took a million borrowers. Debt is indeed a ball and chain
shocking dive as millennial males entered that age for many young Americans (and let’s not forget
group. The LFPR went from 93% around 2007 to 88% that the median inflation-adjusted price of homes
in 2014: ballooned by 39% between 1970 and 2019). But the
fact remains: the LFPR itself for millennial men is
plunging.
LFPR for males ages 25-34 tanked as soon as millennials hit
those ages With male LFPR declining so drastically, college
debt and home prices alone cannot be blamed as
the only villains forcing millennial men to postpone
95% First millennial buying a home.
men enter this
age group The truth remains: men today aren’t working as
92.5% much as their boomer parents.
The opioid epidemic is stealing prime-
90%
87.5%
age men from the market
Another factor stealing men away from the labor
1970 1975 1980 1985 1990 1995 2000 2005 2010 2015 2020 market over the past two decades is prescription
Source: BLS Current Population Survey. opioid abuse. Opioids are used by many for
legitimate pain management, but the US has been
The abundance of boomer wealth also moderated overrun with addiction, as evidenced by the fact
the need and motivation for millennials to move that some 90 Americans die every day from opioid
out of the nest. In 2014, for the first time since 1880, overdose. It is manifestly impossible to sort between
more men 25-34 years old were living with their abusers and legitimate users in the statistics below;
parents than with a spouse. For 25–29-year-olds, that nevertheless, considering that nearly 30% of patients
percentage was an astounding 25%. misuse their prescriptions, we can use the following
numbers to conclude that opioid abuse is a major
When thousands of men don’t get a job or leave culprit in siphoning men off the labor force.
Mom and Dad’s, the shockwaves are personal, not
just national or economic. Men who delay getting The opioid conflagration began around the turn
a job also delay critical life milestones such as of the millennium. From 1999 to 2010, US sales
marriage, children, and home-ownership. According of opioid painkillers quadrupled. In fact, in 2012,
to the Census Bureau, the average age of marriage there were enough opioid prescriptions for every
for men has moved from 23 years old in 1960 to 30 single American adult to have their own bottle of
years old in 2019. As for having kids, the vast majority pills, according to the Centers for Disease Control
of men are postponing children to their 30s with the and Prevention. And as the use of painkillers
average of first time fathers hitting 31, up from 27 in skyrocketed, the misuse was not far behind. In 2019,
the early 1970s. The average age to purchase a first an estimated 9.7 million Americans age 12 or older
home went from 28 in the 70s and 80s to 34 years misused prescription painkillers.
THE DEMOGRAPHIC DROUGHT 16The consequences of opioid abuse aren’t just towards part-time work, and the huge increase in
hospitalizations and tragic deaths, but also a huge hours spent playing video games.
decline in labor force participation—particularly
among prime-age men. In an extensive 2019
MILLENNIALS WANT LESS FULL-TIME WORK, MORE PART-
study, researchers Dionissi Aliprantis and Mark E.
TIME WORK
Schweitzer discovered a strong link between opioid
prescription rate and labor force participation for A notable trend in the past decade (2009-2020) is
both men and women. the flight of prime-age men to part-time work.
For prime-age men in particular, a 10% higher
prescription rate in a particular region was The 2008 housing crisis pushed prime-age men from full-time
associated with a 0.15-0.45% decrease in the work into part-time work
LFPR. In fact, the study estimated that in certain
US counties, solving the opioid epidemic would Prime age men in part-time jobs, by year
4,000
increase the LFPR for prime-age males by over 4
percentage points.
Further, a 2018 study by the American Action Forum 3,000
discovered that the spike in opioid use between
1999 and 2015 (256% increase per capita) caused
the national LFPR for prime-age men to drop by 1.4
2,000
percentage points. This accounts for a full 40% of
the decline in LFPR for prime-age men during the
1991 1994 1997 2000 2003 2006 2009 2012 2015 2018
same time frame. In raw numbers, this decline means
Source: BLS Current Population Survey.
that in 2015 alone, a staggering 860,000 prime-
age men were absent from the labor force due to
opioids. One of the initial reasons that significant numbers
of men moved into part-time work around 2009 was
that they were forced to. The Great Recession of
ATTITUDE SHIFT: PART-TIME WORK & VIDEO GAMES
2008 erased 4.5 million largely full-time jobs from
Much has been written in defense of millennials’ the male-dominant construction and manufacturing
work ethic, their desire for work-life balance, industries. Many of the only available jobs were in
their preference for a clear career path, their love restaurants or retail establishments, where average
for flexible schedules, and even their sense of weekly hours are typically part-time even in a healthy
entitlement. But here, we want to focus on the economy. Thus, huge numbers of prime-age men
connection between boomer wealth and the low opted for these 20- to 30-hr/week jobs simply
LFPR in millennial men in particular. because there was nothing else at the time.
With boomers’ wealth creating an affluent life for The problem is that even as the US recovered from
large numbers of the following generation, their the recession and unemployment rates sank to
children’s attitude towards work naturally shifted. It their lowest levels in 50 years, prime-age men didn’t
would have been highly difficult to resist. Enabled race to return to full-time work. As the following
by significant wealth, millennials could afford not to chart demonstrates, the number of prime-age men
work—or to work significantly less than their parents. willingly opting for a part-time job jumped from 6
We will examine this attitude shift for prime-age million in 2007 to nearly 8 million in 2019.
men in two areas: the drift away from full-time work
THE DEMOGRAPHIC DROUGHT 17Men: part-time by reason
Economic Reasons Non-Economic Reasons
8K
7K
6K
5K
4K
3K
2K
1K
0
2007 2008 2009 2010 2011 2012 2013 2014 2015 2016 2017 2018 2019 2020 2021
Source: BLS, CPS, unpublished data, 2021
This was particularly prevalent in the 21- to 30-year-
old male age group which, by 2015, was working 12% Conclusion
fewer hours on average than it had been in 2000. A
shocking 15% of these men had not worked a single For practical ways to encourage not only prime-age
week in 2014. men but workers in general to rejoin or remain in
the labor force, see our suggestions in Chapter 5. In
this next chapter, we will consider an even bigger
BOTH MILLENNIALS AND GENERATION Z LOVE
problem than the declining LFPR of prime-age
THEIR VIDEO GAMES
males: the imminent shrinking of the US population.
Why the dramatic shift to part-time work,
even during a time defined by prosperity and
opportunity? One short and surprising answer is our
second topic: video games. Yes, really.
According to NBER research, the decrease in hours
worked for men ages 21-30 exactly mirrored the
increase in video game hours played. On average,
males ages 21-30 worked over 200 fewer hours in
2015 than they did in 2000 (a 12% decline). They
simultaneously upped their leisure hours, 75% of which
were spent playing video and computer games. Many
of these men do not have a bachelor’s degree, and the
data shows they are postponing marriage, child rearing
and home buying until their 30s.
THE DEMOGRAPHIC DROUGHT 18I n the maps below, we highlight some of the dramatic changes that have occurred over the last two decades, both in the population of working-age adults, and in the population of children under fifteen. Overall, the maps show historic population centers–the coasts especially–losing young people, while the Mountain West, Southwest, and some parts of the South and Midwest make relative gains. And in just the last ten years, losses of working-age population across the board have accelerated dramatically. Percent change in working-age population by county between 2001 and 2011 Notice how the worst losses are relatively localized to the Midwest and South. Almost every county on both coasts saw working-age population growth: between 2001 and 2011, rural areas were becoming increasingly elderly, while young people concentrated in prosperous urban centers. Most counties in Western states also saw their working-age population grow, although some counties in Oregon, Idaho, and Nevada suffered losses. Texas, one of the largest states in terms of overall population, was a mixed bag, with some counties losing working population and some counties gaining. Source: Emsi labor market analytics Percent change in working-age population by county between 2011 and 2021 Note the stark contrast with the same map from only a decade earlier. Losses that were regionally concentrated have become nearly universal in the intervening 10 years. Economically powerful coastal regions suffered much more than they did in the previous ten years. In fact, California’s coast is an almost completely unbroken stretch of working-age population loss. Interestingly, Florida, long considered by many a retiree colony, is an exception to these coastal patterns. Florida, especially in the southern part of the state, saw many of its counties gain working-age population. Texas and North Carolina also saw pockets of growth, but the largest areas with growing pools of working-age people were out west: counties in Washington, Oregon, Idaho, Utah, and Nevada. If the story of 2001- 2011 was the hollowing out of America’s heartland, 2011-2021 saw America’s traditional hubs of economic and tech power lose young people in droves. Source: Emsi labor market analytics
Percent change by county in the under-15 population between 2001 and 2011

Only parts of the Mountain West
and Southwest show significant
unbroken stretches of growth.
While working-age population
was relatively stable in many
counties during this time frame,
the share of children under 15 was
dropping rapidly all across the
country. In this map, you can see
the workforce losses coming 10
years down the line: a lack of children
under 15 means the same lack of young
working adults 10 years later.

East of the Rockies, growth tends to occur in
pockets rather than wide swathes, as it does in the West
and Southwest. Still, there are exceptions to the overall pattern
of declining childhood population in the East: Florida, Oklahoma,
Texas, North Carolina, and Pennsylvania all have counties where
the percentage of children is growing, rather than shrinking.

Source: Emsi labor market analytics

Percent change by county in the under-15 population between 2011 and 2021

In the last decade, the West and
Southwest have lost a large part
of their advantage, while the
upper midwest has made gains.
However, the pockets of growth
on the East Coast and the South
have mostly shrunk—with the
exception of Texas and Florida,
notable outliers. If the overall
share of children as a percentage
of the population continues to
drop over the next 10 years, the
ability of these outliers in the West,
South, and Mid-West to retain their
growth trajectories will be an important
issue. Communities that can maintain and grow
a population of young people may enjoy a new kind of
competitive advantage.

Source: Emsi labor market analytics
CH 3.

WORKFORCE FUTURE   TAKEAWAYS

Living Below 2.1
                   »Since 1971 the fertility rate in America has been
                   below the replacement level of 2.1 births per woman,
                   which means millions of Americans will be absent
                   first from the classroom and then from the labor
                   market—because they were never born.

                   »US population growth has slowed and is projected
                   to begin shrinking by 2062.

                   »The combination of low fertility, low workforce
                   participation, and longer lifespans means two-thirds
                   of the US population could be financially dependent
                   on the remaining one-third by the year 2100.
S o far, we’ve considered the current
talent shortage from two angles.
We’ve covered the baby boom, which
As we’ve seen, low labor force
participation is part of our talent shortage
problem. But a bigger demographic trend
created a highly prosperous economy, is driving shortages as well.
but we’ve also seen that the following
generations have been neither numerous
nor motivated enough to replace US population growth by decade: 1790 to 2020
boomers as they retire. Both of these (estimated) censuses
factors have contributed to (and will
continue to impact) America’s struggle to
find enough people to fill open jobs. 40%
35%
30%
This leads us to our third and most
25%
sobering angle: the declining workforce
20%
of America’s future. In this chapter, we
15%
consider the exact nature of this imminent
10% 6.6%
people shortage in the US and the 50-year
5%
history of America’s baby bust.
0%
1990-2000
2000-2010
2010-2020
1890-1900
1880-1890
1790-1800
1980-1990
1830-1840
1840-1850
1850-1860
1870-1880
1860-1870
1950-1960
1970-1980
1930-1940
1940-1950
1960-1970
1820-1830
1920-1930
1800-1810
1900-1910
1810-1820
1910-1920
A 6-million worker deficit will
lower living standards for *April 1 2020 population is calculated by pro-rating
everyone the annual growth rate from July 1, 2019 to July 1,
2020 through April 1, 2020.
In early 2018, Korn Ferry predicted that
by 2028, the US can expect to see a Source: William H. Frey analysis of US decennial
deficit of 6 million workers, while 85 censuses 1790 to 2010 and annual Census Bureau
Population Estimates released December 22, 2020
million jobs go unfilled around the globe.
These shortages are more than just a
challenge for HR directors or CEOs. Last December, William Frey of
These shortages will affect quality of life Brookings reported that the US
for everyone. population growth rate from 2019 to 2020
was a staggeringly low 0.35%—the lowest
When a shipping company is short tens recorded growth rate of any year since
of thousands of truck drivers, it means 1900, and probably the lowest since the
packages arrive late and essential goods birth of our nation. Even small changes in
go missing from grocery store shelves. growth have big implications. Increasing
When hospitals can’t find enough nurses, the rate of growth by just one-tenth of 1%
life-saving treatments get delayed, and (from 0.35% to 0.45%) between 2019 and
short-staffed, sleep-deprived medical 2020 would have meant an additional
teams make critical mistakes. When 327,000 people. But the national rate of
corporations can’t fill high-tech security growth generally continues to slow. 2010-
roles, everyday people are left vulnerable 2020 represents the lowest decade of
to data breaches and cyber attacks. population growth in US history.
Without enough people working to
provide the goods and services we’ve
come to expect, prices go up and the
speed and quality of service goes down.
THE DEMOGRAPHIC DROUGHT 22Looking further into the future, the UN United States of America: percentage of population aged 15-64 years
projects that the number of working-age
people in the US will fall below 60% of
the total population by the year 2100, and
66%
could drop to as low as 53%. The last time
the working-age population dropped 64%
near 60% was during the baby boom,
when the dependent population was 62%
primarily children. This time, the majority
of the country’s dependent population 60%
Observed
will be over age 65. Median prediction
58%
80% prediction interval
95% prediction interval
Using the UN’s medium scenario, the age 56%
60 sample trajectories
dependency ratio in the US is projected
to be 77 by the year 2100. That’s 77 54%
people of dependent age (under 15 and
1950 1960 1970 1980 1990 2000 2010 2020 2030 2030 2040 2050 2060 2070 2080 2090
over 65) for every 100 people of working
Source: United Nations, DESA, Population Division
age. But keep in mind, not all people
of working age will actually have jobs.
(As we saw in Chapter 2, LFPR among
prime-age people has already dropped
significantly.) What this means is that 50 years of baby bust
even if workforce participation reverts to Millions of Americans will be absent first
our 20-year high, current demographic from the classroom and then from the
trends will leave almost two-thirds of the labor market because, to put it bluntly,
US population dependent for financial they were never born.
support on the remaining one-third by
2100. Given the steep cost of care for We briefly discussed total fertility rate
elderly dependents, the financial burden (TFR) in Chapter 1. As a reminder, in order
on the working-age population will be for the US population to replace itself, the
immense. Perhaps impossible. TFR needs to equal 2.1, or 2.1 children per
1 woman. When the TFR stays at 2.1, one
The US has not yet had to deal with a child is born to replace every person now
shrinking total population (as is already living. The population doesn’t grow, but it
afflicting Europe, Russia, and Japan), is at least replaced.
but we need to wake up to reality: our
population growth has slowed and is The problem, as we mentioned earlier, is
projected to begin shrinking by 2062. that America’s TFR has been far below 2.1
The current struggle to find talent is not since 1971. In 2017, the TFR in the US had
simply a matter of too few people with fallen to 1.7—down from 3.7 in 1960. Data
the requisite skills to fill open roles. It is compiled from 32 US states indicates
becoming a matter of simply too few that in 2020 alone, the birth rate fell more
people. than 4%. This means that fewer and fewer
young people are rising through the ranks
How did we get here? to attend college or enter the workforce.
THE DEMOGRAPHIC DROUGHT 23From 2003 to 2017, the US total fertility rate (TFR) fell from an average of 2.04 live births in a woman’s lifetime to 1.77. The
number of states with a TFR above replacement rate (2.1) dropped from 15 to 2: Utah and South Dakota.
At or above replacement rate Below replacement rate
Total fertility rate: 2.57 2.3–2.39 2.2–2.29 2.1–2.19 2.0–2.09 1.9–1.99 1.8–1.89 1.7–1.79 1.6–1.69 1.5-1.59
2003 2017
TFR: 2.04 TFR: 1.77
Source: CDC National Vital Statistics Report, 2019
Fertility numbers vary by state, but the Low fertility has changed America’s ideal youth-heavy population “pyramid”
trend toward fewer and fewer children into a middle-aged balloon
per household does not. The maps above
illustrate the dramatic decline from 2003 1990 US Population by Age Cohort 2019 US Population by Age Cohort
to 2017. 85
80-84
75-79
In 2003, nearly a third of US states had 70-74
65-69
fertility rates above 2.1. But in just 14 years,
60-64
only two states (Utah and South Dakota) 55-59
50-54
had fertility rates above the replacement 45-49
level. And these numbers continue to 40-44
35-39
drop. States like Oregon and much of 30-34
New England have fertility rates closer to 25-29
20-24
that of Japan. 15-19
10-14
5-9
As fewer children are born and greater 0-4
numbers of Americans live into their 15M 10M 5M 0 5M 10M 15M 15M 10M 5M 0 5M 10M 15M
eighties and beyond, the traditional Male Female Born in the 1950s Born in the 1980s
age pyramid (where younger people Source: Emsi labor market analytics, 2021
outnumber older people; see the chart
on the left) now resembles an age bubble A country with a pyramid-shaped age distribution is one with a
(with older outnumbering younger; see large up-and-coming young population. In the US, the pyramid-
the chart on the right). shaped age distribution of the past contributed to boomer-
driven economic prosperity (ironically, a crucial factor allowing
the boomers to amass such unprecedented wealth was the
THE DEMOGRAPHIC DROUGHT 24decision to have fewer children than their younger years. Raising a child to
their parents, which partially enabled adulthood now costs American parents
more women to join the workforce and close to $234,000—roughly the cost of
contribute to household income, as we buying a house.
discuss in item 5 below.).
URBANIZATION
No single factor is responsible for
the global drop in fertility, and no With fewer hands needed to run family
single factor is likely to turn it around. farms, populations shifted from rural
Moreover, not all the factors involved areas toward cities. Historically, urban
can be painted as an unqualified evil areas tend to have lower fertility rates.
that it would be universally beneficial Reasons may include tighter living
to eliminate, and even fewer have an conditions, higher cost of living, and
obvious short-term solution. Our goal in changes in cultural values between city
identifying contributing factors is not to and country.
outline a simplistic path to reversal, but to
foster conversations about the following:
SECULARIZATION
• The long-term factors that are here Religion plays a well-documented role in
to stay and what strategies can best boosting fertility. One study found that
mitigate the negative consequences those with strong religious affiliations
have .8 more children than their non-
• The short-term measures that will religious peers. According to a 2021
allow us to cope with what can’t be Gallup poll, membership in American
mitigated at this point. churches, synagogues, and mosques
has plummeted over the last 20 years,
Plans for reversing the current from 70% in 1999 to 47% in 2020. As
demographic trends are not within the religion declines in the US, the religious
scope of this paper, but outlining some incentives to procreate have declined
of the contributing factors can help with it. Yet even among religious groups
us understand the complexity of the with historically high birth rates, fertility
matter. Researchers point to a range of has dropped over time.
considerations that affect the decision
to have a child—some economic, some
DECLINE AND DELAY OF MARRIAGE
religious, some personal. These include
the following factors: Married people have more children than
unmarried people, and marriage rates
fell from 72 to 50% between 1960 and
INDUSTRIALIZATION
2016. At the same time, among those
In pre-industrial societies, children could who do marry, the average marriage
quickly become financial contributors age rose from early 20s in 1960 to 28 for
to their families, working as hands on women and early 30s for men by 2020.
the family farm for example. But with Delaying marriage reduces the number of
mechanization, industrialization, and the childbearing years remaining for married
introduction of child labor laws, children women. This is one of the reasons that
gradually ceased to be economic women in the US end up having fewer
assets. In the modern economy, kids children than they would like. During
are now seen as liabilities, especially in 2020, marriage rates, already at an
THE DEMOGRAPHIC DROUGHT 25all-time low, dropped even further. In professor Phil Levine calculates that
Florida alone there were 28,000 fewer every 1% drop in the employment rate
weddings last year than there would brings a 1% drop in births.
have been had 2019 marriage trends
continued. Will there be a flood of Initial reports following the economic
weddings once everything calms down? crisis of 2020 bear this out. By December
Hard to say. 2020—eight months after unemployment
soared to terrifying heights—births
were already down as much as 30% in
WOMEN’S EDUCATION AND EMPLOYMENT
some US states over the same period in
From a global perspective, the inverse 2019. This supports earlier projections
relationship between women’s education from Brookings forecasting as many as
and fertility rates is well documented. 500,000 fewer US births in 2020 than
As education and career opportunities the already declining number expected
are made available to women, they before COVID. As The Wall Street
frequently choose to delay or avoid Journal reports, “The longer a crisis lasts,
marriage and motherhood in pursuit the higher the chances that potential
of other goals. However, this does not births aren’t just postponed but never
mean that education has to be at odds happen, say demographers.” With birth
with fertility. In the United States, the rates already near record lows in 2019,
highest birth rate is among mothers with a significant COVID-related baby bust
a graduate degree—nearly double that would push the US even further toward a
of mothers with less than a high school demographic drought.
education.
The list could go on. Additional
DEBT AND DELAYED COLLEGE ENROLLMENT reasons for preventing or postponing
childbearing include political instability,
College enrollment has, until very housing costs, lack of childcare,
recently, been at record highs. Extending increased access to abortion and
education further into adulthood tends contraceptives, environmental concerns,
to delay childbearing since students and cultural pressures, among others.
prefer to put off marriage and starting
families until after graduation. Student
debt is also at historic highs, making the
financial commitment of parenthood
more intimidating.
UNEMPLOYMENT AND ECONOMIC UNCERTAINTY
Low fertility often coincides with
recessions. Given the long-term costs
of raising children, financial stability is
a major factor in the decision to grow a
family. Millennials cite financial worries as
a primary reason for postponing a variety
of milestones, including having children.
Unemployment is one part of that
equation. Wellesley College economics
THE DEMOGRAPHIC DROUGHT 26CH 4.
WORKFORCE FUTURE TAKEAWAYS
The Grim
»Shrinking populations in Germany, the UK, and
France alone will mean over $1.2 trillion in lost
revenue by 2030.
Implications of »The US faces the shortfall of 8.5 million workers
in years to come, which will cause both higher
education institutions and businesses to desperately
Living Below 2.1
compete for recruits who simply don’t exist.
»The US stands to lose $162 billion annually due to
talent shortages.
THE DEMOGRAPHIC DROUGHT 27You can also read