The impact of the 2018 Families Package Accommodation Supplement area changes on housing outcomes - Dean R. Hyslop and David C. Maré January 2022
←
→
Page content transcription
If your browser does not render page correctly, please read the page content below
Motu Working Paper 22-01

The impact of the 2018
Families Package
Accommodation Supplement
area changes on housing
outcomes

Dean R. Hyslop and David C. Maré
January 2022
The impact of the 2018 Families Package Accommodation Supplement area changes on housing outcomes

Document information
Author contact details
Dean R. Hyslop and David C. Maré
Motu Economic and Public Policy Research
PO Box 24390
Wellington 6142
New Zealand
Email: dean.hyslop@motu.org.nz; dave.mare@motu.org.nz

Acknowledgements
This research was supported with funding from the Ministry of Social Development (MSD) as part of the
Families Package Impact Studies project. We have benefited greatly from many policy and data related
discussions and comments from Lars Arnesen, David Rea, Evan Thompson and Moira Wilson; and careful peer
reviews by Jordy Meekes, Tim Maloney and David Rea.

Disclaimer
These results are not official statistics. They have been created for research purposes from the [Integrated Data
Infrastructure (IDI) which is carefully managed by Stats NZ. For more information about the IDI please visit
https://www.stats.govt.nz/integrated-data/. The opinions, findings, recommendations, and conclusions
expressed in this file are those of the authors, not Stats NZ or MSD.
All results presented have been confidentialised in accordance with Statistics New Zealand’s requirements. In
particular, all sample sizes and counts have been randomly rounded to base 3 (RR3).

Motu Economic and Public Policy Research
PO Box 24390 info@motu.org.nz +64 4 9394250
Wellington www.motu.org.nz
New Zealand

© 2021 Motu Economic and Public Policy Research Trust and the authors. Short extracts, not exceeding two
paragraphs, may be quoted provided clear attribution is given. Motu Working Papers are research materials
circulated by their authors for purposes of information and discussion. They have not necessarily undergone
formal peer review or editorial treatment. ISSN 1176-2667 (Print), ISSN 1177-9047 (Online).

 i
The impact of the 2018 Families Package Accommodation Supplement area changes on housing outcomes

Abstract
In this paper we analyse the effects on rents of the substantial April 2018 changes in the
Accommodation Supplement (AS) policy. These policy changes adjusted which geographic
locations were assigned to each AS-area, and the AS-maxima were increased to reflect the rising
costs of housing in each AS-area. The result of these changes was that the maximum AS-
payments for recipients in all locations increased, and the increases varied across geographic
locations within redefined AS-areas. We exploit the relative changes in maxima that occurred on
either side of such AS-area boundaries to identify the effects of the policy changes on relative
rents in these boundary areas. First, we estimate that recipients on the side of boundaries with
larger increases in the AS-maxima received on average about $14-19 per week more in
accommodation support relative to recipients on the other side. Although we estimate that the
relative raw rent increase in the second year after the policy change was about $9 per week on
the boundary-sides that received larger increases, once we control for observable and fixed
unobservable characteristics of clients, we find negligible differences in rent changes. We
conclude that higher-rent new AS-recipients to the treatment areas largely explain the
composition changes in these areas, but explain little of the increase in average support. Finally,
regression kink analysis shows only weak evidence of stronger rent increases for AS-recipients
directly affected by the policy changes.

JEL codes
H22, R21

Keywords
Accommodation supplement, housing demand subsidy

Summary haiku
Rents have been rising
Housing support increases
did not increase rent

 ii
The impact of the 2018 Families Package Accommodation Supplement area changes on housing outcomes

Table of Contents
1 Introduction 1

2 Background, literature and theory 6
 2.1 Accommodation Supplement background 8

 2.2 Literature review 10

 2.3 Theoretical framework and predictions 13

3 Research design 15
 3.1 Boundary-area difference in difference analysis (BADD) 15

4 Data 18
 4.1 Accommodation Supplement related data 18

 4.2 Comparison of AS and Tenancy Bond rents 23

5 Boundary area difference-in-difference estimates 25
 5.1 Boundary analysis of rent effects 25

 5.2 Robustness analysis 27

 5.3 Subgroup effects 30

 5.4 Analysis of AS-boarder and homeowner effects 33

 5.5 Contributions to recipients’ income support 37

6 The composition of AS effects 38
 6.1 AS entry and exit 38

 6.2 Decomposing the effect of mobility on treatment effects 39

 6.3 Heterogeneous effects across initial rent ranges 44

7 Concluding discussion 48
 7.1 Summary of results 48

 7.2 Interpretation and implications 49

Appendix 1: Data description 53

Appendix 2: Description of boundary contrasts 55

Figures and Tables
Figure 1: Depiction of an increase in Accommodation Supplement on rental housing 56

Figure 2: 2018 Auckland and Wellington region boundary areas 57

Figure 3: Trends in accommodation support and rent – all boundary areas 58

Figure 4: Trends in accommodation support and rent – Central-Auckland boundary 59

Figure 5: Trends in Tenancy Bond and Accommodation Supplement weekly rents – All boundary areas and
Central Auckland 60

 iii
The impact of the 2018 Families Package Accommodation Supplement area changes on housing outcomes

Figure 6: Trends in numbers of new-tenancies and AS-recipients 61

Figure 7: Trends in accommodation support and board payments – all boundary areas 62

Figure 8: Trends in accommodation support and homeowner payments – all boundary areas 63

Figure 9: ‘Kinks’ in the Accommodation Supplement entitlement schedule 64

Figure 10: Rent change and rent density at policy kink points – All AS recipients (renters) 65

Figure 11: Rent change at policy kink points – Boundary sample 66

Figure 12: Rent Density at policy kink points – Boundary sample 67

Table 1: 2018 AS-maxima and changes, across areas and family size 68

Table 2: Sample characteristics – Full boundary sample (renters) 69

Table 3: Regression results – full boundary samples 71

Table 4: Regression results – separate boundary samples 72

Table 5: Regression results – full boundary samples, observed 2010-2021 73

Table 6: Tenancy Bond regression results – full boundary samples 75

Table 7: Regression results – 2km placebo and robustness checks 76

Table 8: Regression results – by family type 77

Table 9: Regression results – by gender and age 78

Table 10: Regression results – by ethnicity 79

Table 11: Regression results – by benefit and TAS receipt status 80

Table 12: Summary of relative income and rent changes 81

Table 13: Inflows, outflows, and changes, by year (All AS rental recipients) 82

Table 14: Contributions to cumulative (difference in difference) treatment effects 83

Table 15: Treatment effects and changes in location, family, or benefit 84

Table 16: Change in rent and total accommodation support, by initial rent range 85

Table A1: Description of AS-areas after 2018 policy change 86

Table A2: Description of Boundary contrasts used in the analysis 87

Table A3: Sample characteristics – Central Auckland (21_on_11) boundary 88

Table A4: Sample characteristics – Tenancy bond new tenancies, April 2010 - December 2020 89

Table A5: Regression results – sample of clients in first and final years 90

Table A6: Regression results – samples of AS-boarder and AS-homeowner recipients 91

Figure A1: Accommodation Supplement areas – pre- and post-2018 92

Figure A2: Rent change at policy kink points – Auckland boundary sample 94

Figure A3: Rent density at policy kink points – Auckland Boundary sample 95

 iv
The impact of the 2018 Families Package Accommodation Supplement area changes on housing outcomes

1 Introduction
Housing allowances to low-income individuals and families are an important component of most
developed countries’ housing policies. 1 By assisting low-income households to access good-
quality affordable housing, these policies help facilitate other social policy objectives, including
poverty reduction, improved health and education, and equal opportunity and social inclusion
(e.g: Eerola, 2021; Gubits et al., 2016; Kennedy, 1980; Mills et al., 2006; Orr et al., 2003; Wood et
al., 2008). However, one concern with the efficacy of housing allowances is the extent to which
some of the benefits accrue to landlords in the form of higher rents. 2 Although the international
literature generally has found that housing allowances result in higher rents, there is substantial
variability in the estimates, both across and within countries, as well as by estimation method
(e.g.: Brewer et al., 2019; Collinson & Ganong, 2018; Eerola & Lyytikäinen, 2021; Eriksen & Ross,
2015; Fack, 2006; Gibbons & Manning, 2006; Hyslop & Rea, 2019; Kangasharju, 2010; Laferrère
& Le Blanc, 2004; Susin, 2002; Viren, 2013). In a recent partial review, Brackertz et al. (2015)
conclude that the range of estimated landlord capture varies from 0.3 to 0.8, with more credible
methodologies resulting in lower estimates. These estimates imply that between 20% and 70%
of the housing assistance is captured by recipients in the form of lower net housing payments.
 New Zealand has two major housing allowance support programmes for low-income
households. These have broadly similar objectives to provide housing support to recipients. First,
the Income Related Rent Subsidy (IRRS) is available for tenants in public housing. As its name
suggests, the IRRS that tenants receive is related to their income: it is calculated as the
difference between the market rent of the property and an income-determined rent, and is paid
directly to the public housing provider. Second, the Accommodation Supplement (AS) is available
to low-income private sector rental tenants, as well as boarders and homeowners with high
housing costs. A recipient’s AS allowance is determined by their accommodation costs, their
family structure and where they live, 3 and is abated with income.
 The structures of the IRRS and AS policies are quite different. The IRRS is a ‘percent of
income’ subsidy, that directly links a recipient’s rent obligation to their income and provides the

1 Del Pero et al. (2016) report that public spending on housing allowances among a variety of countries for 2012-13. New
Zealand is among a group of countries that spends between about 0.5% and 0.8% of GDP, with the UK being the only
country spending more than this amount (1.8% of GDP).
2 Del Pero et al. (2016) discuss how rents may increase with housing assistance. These include an increase in housing

demand at the extensive margin (i.e. from more tenants seeking housing), or at the intensive margin (recipients may
consume more housing); or landlords may raise rents when they know that tenants receive housing allowances, or general
rents may increase when landlords know a significant share of target population receive allowances.
3 The country is divided into four AS areas, according to the relative rent in geographic areas. Area-1 has the highest rents,

and Area-4 the lowest rents. Appendix Table A1 documents the geographic areas allocated to each AS-area, and appendix
Figure A1 shows graphically the AS areas before and after the 2018 policy changes.
 1
The impact of the 2018 Families Package Accommodation Supplement area changes on housing outcomes

subsidy to the public housing provider as a top-up to the market rent level. In contrast, the
Accommodation Supplement is a ‘percent of rent’ subsidy, that is linked directly to the
recipient’s accommodation costs, and paid to the recipient. There are two important
implications of these differences. First, while most IRRS recipients’ net rent is only 25% of their
income, AS recipients typically will pay substantially more of their income in rent. Second, the
policies provide different incentives for recipients with respect to rent levels: because IRRS
recipients’ net rent is entirely determined by their income, they have no incentive to economise
on the market value of their housing; in contrast, because AS recipients make co-payment
contributions across the full range of housing costs, they have an incentive to economise with
respect to their housing costs.
 In this paper we analyse the effects on rents of substantial changes in the Accommodation
Supplement policy that came into effect in April 2018. 4 These changes consisted of two broad
components. First, there was a reallocation of geographic areas across the four AS areas
according to the relative cost of housing in each area. Second, the AS-maxima in each AS area
were increased to reflect the rising costs of housing in each area. The changes in weekly maxima
are documented in Table 1. They vary in magnitude from $5 (5%) for single recipients in Area-2
to $80 (36%) for families of three or more in Area-1 and $75 (47%) for two-person families in
Area-1. The result of these policy changes was that the maximum AS-payments increased for
recipients in all locations, and the increases varied across geographic locations within redefined
AS-areas, as well as across existing AS-areas and family sizes.
 The reclassification of geographic locations into different AS-areas meant that the
boundaries between the AS-areas shifted. In turn, this resulted in substantially different relative
increases in the maximum AS payments for residents in locations that straddled such
boundaries. In this paper, we exploit the relative changes in maxima that occurred on either side
of such AS-area boundaries to identify the effects of the policy changes on relative rents in these
boundary areas. We adopt a similar research design and estimation approach to that used by
Hyslop and Rea (2018, 2019) in analysing the effects of a similar set of policy changes in 2005 on
changes around the newly created Central Auckland AS Area-1. In particular, we use regression-
adjusted difference-in-differences to compare the relative changes in rents from before to after
the policy change. We do this for recipients who lived close-to but on either side of a boundary
between areas with contrasting AS-maxima increases.

4 The AS policy changes were originally announced in the previous National coalition Government’s 2017 budget. These
changes were maintained by the Labour coalition government and included in the Families Package announced in
December 2017. Previous AS rebasing exercises occurred in 1997 and 2005, with the 2005 changes resulting in an increase
in the number of AS-areas across the country from three to four through the introduction of a new area around central
Auckland.
 2
The impact of the 2018 Families Package Accommodation Supplement area changes on housing outcomes

 Our analysis uses anonymised administrative data from Statistics New Zealand’s Integrated
Data Infrastructure (IDI) on Accommodation Supplement receipt since 2010. The AS data contain
demographic information on the primary AS-claimant and their family structure, as well as
details of their rental payments and AS and other welfare support payments. These data are
merged with MSD residential location information. The boundary analysis involves local
boundary areas, consisting of statistical meshblocks that lie within 1km of a contrast-boundary.
We characterise the “control” group associated with each contrast boundary as the side of the
boundary that did not involve an AS-area change, and the “treatment” group as the other side
that changed to a higher-maxima AS-area and hence received larger increases in the maxima.
Our main analysis focuses on AS-rent recipients over the four-years from April 2016 to March
2020. This spans the two years before and after the April 2018 policy change date. 5
 In addition to the AS data, we also analyse data from the Ministry of Business Innovation
and Employment’s (MBIE) Tenancy Bonds database in the IDI to document broader rental
market trends between April 2010 and December 2020. Using these data, we extend the AS
analysis to consider the effects on the broader rental market, and attempt to understand the
extent to which any increase in rent paid by AS recipients represent a ‘pure’ increase in rents to
landlords versus an increase in the quantity or quality of accommodation for recipients.
 We begin by documenting the longer-term trends in accommodation support and rental
payments for the contrast boundary control and treatment groups over the period since April
2010. This shows discrete step-increases in AS-support with the policy change in April 2018 for
recipients on both sides of the boundaries, and substantially larger changes for the treatment
areas. Across all boundary contrasts, average weekly AS-payments increased 55% in the
treatment group (from $73 to $113) compared to 18% in the control group (from $99 to $117).
Although these increases are moderated by temporary additional support (TAS) payments, 6
average total accommodation support increased 38% and 17% in the treatment and control
areas respectively (from $93 to $128, and $115 to $134). There were corresponding step-
decreases in the fraction of clients receiving the maximum-AS payments, with the fraction falling
33 percentage points (pp) (from 66% to 33%) in the treatment areas compared to 11 pp (from
47% to 36%) in the control areas. In contrast, there was no discrete change in average rents on
either side of the boundaries, although the average weekly rent increased about $7 per year

5 All analysis and discussion of dollar-values are in nominal terms. Because inflation was low over the main (2016-20)
analysis period (e.g. average annual CPI-inflation was 1.5%, and total inflation 6.5%), reported increases largely reflect real
housing cost increases. Also, as our primary focus is on the relative differences between boundary areas, any confounding
effects of inflation will be further reduced.
6 When a client has accommodation costs that are sufficiently high relative to their income, TAS can be used to assist with

those costs. Due to the increase in income resulting from increased AS-payments, there was an accompanying fall in TAS
payments.
 3
The impact of the 2018 Families Package Accommodation Supplement area changes on housing outcomes

faster in the treatment than the control areas following the policy change. We also document
that comparative trends in tenancy bond average and lower quartile (25th percentile, P25) new
tenancy rents have been substantially stronger than that of average AS-rents since 2012, with
little noticeable change after April 2018.
 We use difference-in-difference regression analysis to estimate the effects of the policy
changes on rents in the contrast-boundary sample. First, in line with the relative trends in rents,
we estimate that, on average, rents increased $6.40 per week more in the treatment group than
the control group over the 2-years after the changes compared to the 2-years before the
changes; and the relative increase was greater by the second year ($8.90) than in the first year
($6.55) after the changes. Compared to an estimated $18.60 per week average higher relative
total accommodation support in the treatment group by the second year, this suggests that
landlord capture of the increase was less than 50% ($8.90/$18.60=48%), implying that at least
half of the support accrued to AS recipients. However, these estimates include the effect of any
uneven changes in the mix of recipients on either side of the boundary. Controlling for
observable differences in AS-clients’ characteristics, the estimated relative rent increases are
roughly halved ($2.40 and $3.90 by the first and second years after the policy changes), while
the estimated relative increase in accommodation support was largely unchanged ($16.90 by the
second year), suggesting that the maximum landlord capture was less than one-quarter, so that
at least three-quarters of the support was thus captured by recipients. Further controlling for
fixed unobserved client effects, the estimated relative rent increases decline further to $1.10–
$1.40 and are statistically insignificantly different from zero, while there is little change in the
estimated relative increase in accommodation support (about $13.70 per week). Based on these
results we conclude there is little evidence that the relative increases in accommodation support
in the treatment areas led to stronger rent increases in those areas.
 We provide some separate analysis of patterns by ethnicity. Māori are about 3 percentage
points (6%) more likely to receive the maximum AS payments than all recipients and are slightly
(0.6 pp or 2%) more likely to receive TAS payments. We estimate that, for those living on the
treatment compared to the control sides of the boundaries, their total accommodation support
increased $11.70 – $18.35 per week, while their average relative rent increase was $1.70 – $8.70
per week. These estimates imply that the average after-rent increase in support was $8.30 –
$11.70 (or 49–87% of the increase in support). 7 Thus, at most half (and likely only 13-36%) of the

7The range of estimates are based on the following. First, the raw average relative increase in total accommodation
support was $17 per week, and average relative rent increase was $8.70: implying $8.30 increase in support after rent (or
49% of the $17 relative increase). Second, controlling for recipients’ observed differences in location and characteristics on
either side of the boundaries and over time, the corresponding estimates are $18.35 and $6.65 respectively by the second

 4
The impact of the 2018 Families Package Accommodation Supplement area changes on housing outcomes

relative increase in support associated with the policy changes that we analyse was spent on
higher rent payments, with the remaining support available for other costs.
 Pacific peoples are almost 10 percent of the AS recipients in our analysis sample. Pacific
peoples are less likely to receive either the maximum AS-payments or TAS payments than all
recipients but have higher average accommodation support and rent payments. These
differences likely reflect differences in family sizes and location of Pacific peoples compared to
all AS recipients – e.g. Pacific peoples are more likely to live in the Auckland areas, where rent
and accommodation support is higher. Associated with the policy changes we analyse, we
estimate that Pacific peoples’ average accommodation support increased $20.75 – $24.50 per
week, their average rent increased $0.90 – $11.70 per week, and their after-rent support
increased $12.20 – $19.85 per week (or 52-96% of the increase in support). 8 Thus, we find that
less than half (and possibly almost none) of the increase in support for Pacific peoples was spent
on higher rent payments.
 Given that relatively stronger growth in average rents in the treatment group areas is
absorbed by observed and unobserved differences in client-characteristics, we next attempt to
understand the sources of this growth. To do this, we condition on samples of treatment and
control group clients who received AS-payments in the March months of consecutive years, and
decompose the annual changes in average rents in each group. We find that the number of AS
recipients grew relatively strongly following the policy change, due to both an increase in the
inflow of new AS recipients and also a decrease in the likelihood of recipients leaving AS.
Furthermore, the net inflow of new or existing AS recipients with relatively high rental costs
contributed to a rise in average rents. This effect was stronger on the treatment side of
boundaries. In contrast, average rent increases for non-moving recipients who continued
receiving AS support were almost the same across boundaries.
 Finally, any behavioural response on the part of AS-clients is expected to depend on their
rent and AS-payments before the policy change. In particular, clients who previously received
the maximum AS-support were directly affected by the changes, while those who received less

year after the changes: implying a net gain after-rent of $11.70 (or 64% of the $18.35 relative increase in AS support). Third,
controlling also for constant unobserved differences of AS-clients, the estimated increases in support and rent are $13.10
and $1.70 by the second year after the changes, and imply the after-rent gain was $11.40 per week on average (87% of the
$13.10 increase in support).
8 This range of estimates is based on the following. First, the raw average relative increase in total accommodation support

over the two years following the policy change was $22 per week, and average relative rent increase was $9.70: implying
$12.80 increase in support after rent (or 56% of the $22 relative increase). Second, controlling for recipients’ observed
differences in location and characteristics on either side of the boundaries and over time, the corresponding estimates are
$24.50 and $11.70 respectively by the second year after the changes: implying a net gain after-rent of $12.80 (or 56% of the
$24.50 relative increase in AS support). Third, controlling also for constant unobserved differences of AS-clients, the
estimated increases in support and rent are $20.75 and $0.90 by the second year after the changes, and imply the after-
rent gain was $19.85 per week on average (96% of the $20.75 increase in support).
 5
The impact of the 2018 Families Package Accommodation Supplement area changes on housing outcomes

than their applicable maximum AS-payment were not directly affected. 9 To address this, we
analyse whether there were differences in rent changes for AS-recipients according to how their
rent compared to the pre- and post-change AS-maxima.
 The dominant pattern that we observe is one of mean reversion – renters with low rental
costs tend to have relatively high subsequent growth in rent, whereas renters with high rental
costs tend to have relatively low subsequent rent growth. We test whether this underlying
pattern varies depending on whether recipients have rental costs above or below the pre-
change or post-change thresholds for maximum AS payments. We find no evidence of
differential rent growth around these thresholds, or of recipients clustering around the
thresholds.
 The paper is organised as follows. We review and discuss New Zealand’s Accommodation
Supplement policy, the 2018 policy changes, and relevant international and New Zealand
literature on the effects of housing demand subsidies on rents. In section 3, we outline the
research design adopted in the analysis. Section 4 contains a description of the data to be used,
the characteristics of the sample, and the longer-term trends in the main variables of interest.
We present the main results in section 5, and detailed analysis of compositional effects in
section 6. The paper concludes with a summary discussion in section 7.

2 Background, literature and theory
We begin by providing some context as background for the following analysis. This includes a
general discussion of the coverage of New Zealand’s two main housing support policies (IRRS
and AS) which, combined, provide support for over 14% of the population: about 3.5% by IRRS,
and over 11% by AS. Following this, we provide a more detailed discussion of the AS policy
design and 2018 changes. We then provide a review of international literature on the effects of
housing support on rents, and the section concludes with a discussion of the expected effects of
the support increases on rents based on a standard neoclassical comparative statics exercise.
 Since its introduction in 1993, the Accommodation Supplement (AS) has been New
Zealand’s largest housing support policy. It currently provides non-taxable cash supplement
payments for low-income families with significant accommodation costs in private sector
housing, be they renters, boarders, or homeowners. AS also supported state housing tenants

9 That is, those not directly affected would not expect an increase in AS-payments because of the policy changes, while
those directly affected would receive an increase. The directly affected group can also be split according to whether their
rent was below or above the level associated with the post-change maximum, which affects whether they would receive
less than (or equal to) the full increase in maximum AS-support: furthermore, the former group will be subject to both an
income and substitution effect associated with the policy change, while the latter subgroup will be subject to just an
income effect.
 6
The impact of the 2018 Families Package Accommodation Supplement area changes on housing outcomes

until 2000, when the then Labour coalition government re-introduced an income-related rent
subsidy (IRRS) for state tenants. Since 2014, the IRRS has been available to tenants of Kāinga Ora
(formerly Housing New Zealand) and those in registered community housing providers (CHP).
Local council tenants are not eligible. The income-related-rent is calculated as 25% of a tenant’s
assessable income below a threshold, and 50% of their income above that threshold. For most
tenants this results in their net-rent being 25% of income, and the IRRS is paid to the housing
provider to top-up the difference to the market rent. Eligibility for IRRS is subject to an asset
test, but the vast majority (over 90%) of the 73,500 public housing tenants receive IRRS, at a cost
of $1.2bn (0.4% of GDP) in the 2020/21 fiscal year. 10
 The Accommodation Supplement covers most other (non-public housing) tenants. In
particular, AS covers local council tenants, as well as boarders and other non-main tenants in
public housing. Students are not eligible for AS, but those receiving Student Allowance can
receive Accommodation Benefit support payments. AS is both asset and income means-tested.
AS provides a 70% subsidy for rent above a threshold (determined as 25% of benefit income for
renters and boarders, and 30% for homeowners) up to a maximum that varies by family size and
across four sets of AS-areas. Since the 2018 policy changes, the maxima are currently set to the
40th percentile of size-adjusted area rent in 2016. As at June 2020, there were 349,000 AS
recipients, and the cost of AS was $2.0bn (0.6% of GDP) over the 2020/21 year. From the AS
recipient data analysed below, we estimate about 480,000 people were covered by AS-rent
(400,000) and board (80,000) claims in any month (and over 65,000 covered by AS-homeowner
claims). Compared to 2018 Census estimates, this suggests that AS provides support for about
40% of people living in private sector rental housing, 11 implying AS has broad coverage in the
rental market, and likely stronger incidence in the low-end of the market.
 In addition to eligibility varying according to the public- versus private-housing tenure of
IRRS and AS recipients, there are important differences in the structure of each policy. The IRRS
is a “percent-of-income” subsidy, with most recipients’ rent determined as 25% of their income,
and the difference paid to the housing provider landlord as the subsidy. In contrast, the AS is a
“percent-of-rent” subsidy, with most recipients likely paying more than 25% of their income in
net-rent. For example, a person on a main benefit is expected to pay 25% of their (benefit)
income on rent before they receive any AS support, then 30% of additional rent up to a
maximum rent, and 100% of additional rent above that level. For a single adult Jobseeker

10 Based on the 2018 Census, Stats NZ (2021) report 1.4m people live in rental housing, of which 12.9% are in Housing New
Zealand properties (pp. 38-39). This suggests about 180,000 people live in public housing, most of which is subject to IRRS.
11 That is, from Stats NZ (2021) numbers (pp. 38-39), we estimate about 1.22m are in private (non-public) housing. The

extent to which AS-recipients are non-main tenants in public housing implies the 40% coverage will over-estimate the true
AS-coverage of those in private rental housing.
 7
The impact of the 2018 Families Package Accommodation Supplement area changes on housing outcomes

Support (JSS) recipient with no other income in Wellington after the policy changes in 2018, their
weekly benefit was about $215 (net of tax: gross≈$240), they would pay the first $54 of rent
before any support; if their rent (≈$204) just qualified them for the maximum support level, they
would receive $105 of AS, leaving them with net rent payments of $99 or 46% of their net
income (i.e. 99/215, or 41% of gross income). 12
 Another potentially important background factor is the long-term decline in the rate of
homeownership in New Zealand. For example, 64.5% of households owned their own home in
2018, down from 73.8% in 1991 (StatsNZ, 2021). This suggests more renters who may have
previously bought a house, and AS-recipients potentially concentrated further down the overall
rent distribution. However, these changes are likely to be relatively slow (e.g., the home-
ownership rate was 65% in 2013), and thus expected to have minor effect on our analysis period.

2.1 Accommodation Supplement background
The Accommodation Supplement (AS) provides non-taxable cash supplement payments for low-
income families in private sector housing, be they renters, boarders, or homeowners. The AS is
designed so that eligible low-income families are expected to spend up to 25-30% of their
income on housing before they receive any support. They are then responsible for at least 30%
of any additional rental cost from that point. An applicant’s accommodation supplement
entitlement is determined by the following formula, 13
 = min{ , max{0, ∗ ( − 0 )}} − .
This formula has four elements: a minimum accommodation cost entry threshold (AccCost0),
below which AS is zero; a subsidy rate (set at 70% since 1997) for accommodation costs above
the entry threshold; up to a maximum payment entitlement, AS max; and finally, payments are
subject to abatement that depends on the applicant’s non-benefit income and assets. 14 The
minimum and maximum parameters vary by family size and beneficiary status, and the AS
maximum also varies across geographic areas, with the country divided into four classes of AS-
area on the basis of accommodation costs.
 In contrast to policy in some countries that provide 100% subsidy rates over a range of
housing costs (e.g., the US and the UK), a feature of New Zealand’s AS policy is co-payments

12 If they also earned the abatement free threshold $80 per week, their net-rent would be 31% of gross income.
13 The AS policy features are very similar to those of housing subsidies provided in several other countries, including
Australia (Martin et al., 2016), Finland (Eerola & Lyytikäinen, 2021), and France (Laferrère & Le Blanc, 2004).
14 Accommodation Supplement is not income tested for beneficiaries. Because of this, the income abatement threshold for

non-beneficiaries is set at the income level at which the main benefit applicable to their situation would be fully abated. For
non-beneficiaries, AS entitlement is subject to abatement for cash assets above $2,700 (singles) and $5,400 (others); and
for beneficiaries and non-beneficiaries, eligibility for AS is subject to a cash-asset limit of $8,100 for single persons, and
$16,200 for other recipients (https://www.moneyhub.co.nz/accommodation-supplement.html).
 8
The impact of the 2018 Families Package Accommodation Supplement area changes on housing outcomes across the full range of accommodation costs (i.e., full payment below the entry threshold and above the maximum, and 30% co-pay in between these levels). This co-pay feature ensures recipients have financial incentives to economise on the cost of housing. Together with other design features, 15 this may have important implications for how the incidence of the subsidy falls on the demand versus supply side (i.e. tenants versus landlords) of the housing market. The 2018 AS policy change involved two components. First, reflecting different trends in lower-end housing costs across the country, geographic areas were re-classified across four AS- areas which determine the maximum AS entitlement available to recipients. 16 Second, the AS- maxima within each AS-area were adjusted to reflect the changes in prevailing (40th percentile) rents for different family sizes. These changes are summarised in Table 1 and show that increases in the weekly maxima ranged from $5 (1 person, Area-2) to $80 (3+ people, Area-1), or from about 5 to 60% in relative terms. Together with the re-allocation of AS-areas, the actual change in the AS-max faced by recipients was often greater than these figures – e.g., much of the greater Auckland area was re-zoned from Area-2 to Area-1, resulting in substantially larger increases in the effective maxima in those areas ($65-$140 per week, or 65-88%). It is important to realise that the changes in the maximum AS payment rates have a direct effect only on recipients who would receive the pre-change maximum rate. For those recipients, the changes resulted in an increase in the amount of AS received and enabled them to increase their expenditure on housing or on other goods and services. Other recipients were affected only if they increased their accommodation costs above the pre-change maximum, or if there were indirect effects of the policy change on housing costs. Unfavourable indirect effects may have occurred, for example, if the increase in AS maxima leads to a general increase in rental costs due to increased housing demand. In this case, all tenants (recipients and non-recipients) will face higher accommodation costs than before the policy change. Alternatively, if the AS increase affects the rents only of those directly affected by the policy change (i.e. those with AS payments constrained by the pre-change maxima), then outcomes of other recipients should be unaffected. Such potential adverse spillover effects of the policy change are an important issue that we will consider and attempt to address. 2.1.1 Temporary Additional Support (TAS) In addition to AS, recipients facing particular hardship may also be eligible to receive a Temporary Additional Support (TAS) hardship benefit for up to 13 weeks per application. 15 For example, AS is a non-rationed entitlement, determined as a ‘percent of rent’ rather than a ‘percent of income’ subsidy, and paid directly to the recipient rather than the landlord. 16 We document the geographic area changes in appendix Table A1, and appendix Figure A1 shows the re-classification of the four AS-areas resulting from these changes. 9
The impact of the 2018 Families Package Accommodation Supplement area changes on housing outcomes

Although eligibility for TAS payments is broadly available for any form of hardship, high
accommodation costs appear to be a primary factor in the receipt of TAS. In our analysis, more
than a quarter of AS recipients also received TAS. The implications of TAS for the analysis are
unclear, potentially affecting both treatment intensity (i.e. relative AS changes) and treatment
response (i.e. relative demand for housing).
 First, in terms of the treatment intensity, for those receiving less than the maximum-TAS
payment, TAS payments abate at 100% as income increases, so AS payments associated with the
policy change will not increase total accommodation support until TAS is fully abated; while
those who are (censored) at the maximum-TAS, may receive an increase in AS. The other
consideration is that TAS recipients are more likely to receive the maximum-AS (over 80% in our
sample) than those not receiving TAS (one-third), implying that they are more ‘at-risk’ of being
directly affected by the policy change. Empirically we estimate that TAS and non-TAS recipients
received very similar increase in accommodation support on average. 17 Second, in terms of
treatment response, for those receiving the maximum-AS and less than the maximum-TAS, TAS
(hence total support) payments can increase at the same rate as rent, effectively implying no
recipient co-payment over that range, and so less sensitivity to rent changes.
 These factors appear to have offsetting effects on treatment and possible responses for
our boundary area analysis, although the former effects on the policy-change treatment
intensity are likely to dominate possible response differences. For these reasons, we treat TAS
receipt as an integral component of the accommodation support in our AS analysis, and focus
primarily on the total accommodation support, calculated as the sum of AS and TAS payments. In
addition, we examine whether TAS has any confounding effects on the results by stratifying the
analysis for AS-recipients who did and didn’t receive TAS payments.

2.2 Literature review
The research evidence on the impacts of demand-side housing subsidies on rents and other
housing outcomes is mixed. Although the international literature generally finds that housing
subsidies increase rents and other housing costs, the estimates vary widely, both across and
within jurisdictions. Findings appear to depend on design features of the subsidies (full or partial
subsidy, relative generosity, eligibility criteria, payment schedules), as well as on the research
design.

17For those receiving AS at the date of policy change (i.e. in March and April 2018), we estimate the increase in average AS
payments on the ‘treated’ relative to the ‘control’ sides of boundaries (i.e. the side with the larger relative versus smaller
increase in maxima) for TAS recipients is roughly double that of non-TAS recipients ($29.10 compared to $15.70). This
difference is balanced by almost the same relative drop in TAS, so that the relative changes in total accommodation support
(AS+TAS) are almost the same ($12.70 and $13 on average respectively).
 10
The impact of the 2018 Families Package Accommodation Supplement area changes on housing outcomes

 Research based on difference-in-differences type analyses using either area-level repeated
cross-sectional or panel data generally estimate positive impacts of subsidies on housing costs.
For example, in the US estimates range from small impacts (Eriksen & Ross, 2015) up to a
substantial elasticity of about 1.3 (Susin, 2002), meaning that a 1% increase in subsidy payments
leads to a 1.3% increase in local rental payments. In the UK, estimates of the proportion of
subsidy changes (decreases in this case) absorbed by changes in rents range between 0.6
(Gibbons & Manning, 2006) and 0.1 (Brewer et al., 2019). 18 In continental European countries
estimates are up to 0.8 for France (Fack, 2006; Laferrère & Le Blanc, 2004), and in the range 0.3–
0.6 for Finland (Kangasharju, 2010; Viren, 2013).
 In contrast, research based on more credible micro-level quasi-experimental research
designs that exploit specific aspects of the housing policy generally estimate smaller impacts of
housing subsidies on rents. For example, Collinson and Ganong (2018) estimate modest effects
for the US; and using a regression discontinuity design associated with subsidies being related to
apartment size (floor area) in Finland, Eerola and Lyytikäinen (2021) found no evidence of
subsidy pass through to rents.
 There are three existing New Zealand empirical analyses of the effects of AS. First, using
aggregate time series, Stroombergen (2004) analysed the effect of AS payments on weekly
rental payments from 1991 to 2003. He estimated very small and statistically insignificant rent
elasticities with respect to AS-payments, of 0.001 nationally and 0.002 in Auckland (e.g. a 10%
increase in AS payments is associated with a 0.01–0.02% increase in rent). Given that AS was
estimated to affect about 13% of the rental market (most likely concentrated in the lower end of
the rent distribution), he further analysed the relationship between lower quartile rents and AS,
and estimated a small and statistically significant but negative rent elasticity of -0.0025.
 Second, using an estimated model of the broader housing market, Grimes et al (2013)
simulated the effects of an increase in AS payments on rents and house prices. Simulating a 10%
increase in (real) average AS receipt by both renters and homeowners, they estimated short run
increases in rents directly as a result of the AS increase, and longer term (4-5 year) increases in
both house prices and rents (the latter indirectly because of higher house prices). The estimated
long-run rent and house-price elasticities are about 0.7 and 1.5 respectively, although the
authors caution that the simulated responses likely overstate the true impacts because of
collinearity and endogeneity issues involving AS and housing cost movements.

18 Brewer et al. (2019) conclude there is substantial heterogeneity in the effects of the policy change and find relatively
large responses associated with tenants who had been subsidised in higher-rent properties. They argue that the subgroup
of such tenants is likely more similar to the sample analysed by Gibbons and Manning (2006) which may explain at least
part of the difference in estimated impacts.
 11
The impact of the 2018 Families Package Accommodation Supplement area changes on housing outcomes

 Third, Hyslop and Rea (2018, 2019) conducted a micro-level analysis of a natural
experiment provided by the 2005 AS policy changes that created a new higher-subsidy area
(Area-1) around central Auckland. They used a difference-in-differences approach to compare
changes in rental payments by recipients who lived within 1km inside versus outside the new
Area-1 boundary over the two years before to the two years after the policy change. The
comparison of changes in local areas inside and outside the boundary mitigated possible
confounding effects of other broader area factors, such as stronger rent increases closer to the
centre of Auckland. Their analysis found no significant differences in rent changes over the first
year following the policy change, but that rents increased relatively more inside the boundary in
the second year after the change. By the second year after the policy change, rents were
estimated to have increased by $2.44 on average, while total accommodation support (i.e. AS
plus Temporary Additional Support, TAS, payments) increased by $6.81 per week for those inside
relative to outside the boundary: implying a 36% subsidy pass-through to rents. Furthermore,
although the estimated rent increases were stronger at the top end of the distribution where the
increase in support was larger, there was a uniform subsidy pass-through to rents.
 Finally, Russell (2020) analysed the effects of 2018 increases in Student Allowance and
Accommodation Benefit payments to eligible students on rents paid by students in Dunedin,
Palmerston North, and Wellington. She uses a difference-in-difference approach to estimate the
policy effects on the rents of students in these cities relative to a combined control group of
non-students in these cities and tenants in four other low-student cities (Gisborne, Napier,
Hastings, and Timaru).19 Russell finds little evidence of any increase in overall student rent
payments in response to the increased support available to students. However, she does
estimate statistically significant rent increases in larger student flats, particularly in Wellington
where the average rent increase was $25-30 per week for 3-4 and 5+ bedroom flats. The effects
for Palmerston North and Dunedin were $19 and $22 per week (respectively) for 5+ bedroom
flats, but -$7 and -$18 per week for 3-4 bedroom flats.
 Taken on face value Russell’s results suggest three relevant conclusions. First, to put the
latter estimates in context, they imply about 30-40% pass-through from the increase in total
student support to rents. Second, as Russell discusses, because the rent measure used is the
total rent associated with a tenancy, these estimated effects should be considered “… liberal
estimates of landlord capture …” (p.46); using an alternative, per-bedroom, measure of rent
leads to more conservative estimates of rent increases of 6-10.5% of the increase in student

19In explaining this combined control group, Russell discusses the rationale being to test for spillovers from student to non-
student rents in the ‘treatment’ cities. However, no estimates of these spillover effects appear in the analysis.
 12
The impact of the 2018 Families Package Accommodation Supplement area changes on housing outcomes

support. Third, she also estimates statistically significant reductions in tenancy crowding in 3-4
and 5+ bedroom flats in these cities (except in 5+ bedroom Wellington student flats, where
crowding worsened), which suggests the increase in rents may at least partly reflect an increase
in accommodation quality.

2.3 Theoretical framework and predictions
In this section, we address the possible theoretical effects of the 2018 policy changes on rents.
To do this, consider Figure 1 (copied from Hyslop and Rea (2019)), which depicts a stylised
summary of the effects of the Accommodation Supplement area changes on the supply and
demand for rental housing. 20 First, we assume the supply schedule (SS) of rental housing is
upward sloping in rent (price), and is unaffected by the policy changes; and, in the absence of
any accommodation supplement, the demand curve (DD) is downward sloping in rent. Second,
the accommodation supplement provides an ad valorem subsidy for rents between the
minimum rent price (Mn) which satisfies the AS-entry threshold of expenditure, and the rent
price associated with the maximum AS-payment (Mx), and provides a lump-sum subsidy for rent
above this level. Thus, the demand curve becomes less elastic (i.e. steeper) over the rent price
range between Mn and Mx: this occurs at Mx0 for AS-areas with a lower maximum, and Mx1 for
areas with a higher maximum. 21
 The analysis of the expected effect of the policy change becomes essentially a standard
comparative statics exercise. Figure 1 makes clear there will be no effect on the rental demand
when the price is low (below Mn). When the price is above this level, AS lowers the elasticity of
demand (i.e. the demand curve is steeper over this range) up to the price where the AS-
maximum is reached (Mx); while demand becomes more elastic (flatter slope) again above this
price. Furthermore, the AS policy changes will differentially affect the demand across boundary
areas only of those with rent above Mx0. So long as neither demand nor supply is perfectly
inelastic (vertical), we would expect the equilibrium rental price to increase and the quantity to
also increase. 22 How the incidence of the subsidy is divided between tenants and landlords

20 In this stylised depiction, we highlight the differences across area-boundaries and relative to the no-subsidy case, and
ignore the nuances associated with AS-changes for all areas. Also, the discussion of this figure is terms of a policy change
that increases the AS-maximum more on one side of a boundary than the other side from the same initial level (i.e. a “split”
boundary as discussed below). Analogous effects can be deduced for the case where the policy change led to different
increases in the maximum on either side of the boundary to the same level (i.e. the “merged” boundary case) For example,
suppose one side was unsubsidised initially (facing DD demand) while the other side was subsidised up to rent Mx0, and the
policy changes unified both areas with a subsidy up to rent Mx1.
21 An important implication of this framework is that demand must be inelastic (at least over the relevant range): if demand

is elastic, then quantity demanded falls relatively faster than the price increases, in which case expenditure on housing
(rental payments) will fall, so that AS support would also fall.
22 In the housing context, an increase in the quantity may represent either an increase in the size of housing rented by

tenants, or an improvement in the quality of their housing.
 13
The impact of the 2018 Families Package Accommodation Supplement area changes on housing outcomes

depends on the relative price elasticities of demand and supply, with the incidence falling more
on the less elastic side of the market. In particular, any subsidy increase will result in more
landlord capture (higher rent increase) the more elastic demand is relative to supply. Although
the relative elasticities of supply and demand, and hence how the incidence of an increase in AS
support falls, is an empirical question, it is worth noting that, by reducing the demand elasticity
(between the entry and maximum thresholds), the 70% subsidy rate acts to reduce the expected
incidence on landlords and increase the proportion of the support captured by recipients.
 Within this framework, we consider the two extreme outcomes. First, for landlords to
capture the total increase in AS in rent, would require the supply of rental properties is perfectly
inelastic (i.e., the supply curve is vertical). This would imply there is a fixed supply of rental
housing, that is unresponsive to the market level of rent for properties. Second, for tenants to
capture the total increase in AS would conversely require that low-income demand for housing is
perfectly inelastic (i.e. the demand curve is vertical), in which case demand for housing is
unaffected by the increase in support from the policy changes. This may occur, for example, if
low-income households consider some basic level of housing to be absolutely essential,
apportion the necessary budget from their income for this, and then allocate any surplus income
to other consumption, such as food, clothing, etc. If they initially received the maximum AS-
payment for this basic level of housing, the increase in accommodation supplement would then
be fully allocated to other consumption.
 Finally, to give a sense of the possible magnitudes we may expect using this framework,
suppose the price elasticity of supply is 0.37 (Wong & Morrissey, 2016), and the price elasticity
of demand is -0.21 (Koning & Ridder, 1997). 23 Given these values, the incidence of an increase in
subsidy will fall mainly on tenants, with the rent predicted to increase by about one-third (0.36 =
0.37/(0.21+0.37)) of the increase in AS support. Furthermore, if the estimated demand elasticity
is in the absence of ad valorem housing subsidy, the effect of the AS subsidy rate will be to lower
the demand elasticity over the rent range between Mx0 and Mx1, in which case the predicted
rent increase to tenants will be somewhat lower and the proportion of support captured by
tenants will be higher.

23In discussing AS in the context of rental market, Wong and Morrissey (2016) report nominal prices (rent) increased 62%
from 2005 to 2015, while supply increased 11% from 2006 to 2016. Based on a 25% increase in the Consumer Price Index
(CPI) over the same period (2005Q2 to 2015Q2), real rents increased 30%, and suggesting a price elasticity of supply of 0.37
(=0.11/0.30). Koning and Ridder’s (1997) demand elasticity estimate is based on a sample of low-income households
estimated to be eligible for Rent Assistance in The Netherlands in the mid-1980s. The -0.21 elasticity is similar to the price
elasticity of demand for rental housing (-0.18) for the US reported in Houthakker and Taylor (1970).
 14
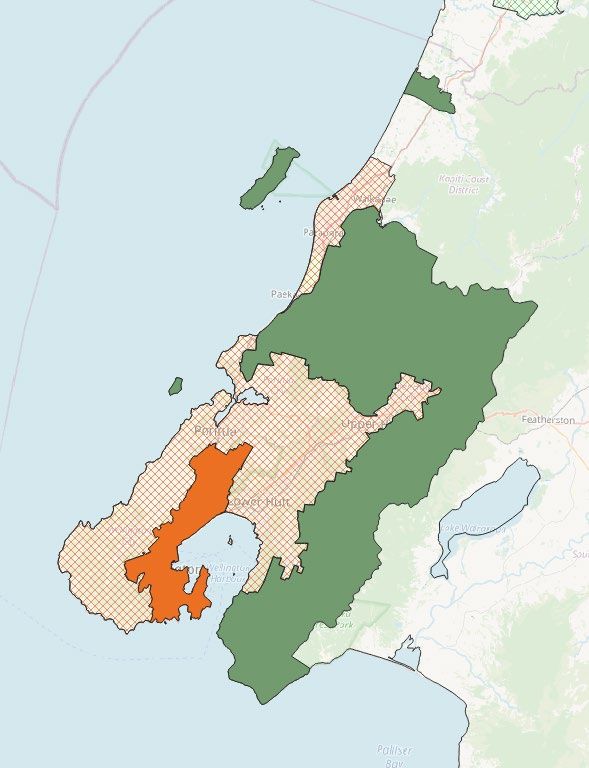
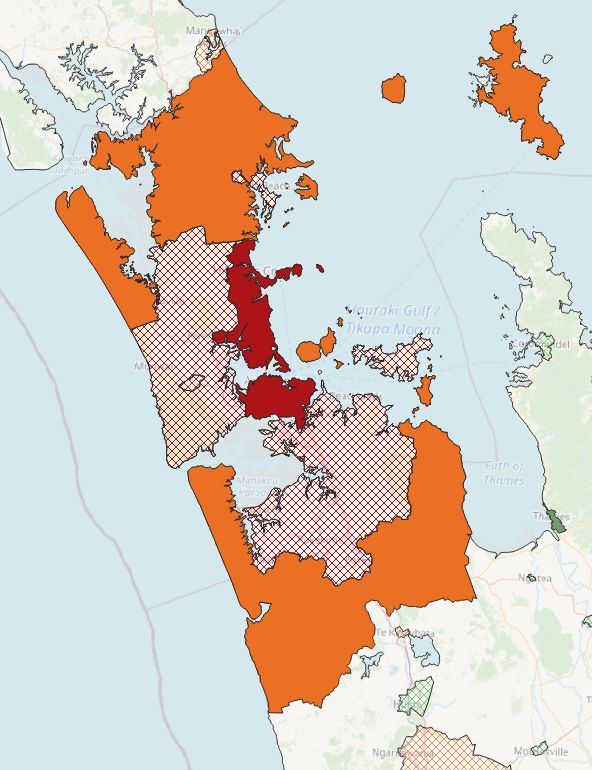
The impact of the 2018 Families Package Accommodation Supplement area changes on housing outcomes

3 Research design
Our analysis is based on an analogous approach to that used by Hyslop and Rea (2018). We
compare the relative changes in rents and AS-payments on either side of area-boundaries that
had contrasting AS-maxima increases due to the 2018 policy changes. This extends the previous
case-study approach of Auckland changes to analyse effects across the country. We also extend
that analysis to examine the relative changes in rents and AS-payments for recipients according
to whether their AS-payments were constrained by AS-maxima prior to the 2018 changes.

3.1 Boundary-area difference in difference analysis (BADD)
Our research design approach is a difference-in-difference analysis of the relative changes in
housing outcomes of recipients residing in local areas on either side of AS-area boundaries that
moved as a part of the 2018 policy changes. We will refer to this as the boundary-area
difference-in-differences (BADD) approach. In particular, we will identify recipients living close to
the boundary, based on the Stats NZ statistical meshblocks that they live in. The crucial
assumptions underlying this approach are: (i) that such finely-defined areas that share a
common border are part of the same local housing areas; and (ii) the relative policy changes
across the common border are largely driven by average rent changes within the broader AS-
areas to which the local border areas belong, and not driven by changes in these local boundary
areas.
 There are several prospective boundary areas to focus on as a result of the changes. We
restrict our focus to boundaries between AS-areas: where the AS-area changes on one side of
the boundary and remains the same on the other side. As the policy changes only ‘upgraded’
areas, in the sense of having higher maxima, we refer to the side of the boundary that changes
AS-area as the ‘treatment’ side, and the side that doesn’t change AS-area as the ‘control’ side.
The analysis is based on local areas, defined as being meshblocks that lie within 1km of these
boundaries. Appendix 2 contains more detailed discussion of the boundary area definition and
construction, and appendix Table A2 describes the 11 boundary areas that we focus on.
 Figure 2 shows the boundary changes around the Auckland and Wellington regions. Panel
(a) shows the 2005 Area-1 boundary around Central Auckland (in dark red) that was the focus of
the Hyslop and Rea (2018, 2019) analysis; the 2018 expansion of AS-area 1 to include the greater
Auckland areas (as shown by the cross-hatched area) resulted in substantially larger increases in
the AS-maxima outside as compared to inside this boundary. In addition, the outer Auckland
boundary between the expanded Area-1 and Area-2 (i.e. between the cross-hatched and lighter-
shaded orange shaded areas) also provides a boundary contrast. Similarly, panel (b) shows the

 15
You can also read